
How Fast Do Tsunamis Cross an Ocean? Travel Times From Run-up Records
On this page
Problem statement
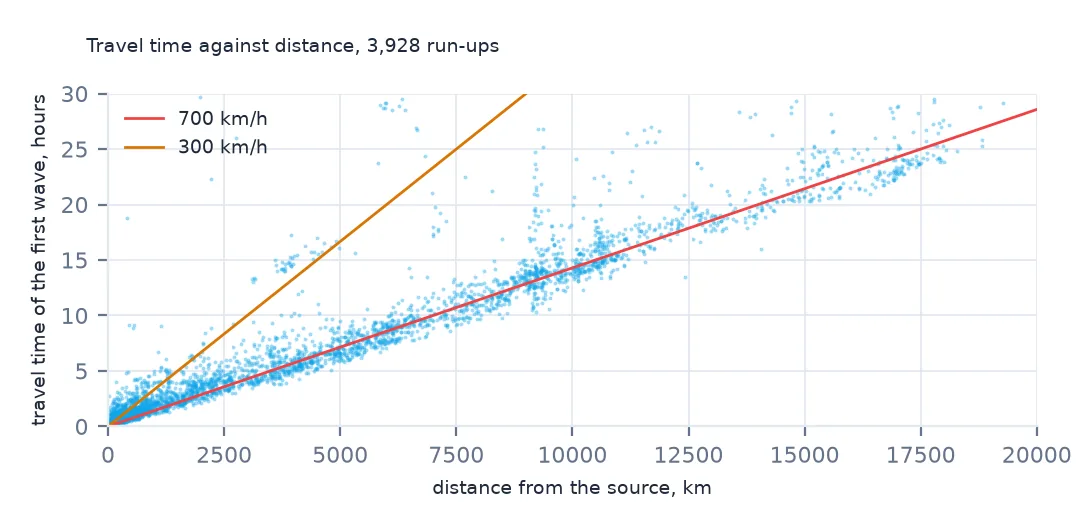
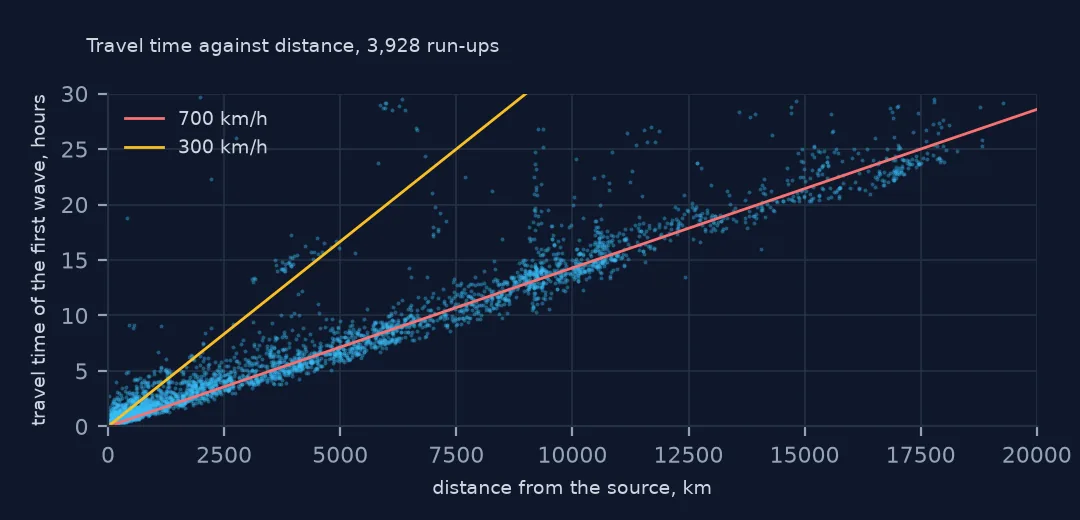
A tsunami in the deep ocean travels at the speed of a jet airliner and slows to the speed of a car as it reaches shallow water. That is why a wave from Chile reaches Japan almost a day later and why warning centres can give hours of notice far from the source. The run-up records hold the evidence: for many run-ups the database gives the distance from the source and the travel time of the first wave in hours and minutes. Divided, they give the average speed along the path. This page measures it for the great Pacific tsunamis and compares it with the shallow-water wave speed the ocean's depth predicts.
Quick answer
Combine travHours and travMins, keep run-ups with both, and divide the distance by the time:
t = ru.dropna(subset=["travHours", "distFromSource"]).copy()
t["hours"] = t.travHours + t.travMins.fillna(0) / 60
t = t[t.hours > 0]
t["kmh"] = t.distFromSource / t.hours
far = t[t.distFromSource > 2000]
print(f"run-ups with a travel time: {len(t):,}; over 2,000 km: {len(far):,}; median speed beyond 2,000 km: {far.kmh.median():.0f} km/h")
print(far.kmh.describe(percentiles=[0.1, 0.5, 0.9]).round(0).loc[["10%", "50%", "90%"]].to_string())
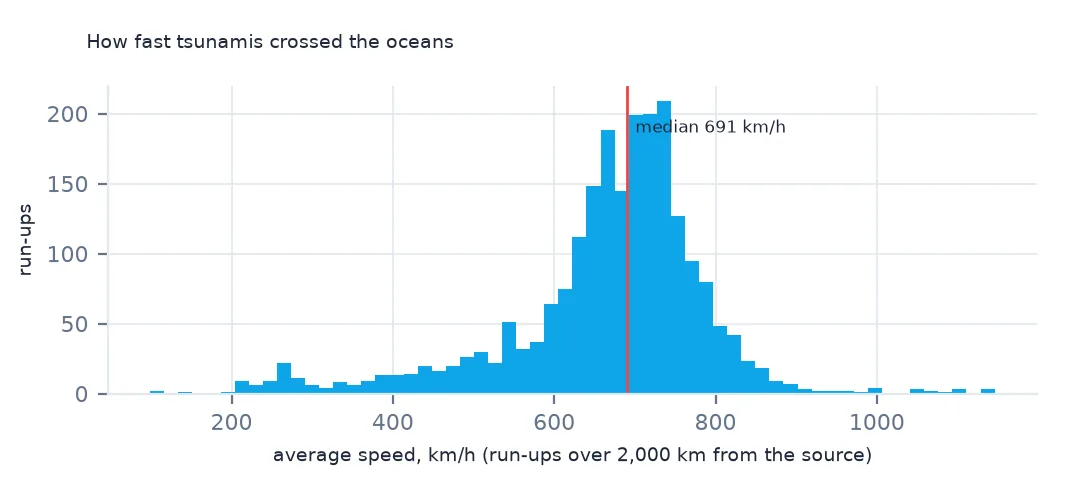
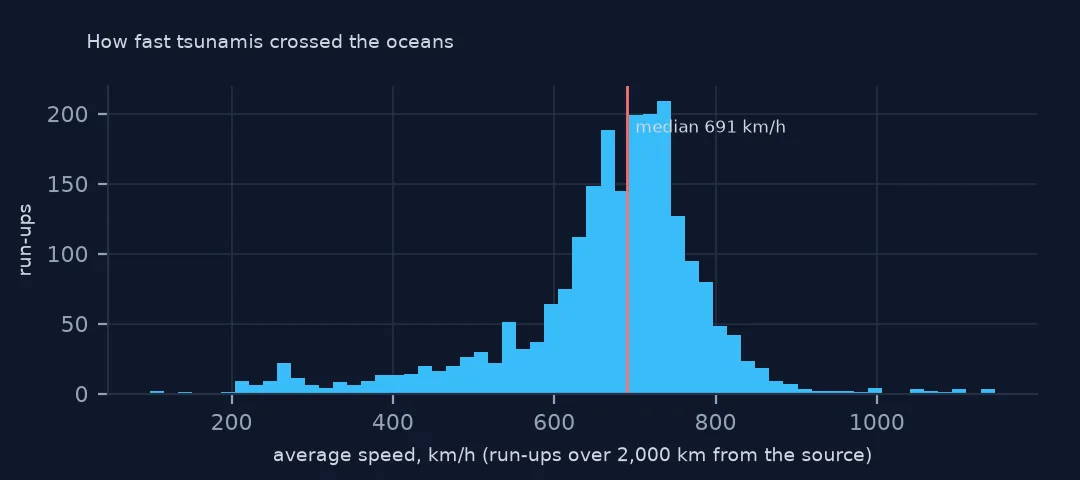
run-ups with a travel time: 4,016; over 2,000 km: 2,214; median speed beyond 2,000 km: 691 km/h
10% 504.0
50% 691.0
90% 788.0
4,016 run-ups have a travel time and a distance, and 2,214 are more than 2,000 km from the source. Their median average speed is 691 km/h, and the middle 80% lie between 504 and 788 km/h, the speed of a passenger jet.
Speed and depth
1. Speed rises with distance
print(t.groupby(pd.cut(t.distFromSource, [0, 100, 500, 2000, 5000, 20000])).kmh.agg(["size", "median"]).round(0).to_string()) size median
distFromSource
(0, 100] 231 162.0
(100, 500] 859 324.0
(500, 2000] 712 508.0
(2000, 5000] 707 671.0
(5000, 20000] 1507 695.0
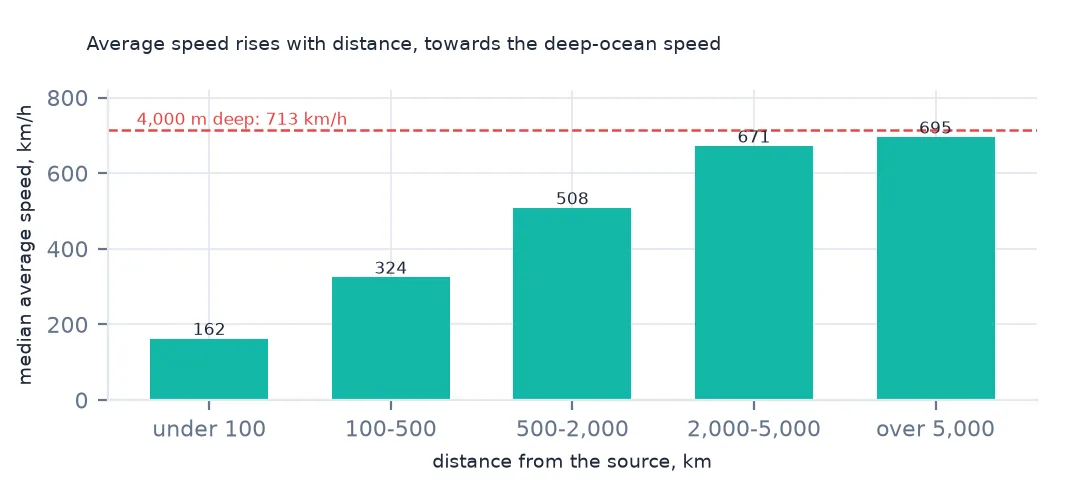
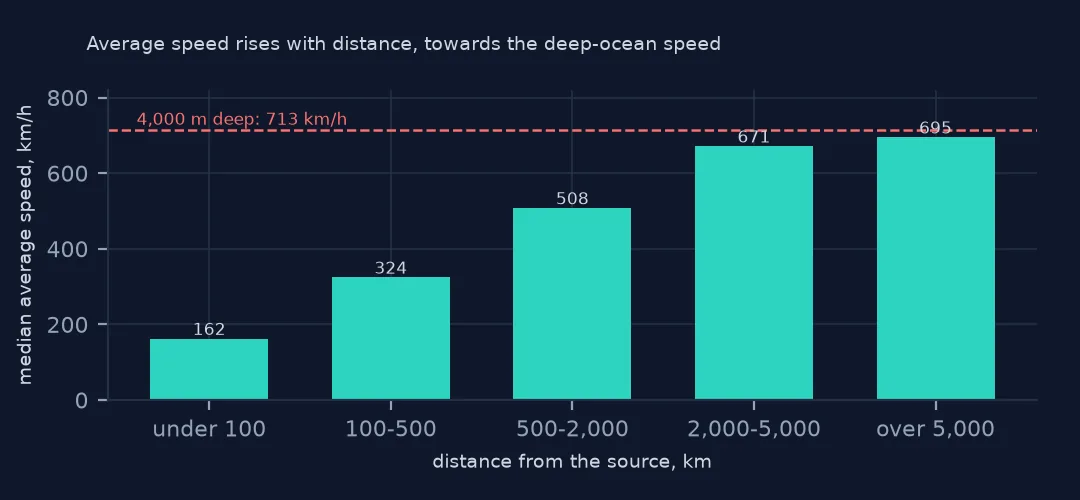
Within 100 km of the source the median is 162 km/h, and from 500 to 2,000 km 508 km/h. Over the longest paths the median levels off near 695 km/h.
Close to the source, most of the path is over the continental shelf and the wave is slow. A run-up 10,000 km away has crossed deep ocean for nearly all of that distance.
2. What depth predicts
for depth in [50, 200, 1000, 4000, 5000]:
    print(f"depth {depth:>5} m: {np.sqrt(9.81 * depth) * 3.6:,.0f} km/h")
depth 50 m: 80 km/h
depth 200 m: 159 km/h
depth 1000 m: 357 km/h
depth 4000 m: 713 km/h
depth 5000 m: 797 km/h
At 50 m deep a tsunami moves at 80 km/h, at 4,000 m at 713 km/h. The observed 691 km/h over ocean crossings matches a path averaging somewhat less than 4,000 m, with slower shallow stretches at each end.
In water shallow compared with its wavelength, a tsunami travels at the square root of gravity times depth. The Pacific averages about 4,000 m deep, which predicts roughly 700 km/h.
3. Three Pacific crossings
big = {1960: "Chile", 2010: "Chile", 2011: "Japan"}
ids = ev[(ev.year.isin(big)) & (ev.eqMagnitude >= 8.8)][["id", "year", "locationName"]]
x = far.merge(ids, left_on="tsunamiEventId", right_on="id", suffixes=("", "_ev"))
print(x.groupby(["year", "locationName_ev"]).kmh.agg(["size", "median"]).round(0).to_string())
size median
year locationName_ev
1960 SOUTHERN CHILE 117 663.0
2010 CENTRAL CHILE 128 669.0
2011 HONSHU ISLAND 152 742.0
The three great Pacific crossings in the record each give a median speed between 663 and 742 km/h: southern Chile in 1960, central Chile in 2010 and Japan in 2011. The Japanese wave was fastest, crossing more of the deep North Pacific.
Arrival times far away
The data used on this page
NOAA's Global Historical Tsunami Database from the National Centers for Environmental Information (doi:10.7289/V5PN93H7), public domain: every event and run-up from its HazEL API, downloaded on 19 October 2026 and saved on this site, because records are added and revised. Heights are in metres and distances in kilometres.
from pathlib import Path
import json
import zipfile

import geopandas as gpd
import numpy as np
import pandas as pd
import requests

Path("data").mkdir(exist_ok=True)
# NOAA NCEI Global Historical Tsunami Database (doi:10.7289/V5PN93H7): every event and every run-up from the HazEL API,
# with Natural Earth's 1:50m land and 1:110m countries. Saved 19 October 2026: events and run-ups are added and revised.
# Live: https://www.ngdc.noaa.gov/hazel/hazard-service/api/v1/tsunamis/events?page=1 (and .../runups), 200 a page
ARCHIVE = "ncei-tsunami-2026-10-19.zip"
if not Path(f"data/{ARCHIVE}").exists():
    Path(f"data/{ARCHIVE}").write_bytes(requests.get(f"https://data.spatialworkflow.io/{ARCHIVE}", timeout=600).content)
Z = zipfile.ZipFile(f"data/{ARCHIVE}")
ev = pd.DataFrame(json.loads(Z.read("tsunami-events.json")))
ru = pd.DataFrame(json.loads(Z.read("tsunami-runups.json")))
print(f"NCEI tsunami database: {len(ev):,} events, {len(ru):,} run-ups")
NCEI tsunami database: 3,138 events, 35,129 run-ups
Example 1: Hawaii and Japan from Chile, 1960
c60 = x[(x.year == 1960)]
print(c60[c60.country.isin(["USA", "JAPAN"])].groupby("country").agg(hours=("hours", "median"), km=("distFromSource", "median")).round(1).to_string())
hours km
country
JAPAN 24.9 17273.4
USA 15.5 10644.0
From southern Chile in 1960, the wave took a median 15.5 hours to reach the run-ups recorded in the United States, mostly Hawaii, about 10,600 km away, and 24.9 hours to cross 17,300 km to Japan. The run-up records put 63 deaths in the United States and 283 in Japan, people killed many hours after the earthquake, by a wave they could not feel coming.
Example 2: implausible speeds
print(f"run-ups faster than 1,000 km/h: {(t.kmh > 1000).sum()}; slower than 10 km/h beyond 1,000 km: {((t.kmh < 10) & (t.distFromSource > 1000)).sum()}")run-ups faster than 1,000 km/h: 88; slower than 10 km/h beyond 1,000 km: 0
88 run-ups imply more than 1,000 km/h, faster than any ocean depth allows. They are errors in the time or the date of arrival, or arrivals of a wave from a different source. Filter impossible speeds before averaging. No distant run-up is implausibly slow.
Internal links
- Run-ups of the 2011 tsunami — one event in detail
- Every tsunami at one place — Hilo's record of distant tsunamis
- Loading events and run-ups — the travel-time columns
- Great-circle distance — how source distances are measured