
Which Tsunamis Really Happened? Validity and Causes in NOAA's Tsunami Database
On this page
Problem statement
The tsunami database has over three thousand events, but not all of them were tsunamis. Some are old reports of waves that may have been storm surges or river floods, some are seiches in lakes and bays, and some are entries the compilers now consider wrong but keep so that nobody adds them again. Each event has a validity code from -1 to 4 and a cause code for what generated it: an earthquake, a landslide, a volcano, the weather, an explosion. Any count of tsunamis is a choice of validity, and any statement about why tsunamis happen is a choice of causes. This page reads both codes and shows what changes with each choice.
Quick answer
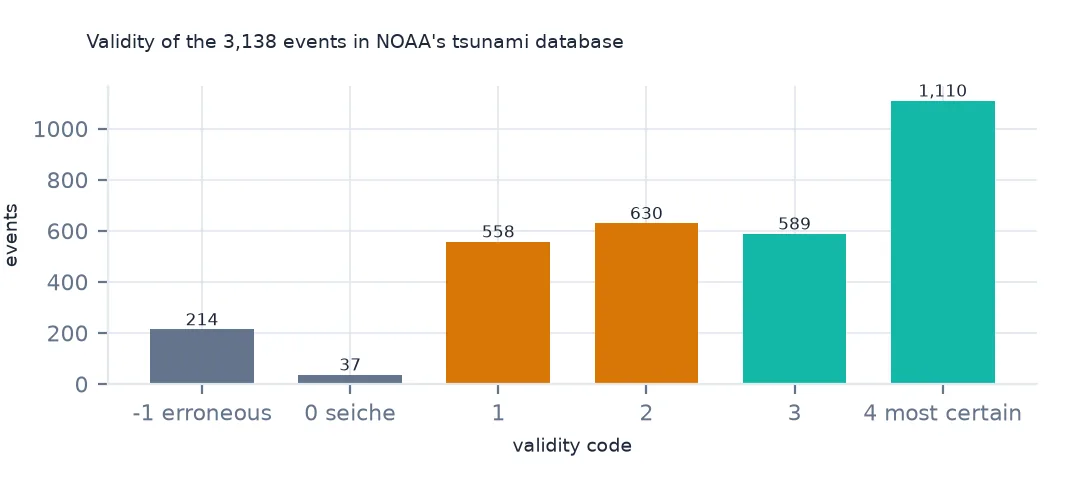
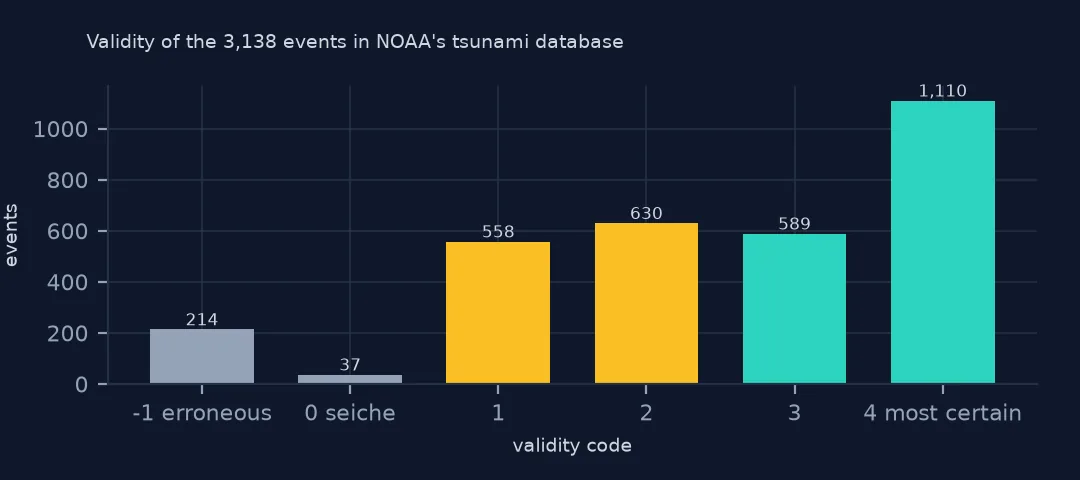
Count events by validity; -1 marks erroneous entries and 0 seiches, and the scale rises to 4 for the most certain:
print(ev.eventValidity.value_counts().sort_index().to_string())
print(f"validity 3 or 4: {(ev.eventValidity >= 3).sum():,} of {len(ev):,}")
print(ev.groupby("eventValidity").year.median().to_string())
eventValidity
-1 214
0 37
1 558
2 630
3 589
4 1110
validity 3 or 4: 1,699 of 3,138
eventValidity
-1 1860.0
0 1919.0
1 1870.0
2 1868.0
3 1906.0
4 1973.0
Only 1,699 of the 3,138 entries, 54%, are rated 3 or 4. 214 are marked as erroneous, kept so that nobody enters them again, and 37 are seiches, oscillations of a lake or bay rather than a tsunami. The certain events are recent: the median year of a validity-4 event is 1973, against 1868 and 1870 for the questionable and very doubtful ones.
Validity and cause
1. Validity over time
period = pd.cut(ev.year, [-3000, 1499, 1799, 1899, 1949, 2100], labels=["before 1500", "1500-1799", "1800-1899", "1900-1949", "1950 on"])
print(pd.crosstab(period, ev.eventValidity, normalize="index").round(2).to_string())
eventValidity -1 0 1 2 3 4
year
before 1500 0.07 0.01 0.23 0.28 0.20 0.22
1500-1799 0.12 0.01 0.27 0.24 0.16 0.21
1800-1899 0.10 0.01 0.25 0.30 0.20 0.14
1900-1949 0.07 0.02 0.21 0.23 0.20 0.27
1950 on 0.02 0.01 0.06 0.08 0.18 0.65
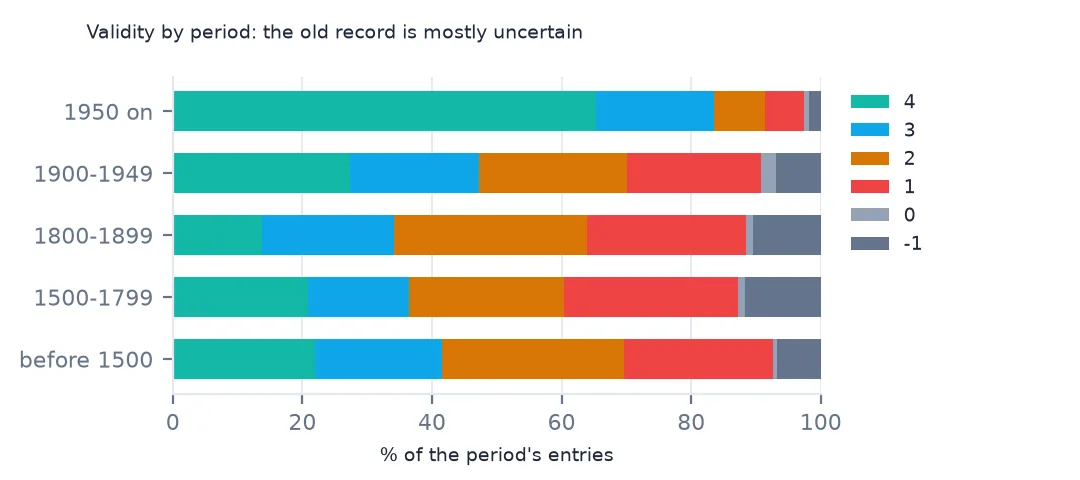
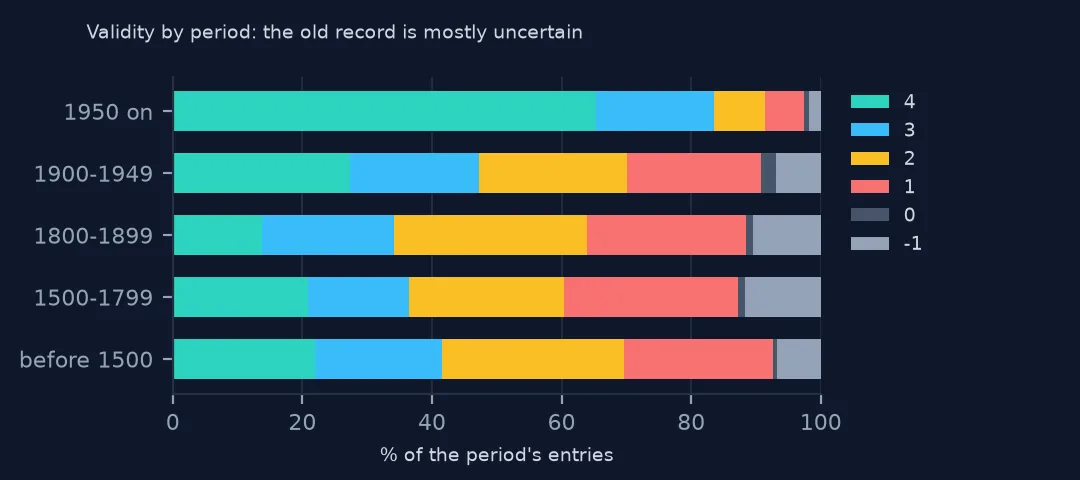
Since 1950, 65% of entries are validity 4 and only 14% are rated 1 or 2. Before 1900 about half of every century's entries are doubtful or questionable. Old tsunamis come from chronicles and letters that can't be checked against a gauge, so a long-term count without a validity filter mixes certain waves with rumours.
2. The cause codes, by example
cause = ev[ev.eventValidity >= 3].groupby("causeCode").agg(events=("id", "size"), example=("locationName", lambda s: s.iloc[-1]), year=("year", "last"))
print(cause.to_string())
events example year
causeCode
0.0 48 KOSRAE ISLANDS, CAROLINE ISLANDS 1985
1.0 1219 ISLA CAÑAS, PANAMA 2026
2.0 5 NOVA SCOTIA 1843
3.0 115 RIO SAN JUAN 1542
4.0 8 RABAUL HARBOR 1994
5.0 2 LAKE MONOUN 1984
6.0 74 THERA ISLAND (SANTORINI) 1650
7.0 19 ALTAR VOLCANO 2000
8.0 131 SURPRISE INLET, AK 2024
9.0 76 SANTA CATARINA 2026
10.0 2 RIPPLE ROCK, BC 1958
Among probable and definite events, 1,219 were caused by earthquakes, 131 by landslides, 115 by earthquakes with landslides and 76 by the weather, meteotsunamis such as the Santa Catarina wave of 2026. 74 were caused by volcanoes, including Santorini's in 1650, and 19 by volcanic landslides. Two were explosions, the latest the 1958 demolition of Ripple Rock in British Columbia, the largest non-nuclear explosion of its time.
3. How sure each cause is
print(pd.crosstab(ev.causeCode, ev.eventValidity >= 3, normalize="index").round(2).rename(columns={True: "validity 3-4", False: "lower"}).to_string())eventValidity lower validity 3-4
causeCode
0.0 0.86 0.14
1.0 0.41 0.59
2.0 0.91 0.09
3.0 0.19 0.81
4.0 0.64 0.36
5.0 0.00 1.00
6.0 0.46 0.54
7.0 0.05 0.95
8.0 0.16 0.84
9.0 0.59 0.41
10.0 0.00 1.00
11.0 1.00 0.00
The cause shapes the certainty. 59% of earthquake events are rated 3 or 4, but 81% of earthquake-with-landslide and 84% of landslide events, because those were mostly studied in the field. Only 41% of meteorological events are probable or definite, and none of the astronomical-tide entries. Unknown causes are almost all doubtful: 86% rated below 3.
Counting with a stated rule
The data used on this page
NOAA's Global Historical Tsunami Database from the National Centers for Environmental Information (doi:10.7289/V5PN93H7), public domain: every event and run-up from its HazEL API, downloaded on 19 October 2026 and saved on this site, because records are added and revised. Heights are in metres and distances in kilometres.
from pathlib import Path
import json
import zipfile

import geopandas as gpd
import numpy as np
import pandas as pd
import requests

Path("data").mkdir(exist_ok=True)
# NOAA NCEI Global Historical Tsunami Database (doi:10.7289/V5PN93H7): every event and every run-up from the HazEL API,
# with Natural Earth's 1:50m land and 1:110m countries. Saved 19 October 2026: events and run-ups are added and revised.
# Live: https://www.ngdc.noaa.gov/hazel/hazard-service/api/v1/tsunamis/events?page=1 (and .../runups), 200 a page
ARCHIVE = "ncei-tsunami-2026-10-19.zip"
if not Path(f"data/{ARCHIVE}").exists():
    Path(f"data/{ARCHIVE}").write_bytes(requests.get(f"https://data.spatialworkflow.io/{ARCHIVE}", timeout=600).content)
Z = zipfile.ZipFile(f"data/{ARCHIVE}")
ev = pd.DataFrame(json.loads(Z.read("tsunami-events.json")))
ru = pd.DataFrame(json.loads(Z.read("tsunami-runups.json")))
print(f"NCEI tsunami database: {len(ev):,} events, {len(ru):,} run-ups")
NCEI tsunami database: 3,138 events, 35,129 run-ups
Example 1: three counts of 20th-century tsunamis
c = ev[(ev.year >= 1901) & (ev.year <= 2000)]
print(f"all entries: {len(c):,}; validity 1 or more: {(c.eventValidity >= 1).sum():,}; validity 3 or 4: {(c.eventValidity >= 3).sum():,}; 4 only: {(c.eventValidity == 4).sum():,}")
all entries: 1,190; validity 1 or more: 1,112; validity 3 or 4: 722; 4 only: 504
The 20th century has 1,190 entries in the table. Leave out the erroneous ones and seiches and 1,112 remain, keep only probable and definite ones and there are 722, and definite only, 504. Each is a defensible count of 20th-century tsunamis, and they differ by more than a factor of two.
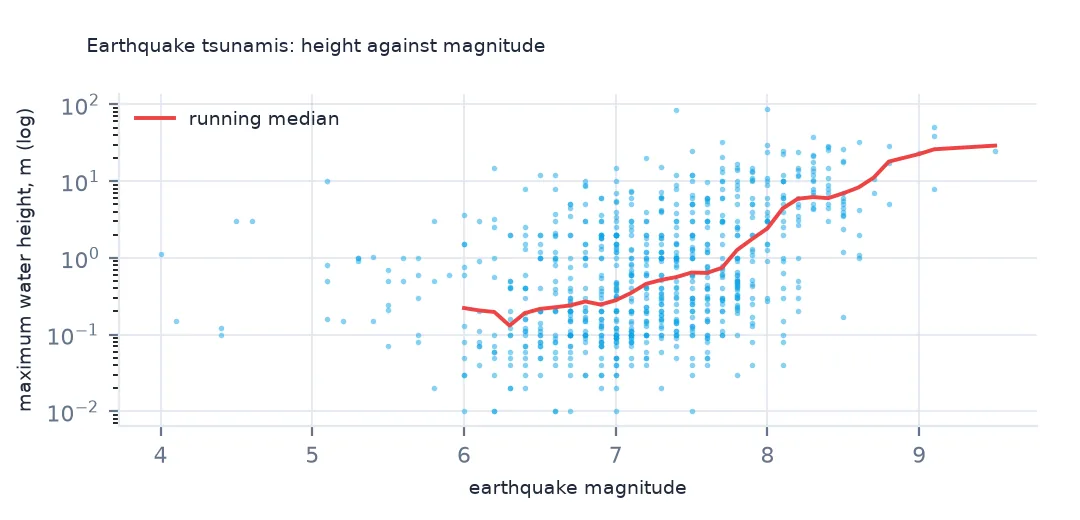
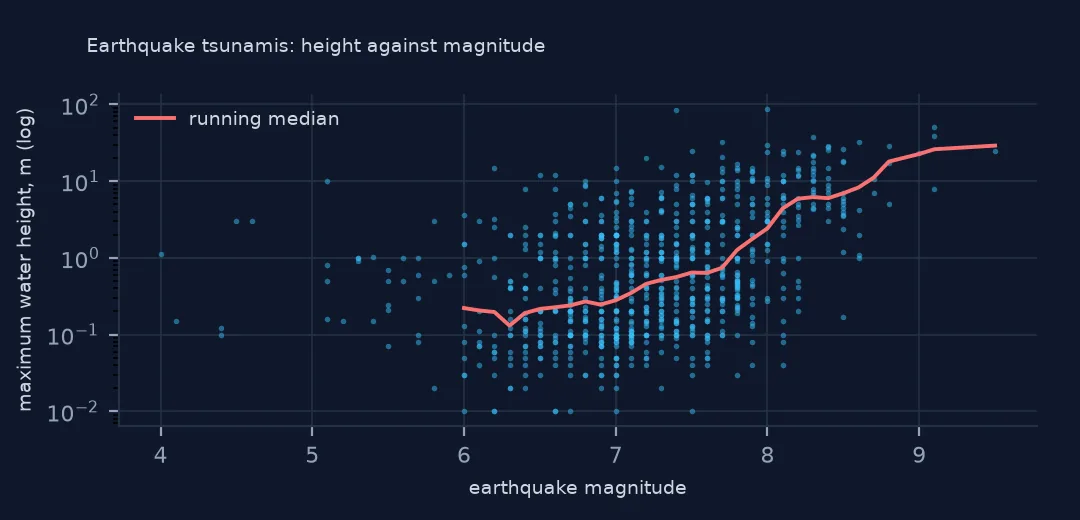
Example 2: earthquake tsunamis and magnitude
q = ev[(ev.causeCode == 1) & (ev.eventValidity >= 3) & ev.eqMagnitude.notna()]
print(q.groupby(pd.cut(q.eqMagnitude, [5, 6.5, 7, 7.5, 8, 8.5, 10])).maxWaterHeight.agg(["size", "median"]).round(2).to_string())
size median
eqMagnitude
(5.0, 6.5] 203 0.20
(6.5, 7.0] 298 0.24
(7.0, 7.5] 275 0.50
(7.5, 8.0] 206 0.90
(8.0, 8.5] 97 6.00
(8.5, 10.0] 18 10.70
Among probable or definite earthquake tsunamis, the median maximum height grows from 0.2 m for magnitudes up to 6.5 to 6.0 m for 8.0 to 8.5 and 10.7 m above 8.5. Below magnitude 7.5, most earthquake tsunamis are only measurable on gauges. The jump comes between 7.5 and 8.5, where an earthquake ruptures enough of the sea floor to lift the whole water column.
Getting the tsunami data without code
- Search and look: NOAA's tsunami event search filters events by date, place, cause, validity, deaths and wave height. A related search covers run-up locations, and events link to their run-ups and to the earthquake or eruption behind them.
- Download: search results can be downloaded from the search pages. The same records come as JSON from the HazEL API (
https://www.ngdc.noaa.gov/hazel/hazard-service/api/v1/tsunamis/events, and/runups), 200 records a page. - About the data: NCEI's database overview describes the sources and warns that run-up heights don't always say which sea level they were measured from.
- Terms and credit: the database is public domain. Cite it as National Geophysical Data Center / World Data Service, Global Historical Tsunami Database, NOAA National Centers for Environmental Information, doi:10.7289/V5PN93H7, with the date you accessed it.
- The copy these pages use: every event and run-up as of 19 October 2026, at data.spatialworkflow.io.
Internal links
- Loading events and run-ups — the two tables
- Tsunamis by cause — what the cause codes add up to
- Amount-order codes — the other coded columns
- The deadliest tsunamis — a ranking that depends on validity