
Drought Monitor Dates Are a Week Off: Map Date, Valid Period and Release Day
On this page
Problem statement
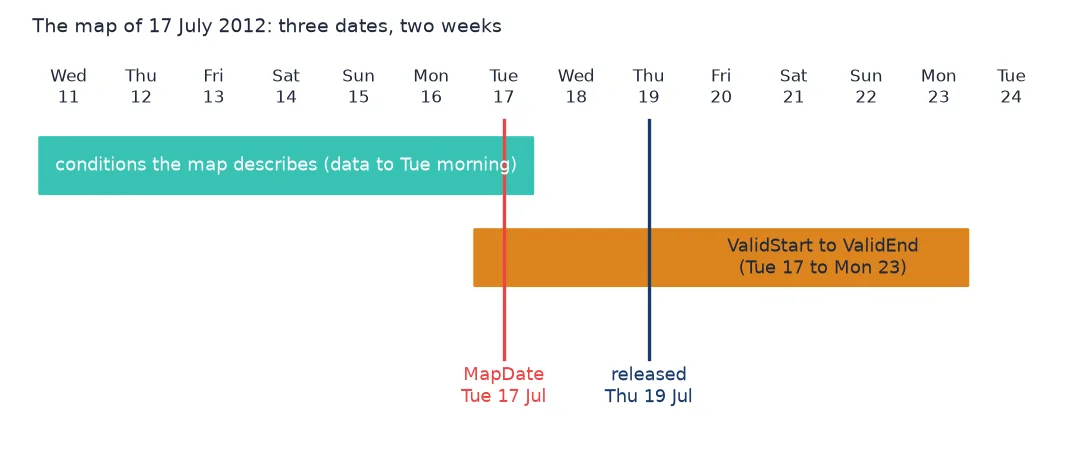
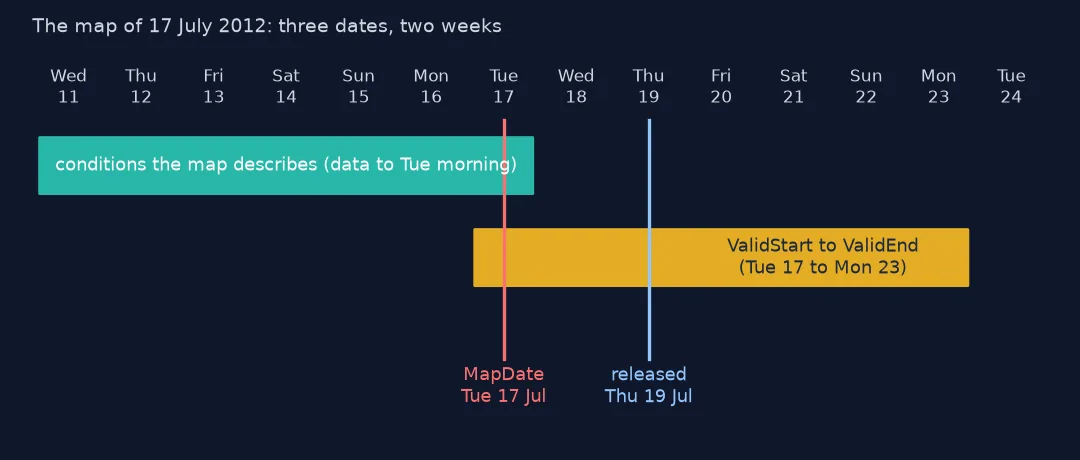
Every Drought Monitor record carries three dates: MapDate, ValidStart and ValidEnd. The map is released on Thursday, dated the Tuesday before, and the valid period runs from that Tuesday to the following Monday. Read literally, the valid period says the map describes the coming week — but the map is drawn from data up to the Tuesday morning, so it describes the week that has just ended. Joining daily data on the valid period puts each map a week late. This guide checks the three dates across 1,357 maps for Lancaster County, Nebraska, joins them to daily Platte River flow three ways, and shows which alignment matches.
Quick answer
Treat MapDate as the end of the week the map describes. To attach a map to daily data, use merge_asof(..., direction="forward") so each day gets the next map, which covers it; use direction="backward" with a two-day shift only when you need what was publicly known on that day.
print("weekday of MapDate:", usdm.MapDate.dt.day_name().value_counts().to_dict())
print("ValidStart - MapDate:", (usdm.ValidStart - usdm.MapDate).dt.days.value_counts().to_dict(),
      "| ValidEnd - MapDate:", (usdm.ValidEnd - usdm.MapDate).dt.days.value_counts().to_dict())
release = usdm.MapDate + pd.Timedelta(days=2)
print(f"each map is released on {release.dt.day_name().iloc[0]}, describing conditions as of the {usdm.MapDate.dt.day_name().iloc[0]} morning before")
weekday of MapDate: {'Tuesday': 1357}
ValidStart - MapDate: {0: 1357} | ValidEnd - MapDate: {6: 1357}
each map is released on Thursday, describing conditions as of the Tuesday morning before
All 1,357 map dates are Tuesdays; ValidStart equals MapDate in every row and ValidEnd is six days later. The release comes on the Thursday — two days after the map date.
Which week a map belongs to
1. Three dates for one map
w = usdm[usdm.MapDate == "2012-07-17"].iloc[0]
print(f"map date {w.MapDate:%a %d %b}, valid {w.ValidStart:%a %d %b} to {w.ValidEnd:%a %d %b}, released {w.MapDate + pd.Timedelta(days=2):%a %d %b}")
map date Tue 17 Jul, valid Tue 17 Jul to Mon 23 Jul, released Thu 19 Jul
The map of 17 July 2012 was released on Thursday 19 July and is labelled valid from Tuesday 17 to Monday 23 July. Its authors used observations up to the morning of 17 July. On 23 July, the last "valid" day, the map was already almost a week behind conditions — and that summer, conditions were moving a category every week or two.
2. Joining daily data: three ways
days = pd.DataFrame({"date": pd.date_range("2012-06-01", "2012-09-30")})
weeks = usdm[["MapDate", "D2"]].sort_values("MapDate")
a = pd.merge_asof(days, weeks.rename(columns={"MapDate": "date"}), on="date", direction="backward")      # map in force
b = pd.merge_asof(days, weeks.rename(columns={"MapDate": "date"}), on="date", direction="forward")       # next map
c = pd.merge_asof(days.assign(date=days.date - pd.Timedelta(days=2)), weeks.rename(columns={"MapDate": "date"}), on="date", direction="backward")
print(f"days where 'map in force' and 'next map' disagree on D2: {(a.D2 != b.D2).mean():.0%}; "
      f"in force against 'released by then': {(a.D2.values != c.D2.values).mean():.0%}")
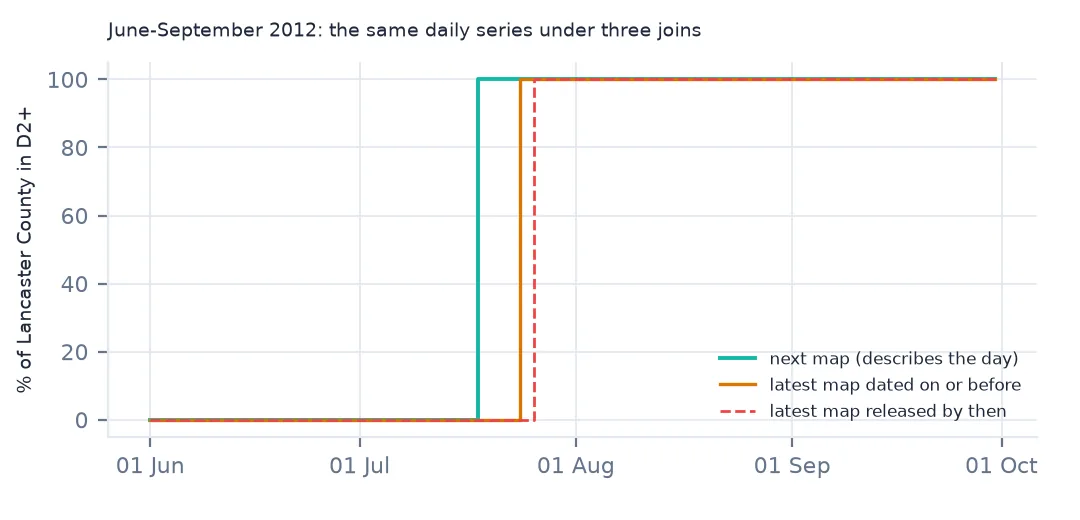
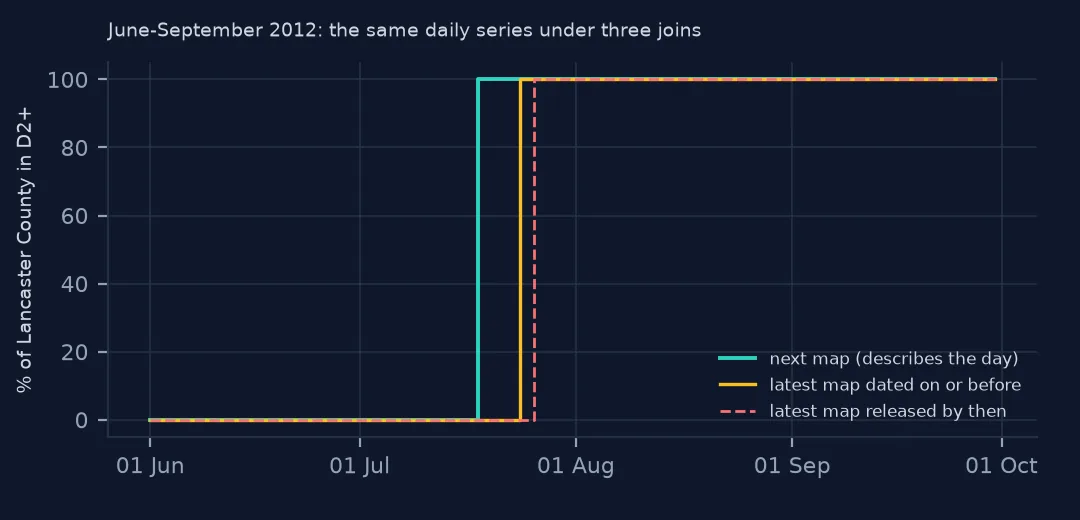
days where 'map in force' and 'next map' disagree on D2: 5%; in force against 'released by then': 2%
Over June to September 2012, joining each day to the latest map (backward) or the next map (forward) gives a different D2 share on 5% of days; the latest map against the latest released map differs on 2%. These look small because most weeks the share did not change, but they fall exactly on the weeks the drought was spreading.
3. What the offset does to a correlation
q = flow.loc["2000":"2025"].rename("cfs").rename_axis("date").reset_index()
for name, direction, shift in [("map in force", "backward", 0), ("next map", "forward", 0), ("released", "backward", 2)]:
    x = pd.merge_asof(q.assign(date=q.date - pd.Timedelta(days=shift)).sort_values("date"), weeks.rename(columns={"MapDate": "date"}),
                      on="date", direction=direction)
    print(f"{name:13s}: rank correlation of daily flow with % of county in D2+: {x.cfs.corr(x.D2, method='spearman'):+.3f}")
map in force : rank correlation of daily flow with % of county in D2+: -0.286
next map : rank correlation of daily flow with % of county in D2+: -0.309
released : rank correlation of daily flow with % of county in D2+: -0.278
Over 26 years of daily Platte River flow, the next map correlates with flow most strongly (−0.309), the latest map less (−0.286), and the latest released map least (−0.278). The ordering fits the reading above: the map dated next Tuesday describes the days before it, so it matches them best. The differences are small for a slow river, and larger for anything that responds in days, such as soil moisture or crop stress.
Gaps and monthly summaries
The data used on this page
The US Drought Monitor's weekly statistics for Lancaster County, Nebraska, 2000–2025, which carry the map date and valid period; and USGS daily streamflow for the Platte River at Louisville, Nebraska.
import io
from pathlib import Path
import numpy as np
import pandas as pd
import requests
Path("data").mkdir(exist_ok=True)
r = requests.get("https://usdmdataservices.unl.edu/api/CountyStatistics/GetDroughtSeverityStatisticsByAreaPercent",
params={"aoi": "31109", "startdate": "1/1/2000", "enddate": "12/31/2025", "statisticsType": 1}, timeout=300)
usdm = pd.read_csv(io.StringIO(r.text), dtype={"FIPS": str}) # Lancaster County, Nebraska
usdm["MapDate"] = pd.to_datetime(usdm.MapDate.astype(str), format="%Y%m%d")
usdm[["ValidStart", "ValidEnd"]] = usdm[["ValidStart", "ValidEnd"]].apply(pd.to_datetime)
# USGS NWIS daily mean discharge (cfs), Platte River at Louisville, NE; a frozen copy of
# https://waterservices.usgs.gov/nwis/dv/?format=rdb&sites=06805500¶meterCd=00060&startDT=1953-10-01&endDT=2025-12-31&statCd=00003
f = Path("data/usgs-06805500.rdb")
if not f.exists():
f.write_bytes(requests.get("https://data.spatialworkflow.io/usgs-nwis-06805500-daily-flow-2026-10-15.rdb", timeout=300).content)
raw_q = pd.read_csv(f, sep="\t", comment="#", dtype=str).iloc[1:] # second line holds field widths
raw_q = raw_q.rename(columns={"93576_00060_00003": "cfs", "93576_00060_00003_cd": "cd"})
raw_q["datetime"] = pd.to_datetime(raw_q.datetime)
flow = pd.to_numeric(raw_q.set_index("datetime").cfs, errors="coerce").dropna()
print(f"{len(usdm):,} weekly maps for {usdm.County.iloc[0]}; {len(flow):,} days of flow")1,357 weekly maps for Lancaster County; 26,390 days of flow
Example 1: no missing weeks
gaps = usdm.MapDate.sort_values().diff().dt.days.value_counts()
print("days between consecutive maps:", gaps.to_dict())
days between consecutive maps: {7.0: 1356}
Every one of the 1,356 intervals is seven days: no week is missing and none is doubled, even over holidays, when the release may move but the map date does not.
Example 2: monthly summaries from weekly maps
m_start = usdm.set_index("MapDate").D1.resample("MS").mean()
m_valid = usdm.set_index("ValidEnd").D1.resample("MS").mean()
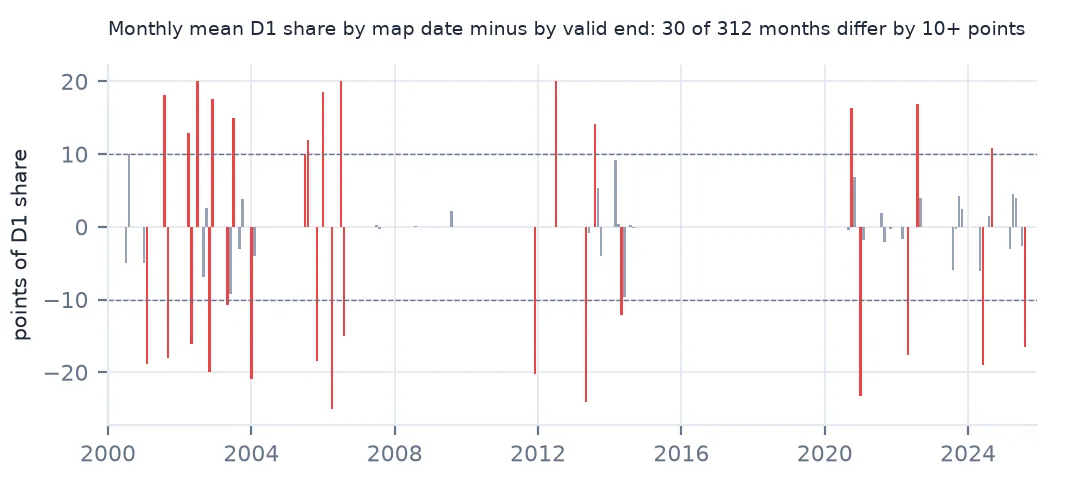
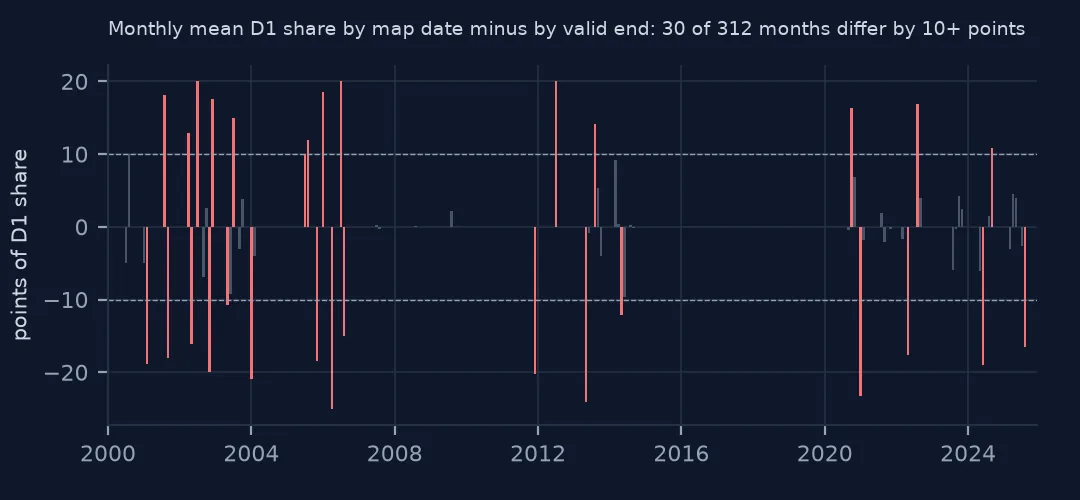
print(f"months where averaging by map date and by valid-end date differ by 10+ points: {((m_start - m_valid).abs() > 10).sum()} of {len(m_start)}")
months where averaging by map date and by valid-end date differ by 10+ points: 30 of 312
Averaging maps into months by MapDate or by ValidEnd moves the boundary by six days, and in 30 of 312 months the two monthly means of the D1 share differ by 10 points or more. For monthly statistics, assign each map to the month of its MapDate, the end of the week it describes.
Why the valid period points forward
The Drought Monitor's authors collect data up to Tuesday at 8 a.m. Eastern, draw the map on Tuesday and Wednesday, and release it on Thursday. The map is "valid" — the current official map — from its date until the next one replaces it, which is what ValidStart and ValidEnd record. That is a statement about when the map is in force, not about which days' conditions it shows. For an archive of maps the two meanings point a week apart.
Which join is right depends on the question. A study of drought and outcomes on the ground wants the map that describes each day, which is the next one. A study of decisions — a farmer, a water utility, a USDA programme reacting to the official status — wants the map that had been released by that day, which is the previous one, two days late. Using the valid period gives neither exactly.
Small things with dates
- MapDate is an integer. The service returns
20120717; parse withformat="%Y%m%d", or pandas reads it as a number of nanoseconds. merge_asofneeds sorted keys. Both sides must be sorted on the join column, and of the same dtype — a date against a datetime fails.- Time zones. The data cutoff is in US Eastern time; for daily data in UTC the boundary falls in the morning, which matters only for hourly work.
- Revisions. Published maps are not revised later; the archive is what was released at the time.
Internal links
- How to analyse US Drought Monitor county statistics — the weekly series
- How to relate drought to river flow — daily flow against weekly maps
- Bike-share trips with negative durations — another dataset where a timestamp means less than it seems
FAQ
What day of the week is the Drought Monitor map date?
Always Tuesday, the data cutoff. The map is released on the Thursday after.
Should I use ValidStart and ValidEnd to join daily data?
Not if you want the map that describes each day. The valid period starts at the data cutoff and runs forward, so it attaches each map to the week after the conditions it shows. Join each day to the next map date instead.