
How to Analyse US Drought Monitor County Statistics in Python
On this page
Problem statement
The US Drought Monitor publishes a map every week, and behind the map a table: for each of the 3,109 counties of the lower 48 states and DC, the share of its area in each drought category, from D0 (abnormally dry) to D4 (exceptional drought). Pulled for January 2000 to December 2025 that is 4,218,913 county-weeks, and the questions people bring to it are simple — which counties are most often in drought, which year was worst, how much of the country was dry in a given week. They go wrong on the first step, because the service's default columns are cumulative: D1 means "D1 or worse", not "exactly D1". This guide reads the table, turns each county-week into one severity number, and answers those questions for 2000–2025.
Quick answer
Download each state's county statistics from the Drought Monitor web service, concatenate them, and work on the D1 column directly: in the cumulative form it already is the share of the county in moderate drought or worse. Counting the weeks with at least half the county in D1+ ranks the counties.
usdm["year"] = usdm.MapDate.dt.year
usdm["in_d1"] = usdm.D1 >= 50                       # half the county or more in moderate drought or worse
share = usdm.groupby(["FIPS", "County", "State"]).in_d1.mean().sort_values()
print(f"median county: {share.median():.1%} of weeks with half its area in D1 or worse, 2000-2025")
print(share.tail(5).round(3).to_string())
print(share.head(3).round(3).to_string())
median county: 19.6% of weeks with half its area in D1 or worse, 2000-2025
FIPS County State
04021 Pinal County AZ 0.628
04003 Cochise County AZ 0.630
35023 Hidalgo County NM 0.637
04001 Apache County AZ 0.648
35031 McKinley County NM 0.648
FIPS County State
36007 Broome County NY 0.011
36077 Otsego County NY 0.011
36017 Chenango County NY 0.012
The median county spent 19.6% of the 26 years with at least half its area in D1 or worse. The driest counties are all in Arizona and New Mexico, near two thirds of all weeks (Apache and McKinley, 0.648); the wettest are in upstate New York, where Broome and Otsego counties crossed that line in about one week in a hundred.
From the weekly table to a county map
1. One row per county per week
print(usdm.columns.tolist())
print(usdm.MapDate.dt.day_name().value_counts().to_dict())
print(f"duplicates: {usdm.duplicated(['FIPS', 'MapDate']).sum()}; weeks per county: median {usdm.groupby('FIPS').size().median():.0f}")
['MapDate', 'FIPS', 'County', 'State', 'None', 'D0', 'D1', 'D2', 'D3', 'D4', 'ValidStart', 'ValidEnd', 'StatisticFormatID', 'year', 'in_d1']
{'Tuesday': 4218913}
duplicates: 0; weeks per county: median 1357
Every map is dated on a Tuesday, there are no duplicate county-weeks, and the median county has all 1,357 weekly maps. ValidStart and ValidEnd give the week each map stands for; Drought Monitor dates are a week off explains how to join them to daily data.
2. Cumulative columns, read correctly
row = usdm[(usdm.FIPS == "31109") & (usdm.MapDate == "2012-09-25")]
print(row[["County", "State", "None", "D0", "D1", "D2", "D3", "D4"]].to_string(index=False))
cat = usdm[["D0", "D1", "D2", "D3", "D4"]].sub(usdm[["D1", "D2", "D3", "D4"]].assign(D5=0).values)
print("same week as categories:", cat.loc[row.index].round(2).to_dict("records"))
County State None D0 D1 D2 D3 D4
Lancaster County NE 0.0 100.0 100.0 100.0 100.0 0.0
same week as categories: [{'D0': 0.0, 'D1': 0.0, 'D2': 0.0, 'D3': 100.0, 'D4': 0.0}]
On 25 September 2012 Lancaster County, Nebraska, shows 100 in D0, D1, D2 and D3: not four times the county, but the whole county in D3. Subtracting each column from the one before turns the cumulative form back into categories, and the same week becomes 100% in exactly D3. Summing the cumulative columns gives figures up to 500%; that mistake has its own page.
3. A single number per county-week
w = np.array([0, 1, 2, 3, 4, 5])
levels = pd.concat([usdm["None"], cat], axis=1).values / 100
usdm["dsci"] = 100 * (levels[:, 1:] * w[1:]).sum(axis=1)            # Drought Severity and Coverage Index, 0-500
print(usdm.dsci.describe(percentiles=[0.5, 0.9, 0.99]).round(0).to_string())
lan = usdm[usdm.FIPS == "31109"].set_index("MapDate").dsci
print("Lancaster County, Nebraska, yearly maximum:", lan.groupby(lan.index.year).max().loc[[2002, 2006, 2012, 2018, 2022, 2023]].round(0).to_dict())
count 4218913.0
mean 80.0
std 118.0
min 0.0
50% 0.0
90% 281.0
99% 473.0
max 500.0
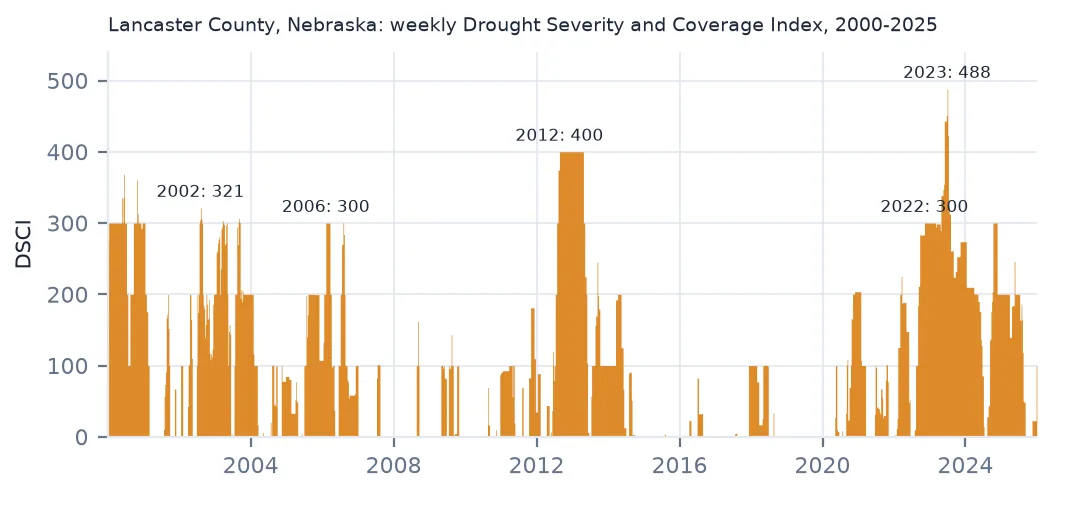
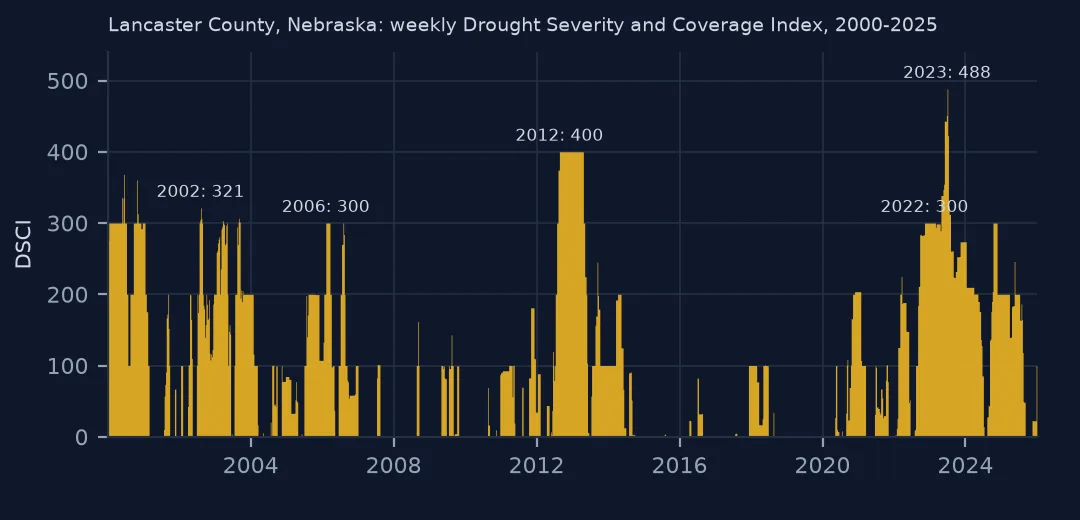
Lancaster County, Nebraska, yearly maximum: {2002: 321.0, 2006: 300.0, 2012: 400.0, 2018: 101.0, 2022: 300.0, 2023: 488.0}
The Drought Severity and Coverage Index (DSCI) weights each category's share by 1 for D0 up to 5 for D4, so a county wholly in D4 scores 500 and one with no drought scores 0. The median county-week scores 0 — most weeks, most counties are not dry — while the top tenth of weeks score 281 or more. Lancaster County's worst years show how the index separates them: 2012 peaked at 400 (all D3), 2023 at 488, almost the whole county in D4.
4. Map it
import geopandas as gpd

counties = gpd.read_file("data/cb_2023_us_county_20m.zip").to_crs(5070)
counties = counties[~counties.STATEFP.isin(["02", "15", "72"])]
dsci = usdm.groupby("FIPS").dsci.mean().rename("mean_dsci")
m = counties.merge(dsci, left_on="GEOID", right_index=True, how="left")
print(f"counties on the map: {len(m):,}; without Drought Monitor statistics: {m.mean_dsci.isna().sum()}")
print(m.groupby("STUSPS").mean_dsci.mean().sort_values().round(0).iloc[[0, 1, -2, -1]].to_string())
counties on the map: 3,109; without Drought Monitor statistics: 0
STUSPS
OH 27.0
NY 28.0
NV 183.0
AZ 187.0
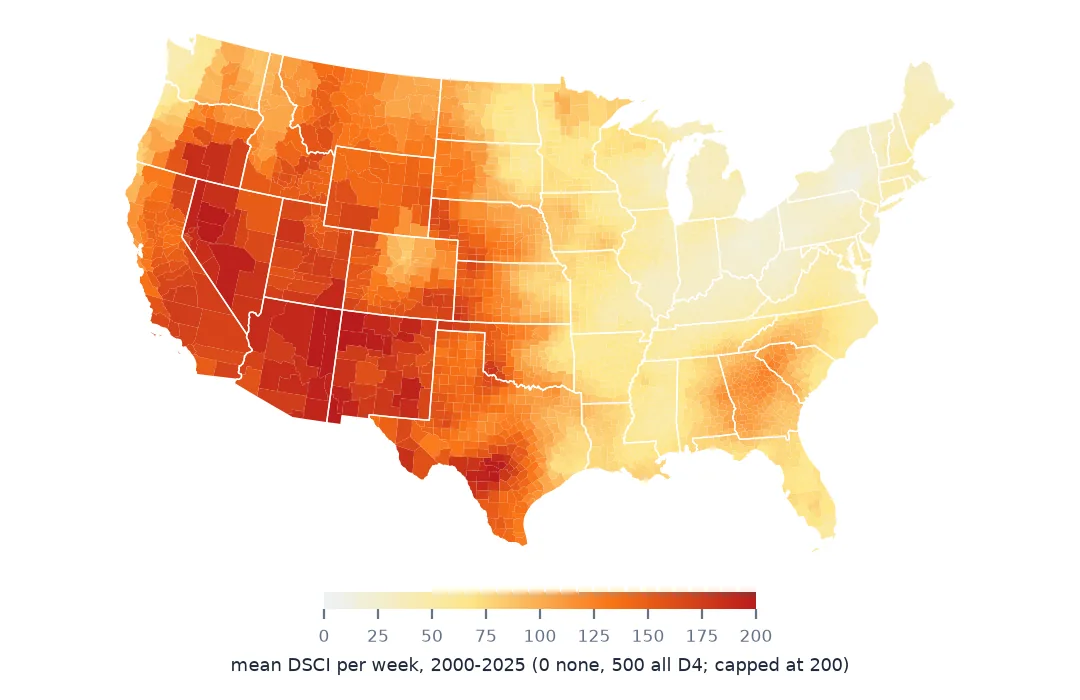
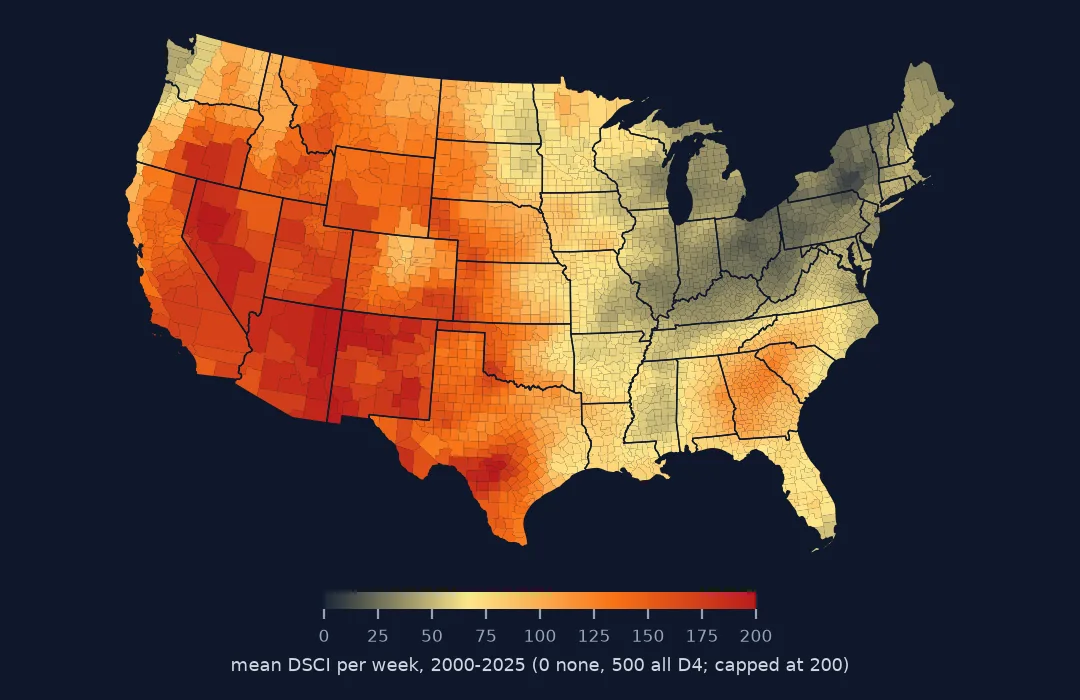
All 3,109 counties in the Census boundary file have Drought Monitor statistics, because both now use Connecticut's planning regions. Averaged over 26 years, Ohio and New York counties score 27 and 28; Nevada and Arizona 183 and 187.
Worst years and the weekly share of counties
The data used on this page
The US Drought Monitor's county statistics web service, weekly from January 2000 to December 2025, in its cumulative form (statistics type 1), produced by the National Drought Mitigation Center at the University of Nebraska–Lincoln with USDA and NOAA; and the Census Bureau's 2023 cartographic boundary counties.
from pathlib import Path

import numpy as np
import pandas as pd
import requests

Path("data").mkdir(exist_ok=True)
API = "https://usdmdataservices.unl.edu/api"
STATES = ["AL", "AZ", "AR", "CA", "CO", "CT", "DE", "DC", "FL", "GA", "ID", "IL", "IN", "IA", "KS", "KY", "LA", "ME", "MD",
          "MA", "MI", "MN", "MS", "MO", "MT", "NE", "NV", "NH", "NJ", "NM", "NY", "NC", "ND", "OH", "OK", "OR", "PA", "RI",
          "SC", "SD", "TN", "TX", "UT", "VT", "VA", "WA", "WV", "WI", "WY"]
for st in STATES:
    f = Path(f"data/usdm-county-{st}.csv")
    if not f.exists():
        # statisticsType 1 = cumulative percent of each county's area in each category or worse
        r = requests.get(f"{API}/CountyStatistics/GetDroughtSeverityStatisticsByAreaPercent",
                         params={"aoi": st, "startdate": "1/1/2000", "enddate": "12/31/2025", "statisticsType": 1}, timeout=600)
        f.write_text(r.text)
usdm = pd.concat([pd.read_csv(f"data/usdm-county-{st}.csv", dtype={"FIPS": str}) for st in STATES], ignore_index=True)
usdm["MapDate"] = pd.to_datetime(usdm.MapDate.astype(str), format="%Y%m%d")
for name, url in {"cb_2023_us_county_20m.zip": "https://www2.census.gov/geo/tiger/GENZ2023/shp/cb_2023_us_county_20m.zip"}.items():
    if not Path(f"data/{name}").exists():
        Path(f"data/{name}").write_bytes(requests.get(url, timeout=300).content)
print(f"{len(usdm):,} county-weeks, {usdm.FIPS.nunique():,} counties, {usdm.MapDate.nunique():,} weekly maps, "
      f"{usdm.MapDate.min():%Y-%m-%d} to {usdm.MapDate.max():%Y-%m-%d}")
4,218,913 county-weeks, 3,109 counties, 1,357 weekly maps, 2000-01-04 to 2025-12-30
Example 1: each state's worst year
st = usdm.groupby(["State", "year"]).dsci.mean().unstack()
worst = st.idxmax(axis=1)
print(worst.value_counts().head(6).to_string())
2002 13
2012 7
2021 6
2007 3
2000 3
2003 3
For 13 of the 49 areas (48 states and DC), 2002 was the worst year by mean county DSCI; 2012 was the worst for 7 and 2021 for 6. The 2012 drought was the most widespread single event, but 2002 was the worse year for more states because it hit the East as well as the Plains.
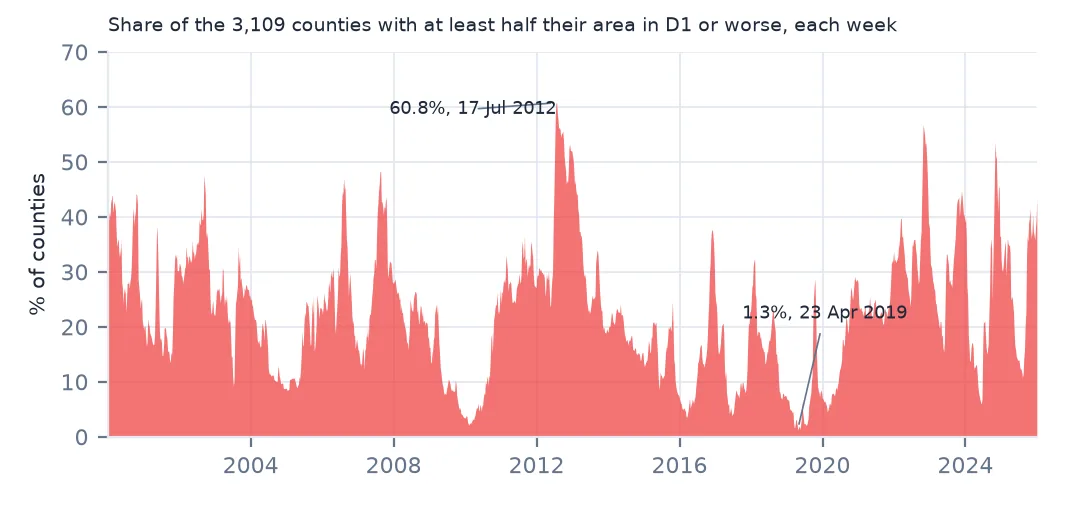
Example 2: the share of counties in drought each week
weekly = usdm.groupby("MapDate").in_d1.mean()
print(f"most counties in D1+: {weekly.max():.1%} on {weekly.idxmax():%d %B %Y}; fewest: {weekly.min():.1%} on {weekly.idxmin():%d %B %Y}")
print(weekly.groupby(weekly.index.year).mean().loc[[2002, 2006, 2011, 2012, 2019, 2022, 2025]].round(3).to_dict())
most counties in D1+: 60.8% on 17 July 2012; fewest: 1.3% on 23 April 2019
{2002: 0.329, 2006: 0.28, 2011: 0.292, 2012: 0.415, 2019: 0.072, 2022: 0.362, 2025: 0.274}
The peak came on 17 July 2012, with 60.8% of counties at least half in D1+; the low on 23 April 2019, at 1.3%. As yearly averages, 2012 (0.415) stands out, with 2022 next (0.362).
Why counties and why cumulative
The Drought Monitor is a weekly expert judgement drawn as polygons on a map, combining precipitation indices, soil moisture, streamflow, vegetation and reports from the ground. The county table is that map intersected with county boundaries, so each row says how much of the county's area the authors placed in each category. Counties are useful because they join to everything else — population, crop insurance claims, disaster declarations — and they have stayed the same over the whole record except for Connecticut.
The cumulative form exists because "D1 or worse" is what most users ask for: the share of a county in moderate drought or worse is a single column. It is also why naive row sums exceed 100. The DSCI collapses the six shares into one number that rises with both how much of the county is dry and how badly, which is what makes counties and years comparable.
Things that trip people up
- The service caps each request. Asking for every county for 26 years at once times out; one state at a time works, and saving each response means a re-run reads files instead of the API.
- FIPS codes are strings. Read them with
dtype={"FIPS": str}or Alabama's01001becomes1001and stops matching the boundary file. - A map is a judgement, not a measurement. Category edges are drawn by hand from several indicators, so a change of one category in one week can reflect a new author's reading as much as new rain. Look at runs of weeks, not single ones.
- Alaska, Hawaii and Puerto Rico are in the service but not in this page's state list; add them to
STATESif needed, and use a different projection for the map.
Internal links
- Drought percentages that add up to more than 100% — cumulative against categorical statistics
- Drought indices explained — what the D categories stand for
- How to animate the US Drought Monitor — the weekly polygons behind these statistics
- How to detect flash droughts — fast change in the same county series
FAQ
Is the D1 column the share in moderate drought only?
Not in the default (cumulative) statistics: it is the share in D1, D2, D3 or D4. Request statisticsType=2 for exact categories, or subtract the next column, as in step 2.
Which counties are most often in drought?
Over 2000–2025, by weeks with half the county or more in D1+, McKinley County, New Mexico, and Apache County, Arizona, each at 0.648 of all weeks.