
How to Identify Drought Events, Their Duration and Severity, from an Index
On this page
Problem statement
A monthly drought index answers "how dry is it now?", but most questions are about droughts as events: when did the last one start, how long did it last, how bad was it in total, and how often does one that long come round. Turning a series into events needs a rule, and the standard one is run theory — a drought is an unbroken run of months below a threshold; its duration is the run's length, its severity the sum of the index below zero over the run, its intensity severity divided by duration. This guide applies it to Lincoln, Nebraska's 3-month SPI and shows how much the answers depend on the threshold and on whether short wet breaks end a drought.
Quick answer
Mark the months below the threshold, label consecutive runs with (dry != dry.shift()).cumsum(), and aggregate each run's length, sum and minimum with groupby.
s = spi(monthly_precip("USW00014939"), 3).dropna()
dry = s < -1.0
run = (dry != dry.shift()).cumsum()
ev = s[dry].groupby(run[dry]).agg(start=lambda x: x.index[0], end=lambda x: x.index[-1], months="size",
                                   severity=lambda x: -x.sum(), peak=lambda x: -x.min())
ev = ev.reset_index(drop=True)
print(f"{len(ev)} events with SPI-3 below -1 since {s.index[0]:%Y}; median duration {ev.months.median():.0f} months")
print(ev.sort_values("severity", ascending=False).head(5).assign(start=lambda d: d.start.dt.strftime("%Y-%m"),
      end=lambda d: d.end.dt.strftime("%Y-%m")).round(2).to_string(index=False))
67 events with SPI-3 below -1 since 1948; median duration 1 months
start end months severity peak
1976-10 1977-02 5 12.62 4.57
1993-12 1994-06 7 12.38 2.48
2022-08 2022-12 5 10.89 2.93
1989-04 1989-07 4 10.73 3.83
1953-05 1953-10 6 10.14 2.48
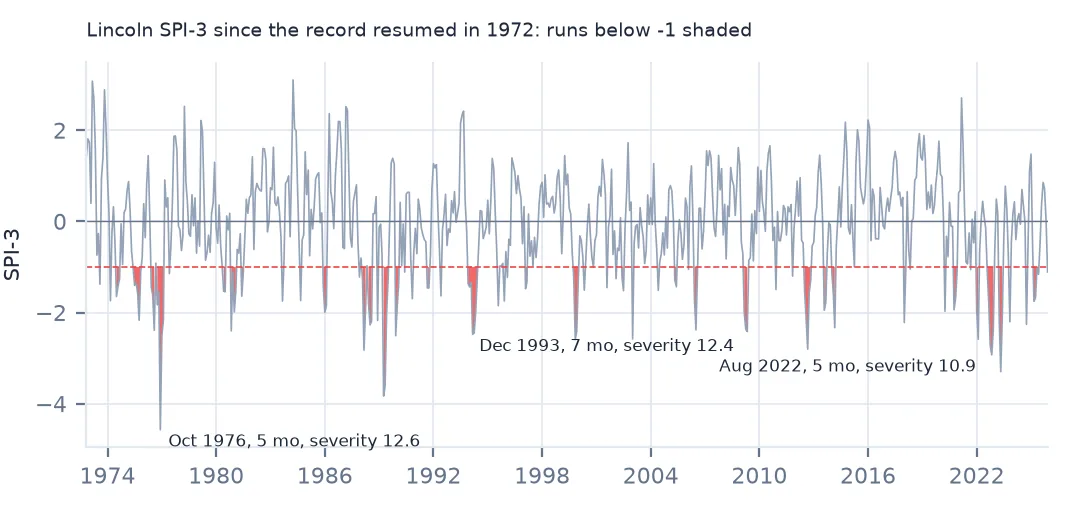
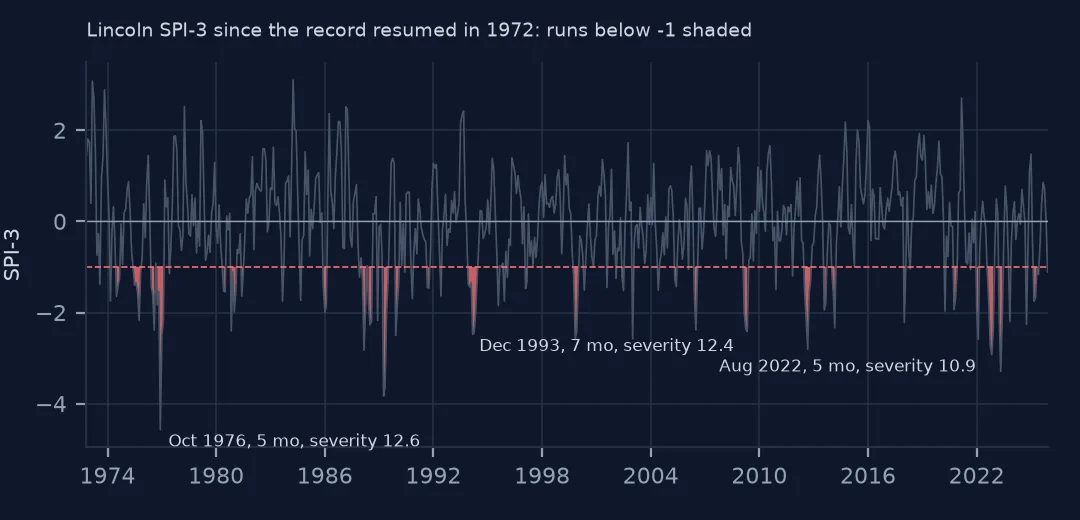
With SPI-3 below −1, Lincoln has 67 events since 1948 and the median one lasts a single month. The most severe by accumulated deficit ran from October 1976 to February 1977 (severity 12.62), with December 1993 to June 1994 close behind; the autumn of 2022 is third.
Runs, pooling and the three measures
1. Runs below a threshold
print(ev.months.value_counts().sort_index().to_dict()){1: 35, 2: 10, 3: 12, 4: 4, 5: 3, 6: 2, 7: 1}
Most runs are short: 35 of the 67 last one month, and only 6 last five months or more. One-month runs at SPI-3 are largely noise — a single dry month inside a three-month window.
2. Pool events separated by a single wet month
mon = lambda t: t.dt.year * 12 + t.dt.month
gap = mon(ev.start) - mon(ev.end).shift()                      # 2 = one wet month between two dry runs
grp = (gap > 2).cumsum()
pooled = ev.groupby(grp).agg(start=("start", "first"), end=("end", "last"), months=("months", "sum"), severity=("severity", "sum"))
print(f"{len(ev)} runs become {len(pooled)} events when a gap of one month is bridged; longest {pooled.months.max()} dry months")
67 runs become 61 events when a gap of one month is bridged; longest 8 dry months
Bridging single wet months merges 67 runs into 61 events, and the longest becomes 8 dry months. Pooling matters because one rainy month in the middle of a long drought rarely ends it on the ground; whether to pool, and over how long a gap, is a choice to state with the results.
3. Duration, severity and intensity
ev["intensity"] = ev.severity / ev.months
print(ev[["months", "severity", "intensity", "peak"]].corr(method="spearman").round(2).to_string())
months severity intensity peak
months 1.00 0.92 0.41 0.68
severity 0.92 1.00 0.72 0.89
intensity 0.41 0.72 1.00 0.92
peak 0.68 0.89 0.92 1.00
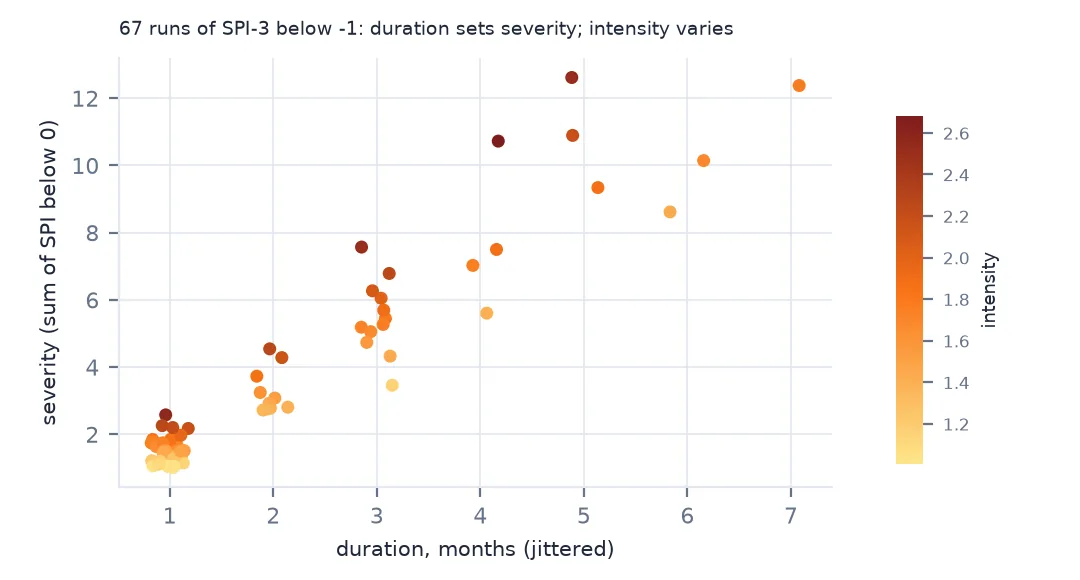
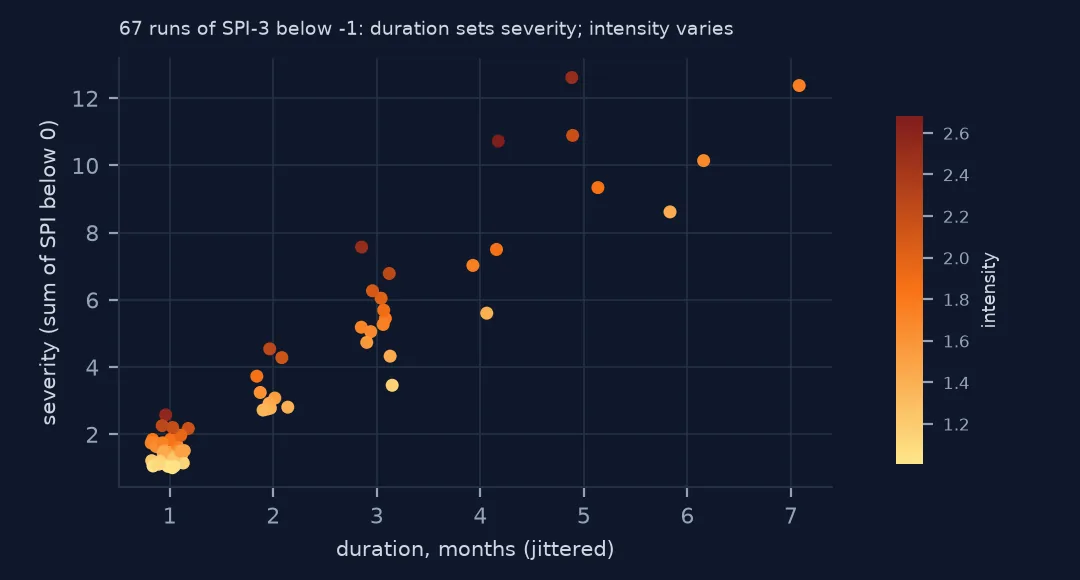
Duration and severity rank almost identically (0.92): a long event accumulates deficit whatever its depth. Intensity is a different measure — it correlates 0.41 with duration and 0.92 with the peak — so a short, sharp event and a long, mild one can have the same severity and very different intensity.
4. The threshold decides how many droughts there were
for t in [-0.5, -0.8, -1.0, -1.3, -1.6]:
    d = s < t
    r = (d != d.shift()).cumsum()
    n = s[d].groupby(r[d]).size()
    print(f"threshold {t:+.1f}: {len(n):3d} events, {d.mean():.1%} of months in drought, longest {n.max()} months")
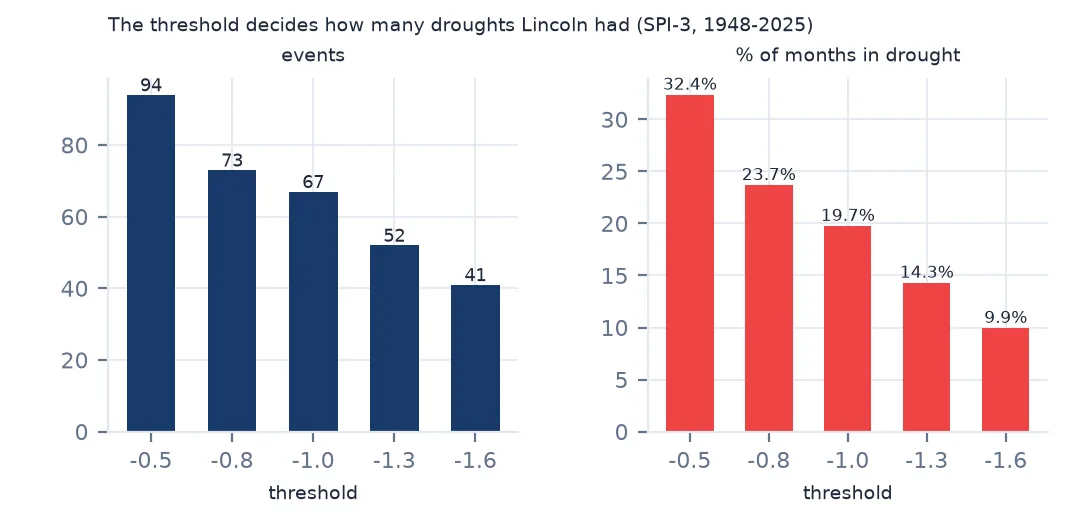
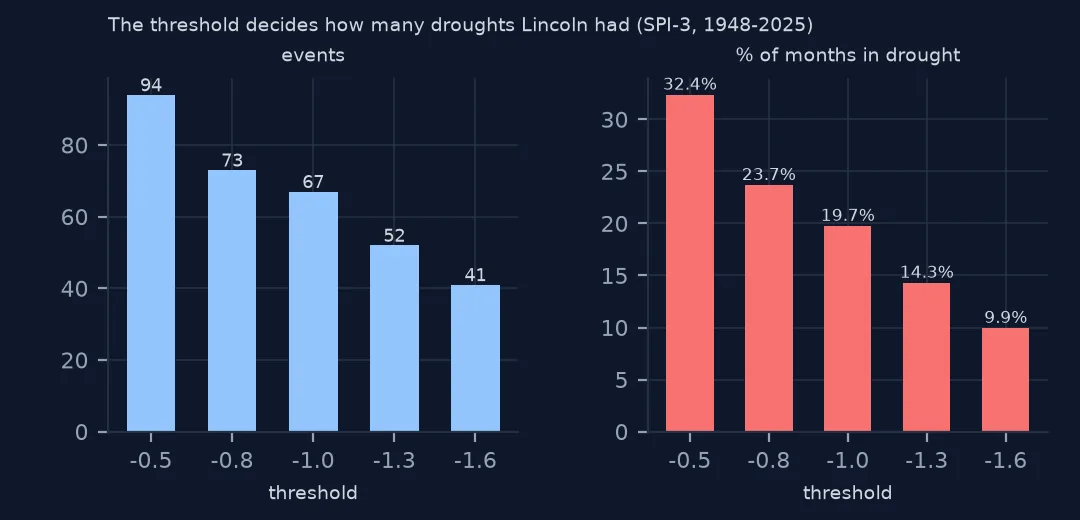
threshold -0.5: 94 events, 32.4% of months in drought, longest 9 months
threshold -0.8: 73 events, 23.7% of months in drought, longest 9 months
threshold -1.0: 67 events, 19.7% of months in drought, longest 7 months
threshold -1.3: 52 events, 14.3% of months in drought, longest 6 months
threshold -1.6: 41 events, 9.9% of months in drought, longest 4 months
The threshold is the biggest choice. At −0.5, 32.4% of months are in drought and there are 94 events; at −1.6, 9.9% and 41 events. The longest event shrinks from 9 months to 4. A drought climatology says as much about its threshold as about the climate.
Decades and return periods
The data used on this page
NOAA NCEI GHCN-Daily precipitation for Lincoln Municipal Airport, Nebraska (USW00014939), turned into a 3-month SPI with a 1991–2020 gamma fit as in how to calculate the SPI.
from pathlib import Path

import numpy as np
import pandas as pd
import requests
from scipy import stats

Path("data").mkdir(exist_ok=True)
GHCN = "https://www.ncei.noaa.gov/data/global-historical-climatology-network-daily/access/{}.csv"
STATIONS = ["USW00014939"]                                                      # Lincoln, Nebraska
for sid in STATIONS:
    f = Path(f"data/{sid}.csv")
    if not f.exists():
        # the per-station files grow daily; this page uses complete months up to December 2025
        f.write_bytes(requests.get(GHCN.format(sid), timeout=300).content)


def monthly_precip(sid, min_days=25):
    d = pd.read_csv(f"data/{sid}.csv", usecols=["DATE", "PRCP", "PRCP_ATTRIBUTES"], parse_dates=["DATE"], low_memory=False)
    d = d[(d.DATE < "2026-01-01")]
    ok = d.PRCP_ATTRIBUTES.fillna(",,,").str.split(",").str[1] == ""            # drop quality-flagged values
    d = d.assign(mm=d.PRCP.where(ok) / 10).set_index("DATE")
    m = d.mm.resample("MS").agg(["sum", "count"])
    return m["sum"].where(m["count"] >= min_days)                                # a month needs 25 days of data


def spi(precip, scale, ref=("1991", "2020")):
    """Standardized Precipitation Index: gamma fit per calendar month on the reference period, with a point mass at zero."""
    acc = precip.rolling(scale).sum()
    out = pd.Series(np.nan, index=acc.index)
    for m in range(1, 13):
        sel = acc[acc.index.month == m]
        ref_vals = sel.loc[ref[0]:ref[1]].dropna()
        q = (ref_vals == 0).mean()
        a, _, b = stats.gamma.fit(ref_vals[ref_vals > 0], floc=0)
        out[sel.index] = stats.norm.ppf(q + (1 - q) * stats.gamma.cdf(sel, a, loc=0, scale=b))
    return out


for sid in STATIONS:
    m = monthly_precip(sid)
    print(f"{sid}: {m.notna().sum()} complete months, {m.first_valid_index():%Y-%m} to {m.last_valid_index():%Y-%m}")
USW00014939: 718 complete months, 1948-01 to 2025-12
Example 1: events by decade
dec = (ev.start.dt.year // 10 * 10)
print(ev.groupby(dec).agg(events=("months", "size"), dry_months=("months", "sum"), severity=("severity", "sum")).round(1).to_string())
events dry_months severity
start
1940 2 2 2.3
1950 8 16 25.0
1970 7 20 35.3
1980 12 28 53.8
1990 10 21 34.9
2000 11 17 27.8
2010 7 15 25.1
2020 10 22 41.9
There is no 1960s row: the station recorded no precipitation from July 1954 to August 1972, and the 1950s and 1970s rows cover only part of their decades. Of the complete decades, the 1980s had the most events (12) and the most dry months (28); the 2020s already have 10 events and severity 41.9 in six years.
Example 2: how often an event this long happens
for d in [3, 6, 9]:
    n = (pooled.months >= d).sum()
    yrs = len(s) / 12                                             # years with data, not calendar span
    print(f"pooled events of {d}+ months: {n}, about one every {yrs / n:.0f} years" if n else f"no pooled event of {d}+ months")
pooled events of 3+ months: 20, about one every 3 years
pooled events of 6+ months: 5, about one every 12 years
no pooled event of 9+ months
Pooled events of three months or more come about once every 3 years of record, six months or more about once every 12 years, and none reached nine. The years are counted from months with data, not the calendar span, or the 18-year gap would make long droughts look rarer.
Run theory and its limits
Run theory goes back to Yevjevich's work in the 1960s on streamflow deficits, and it is popular because it turns any index into events with three numbers each. It inherits everything about the index: SPI-3 events are precipitation-deficit events at a three-month scale, not agricultural or hydrological droughts. The most severe SPI-3 events in Lincoln happen in winter (October 1976 to February 1977, December 1993 to June 1994), when normal totals are small and a dry season produces extreme SPI values that matter little to crops or rivers. Severity measured on a standardised index rewards rarity, not impact.
For impacts, run the same code on an index at the scale that matters — SPI-6 or SPI-12 for streams, soil moisture percentiles for crops — or weight events by season. The run-labelling idiom itself is general: it is the same cumsum of changes that finds runs of hot days, of gauge readings below a level, or of weeks in a Drought Monitor category.
Traps in event statistics
- Gaps in the record.
dropna()closes the gap in the index, and a run on each side could be labelled as one event. Check that no event spans a gap, or split the series at gaps before labelling. - Events cut by the record's ends. An event running at the start or end of the series is shorter than it really was; flag it rather than counting its duration.
- Overlapping windows. Consecutive SPI-3 values share two months of rainfall, so neighbouring months are not independent — one dry month can create a three-month run on its own.
- Severity units. Severity is a sum of standard deviations; it is comparable between events of the same index and scale, not between SPI-3 and SPI-12.
Internal links
- How to calculate the SPI in Python — the index the events come from
- How to detect flash droughts — events defined by how fast they start
- Drought indices explained — thresholds and categories
FAQ
What threshold should I use?
−1 is common in the literature for SPI-based events; the Drought Monitor's D1 edge is −0.8. Run the analysis at several thresholds, as in step 4, and report how the result moves.
Should two dry runs separated by one wet month be one drought?
Usually, for impact work. Pooling Lincoln's runs across single wet months turned 67 runs into 61 events.