
How to Detect Flash Droughts in Drought Monitor Data
On this page
Problem statement
Most droughts build over seasons. A flash drought builds in weeks: heat, wind and a missed rain dry the soil fast enough to damage crops before the usual long-term indices notice. The summer of 2012 in the central US is the textbook case. There is no single official definition, but a widely used one in Drought Monitor data is a worsening of two or more categories within four weeks, ending in D1 or worse. This guide applies it to every county-week from 2000 to 2025 — 4,218,913 of them — to find when and where flash droughts start, and shows how much the count depends on the window and the jump.
Quick answer
Reduce each county-week to one category, sort by county and date, compare with the value four weeks earlier using groupby("FIPS").shift(4), and keep the weeks that worsened by two or more categories into D1+. Keeping the first such week per county and year counts onsets rather than every week of a fast decline.
cat = (usdm[["D0", "D1", "D2", "D3", "D4"]] >= 50).sum(axis=1) - 1       # worst category on half the county; -1 none
usdm["cat"] = cat
usdm = usdm.sort_values(["FIPS", "MapDate"])
usdm["cat_4wk_ago"] = usdm.groupby("FIPS").cat.shift(4)
flash = usdm[(usdm.cat - usdm.cat_4wk_ago >= 2) & (usdm.cat >= 1)]
first = flash.sort_values("MapDate").groupby(["FIPS", flash.MapDate.dt.year]).head(1)
print(f"county flash-drought onsets (2+ categories in 4 weeks, into D1 or worse): {len(first):,}")
print(first.groupby(first.MapDate.dt.year).size().sort_values(ascending=False).head(6).to_string())
county flash-drought onsets (2+ categories in 4 weeks, into D1 or worse): 30,247
MapDate
2024 2104
2012 1932
2023 1811
2022 1739
2001 1563
2025 1556
There were 30,247 county onsets in 26 years. 2024 had the most (2,104), ahead of 2012 (1,932); 2022, 2023 and 2025 are also in the top six. Counted this way, a year with a fast autumn drought across many small eastern counties can outnumber the larger, deeper 2012 drought of the Plains.
From weekly categories to onsets
1. A category per county-week
print((cat.value_counts(normalize=True).sort_index() * 100).round(1).rename(lambda k: "none" if k < 0 else f"D{k}").to_dict()){'none': 60.1, 'D0': 17.4, 'D1': 11.1, 'D2': 6.8, 'D3': 3.5, 'D4': 1.2}
A county-week's category here is the worst one covering at least half the county. In 60.1% of county-weeks that is no drought at all; D4 covers half a county in 1.2%.
2. Rate of change over a window
chg = (usdm.cat - usdm.cat_4wk_ago).dropna()
print("change in category over 4 weeks:", chg.value_counts().sort_index().to_dict())
change in category over 4 weeks: {-5.0: 65, -4.0: 1216, -3.0: 11309, -2.0: 85700, -1.0: 459459, 0.0: 3067686, 1.0: 498032, 2.0: 77661, 3.0: 5192, 4.0: 157}
Over four weeks most counties do not change (3,067,686 county-weeks); a worsening of one category is common (498,032), of two rarer (77,661), and of three or four very rare. Improvements of two or more categories are about as frequent as worsenings — a wet month ends drought fast too.
3. When flash droughts start
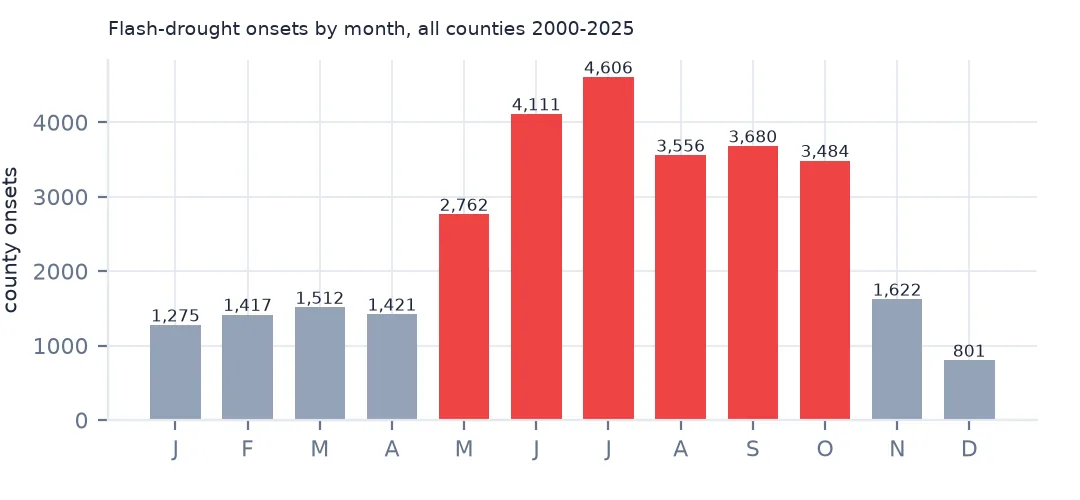
print(first.MapDate.dt.month.value_counts().sort_index().to_dict()){1: 1275, 2: 1417, 3: 1512, 4: 1421, 5: 2762, 6: 4111, 7: 4606, 8: 3556, 9: 3680, 10: 3484, 11: 1622, 12: 801}
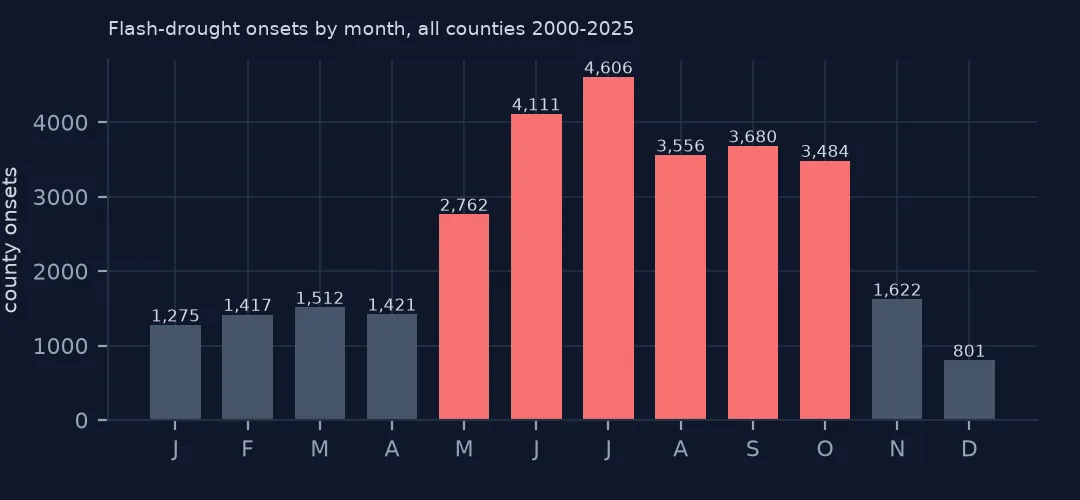
Onsets peak in June and July (4,111 and 4,606), when evaporation is highest and a missed rain does the most damage, and stay high through October. December has the fewest (801). Flash drought is a warm-season phenomenon, and the definition reflects that only through the data.
4. Where
by = first.groupby("State").size().sort_values(ascending=False)
print(by.head(8).to_string())
State
TX 3942
GA 1803
KY 1388
VA 1365
MO 1327
OK 1208
NC 1085
TN 1063
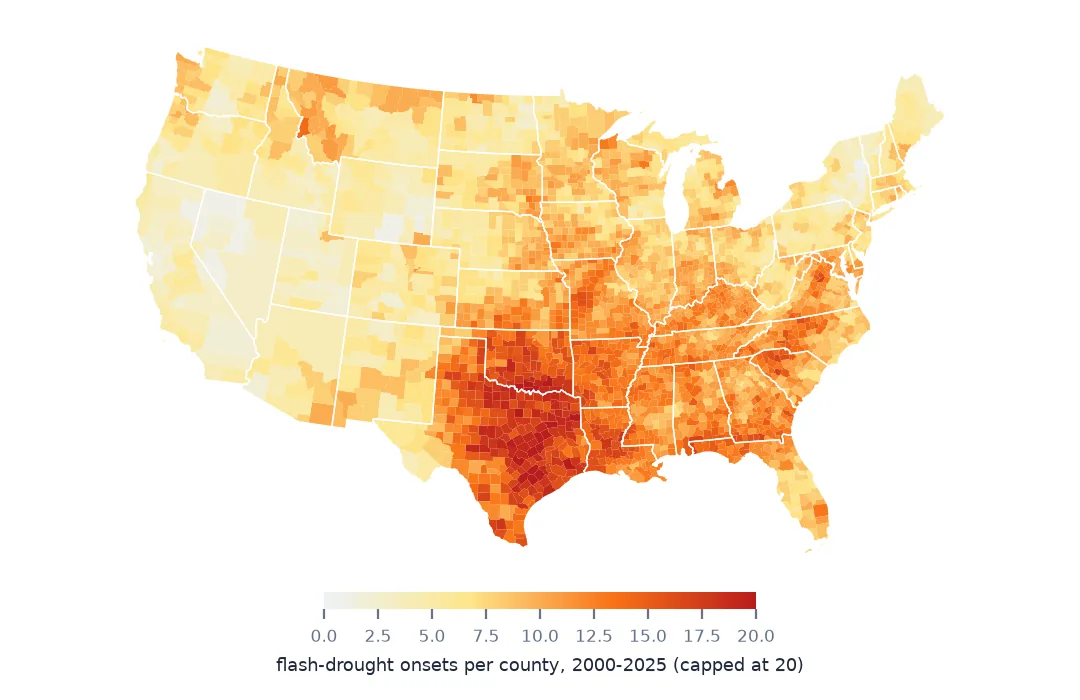
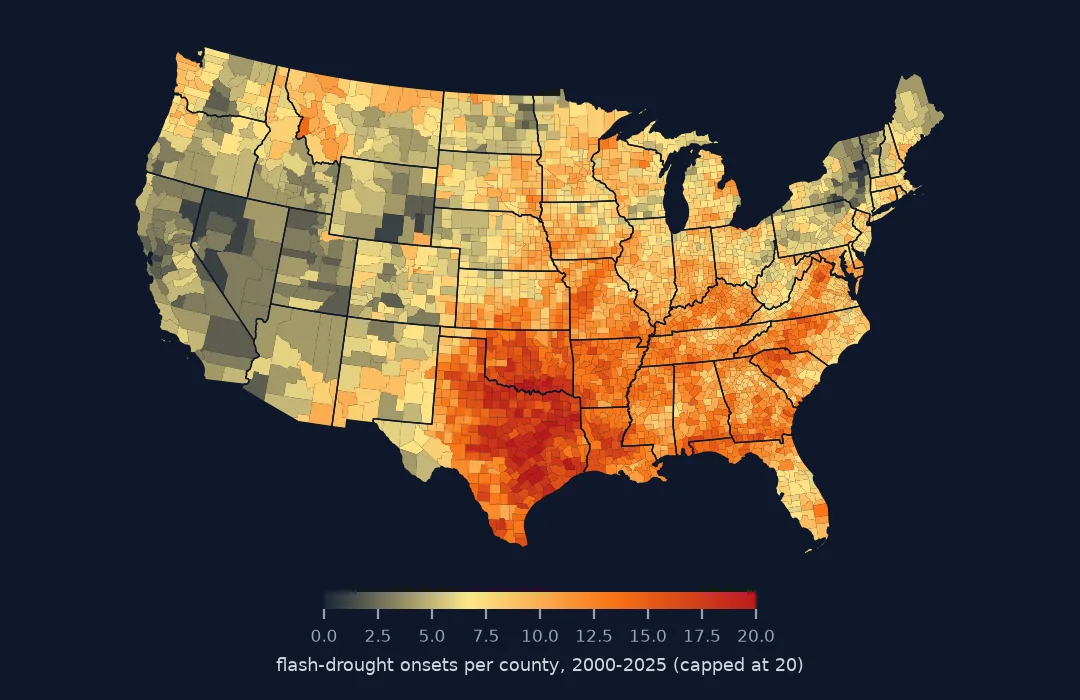
Texas has the most onsets (3,942), but it also has the most counties; Georgia, Kentucky and Virginia follow, all states with many small counties in a humid climate where soils can dry quickly in summer heat. Divide by the number of counties before comparing states.
The 2012 onset and the definition's settings
The data used on this page
The US Drought Monitor's county statistics web service, weekly from 2000 to 2025, cumulative form (statistics type 1); the Census Bureau's 2023 cartographic boundary counties for the map.
from pathlib import Path

import numpy as np
import pandas as pd
import requests

Path("data").mkdir(exist_ok=True)
API = "https://usdmdataservices.unl.edu/api"
STATES = ["AL", "AZ", "AR", "CA", "CO", "CT", "DE", "DC", "FL", "GA", "ID", "IL", "IN", "IA", "KS", "KY", "LA", "ME", "MD",
          "MA", "MI", "MN", "MS", "MO", "MT", "NE", "NV", "NH", "NJ", "NM", "NY", "NC", "ND", "OH", "OK", "OR", "PA", "RI",
          "SC", "SD", "TN", "TX", "UT", "VT", "VA", "WA", "WV", "WI", "WY"]
for st in STATES:
    f = Path(f"data/usdm-county-{st}.csv")
    if not f.exists():
        # statisticsType 1 = cumulative percent of each county's area in each category or worse
        r = requests.get(f"{API}/CountyStatistics/GetDroughtSeverityStatisticsByAreaPercent",
                         params={"aoi": st, "startdate": "1/1/2000", "enddate": "12/31/2025", "statisticsType": 1}, timeout=600)
        f.write_text(r.text)
usdm = pd.concat([pd.read_csv(f"data/usdm-county-{st}.csv", dtype={"FIPS": str}) for st in STATES], ignore_index=True)
usdm["MapDate"] = pd.to_datetime(usdm.MapDate.astype(str), format="%Y%m%d")
for name, url in {"cb_2023_us_county_20m.zip": "https://www2.census.gov/geo/tiger/GENZ2023/shp/cb_2023_us_county_20m.zip"}.items():
    if not Path(f"data/{name}").exists():
        Path(f"data/{name}").write_bytes(requests.get(url, timeout=300).content)
print(f"{len(usdm):,} county-weeks, {usdm.FIPS.nunique():,} counties, {usdm.MapDate.nunique():,} weekly maps, "
      f"{usdm.MapDate.min():%Y-%m-%d} to {usdm.MapDate.max():%Y-%m-%d}")
4,218,913 county-weeks, 3,109 counties, 1,357 weekly maps, 2000-01-04 to 2025-12-30
Example 1: 2012 week by week
y12 = first[first.MapDate.dt.year == 2012]
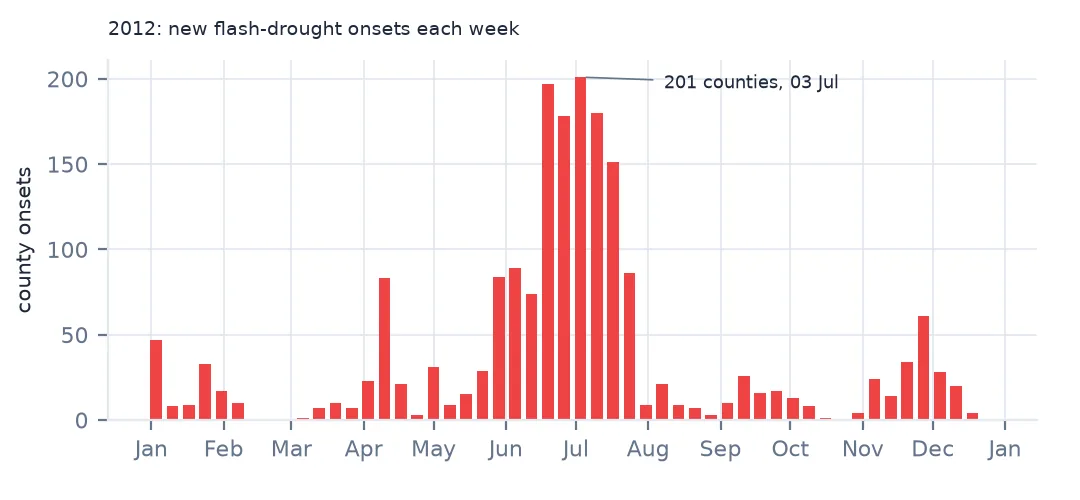
print(y12.groupby(y12.MapDate.dt.strftime("%m-%d")).size().loc["05-01":"09-30"].to_string())
MapDate
05-01 31
05-08 9
05-15 15
05-22 29
05-29 84
06-05 89
06-12 74
06-19 197
06-26 178
07-03 201
07-10 180
07-17 151
07-24 86
07-31 9
08-07 21
08-14 9
08-21 7
08-28 3
09-04 10
09-11 26
09-18 16
09-25 17
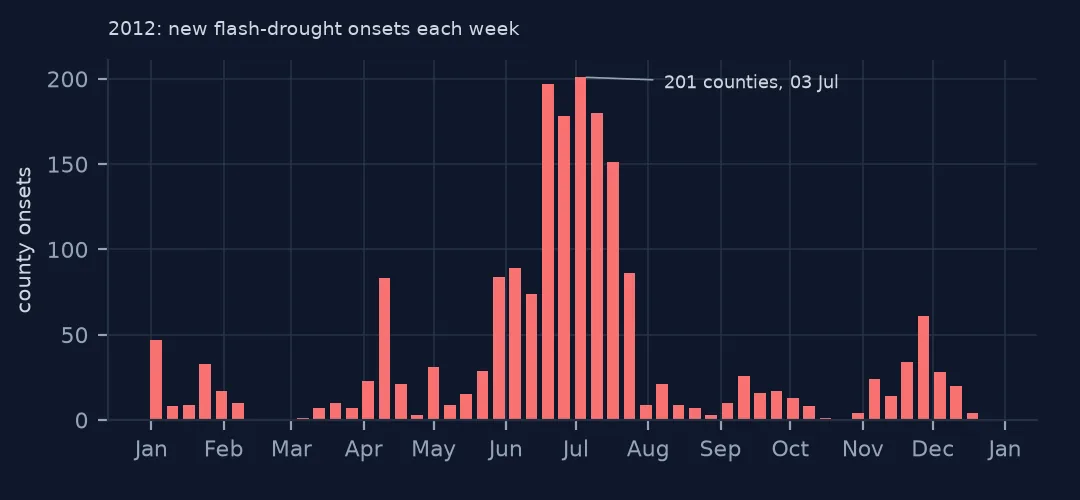
In 2012 the onsets came in a wave: 89 or fewer a week until mid-June, then 197 on 19 June, 201 on 3 July and 151 on 17 July, before dropping to 9 on 31 July — by then most of the affected counties were already in drought and could not have a new onset that year.
Example 2: the window and the jump
for k, jump in [(2, 2), (4, 2), (4, 3), (8, 2)]:
    prev = usdm.groupby("FIPS").cat.shift(k)
    n = ((usdm.cat - prev >= jump) & (usdm.cat >= 1)).sum()
    print(f"{jump}+ categories within {k} weeks: {n:,} county-weeks")
2+ categories within 2 weeks: 19,453 county-weeks
2+ categories within 4 weeks: 83,010 county-weeks
3+ categories within 4 weeks: 5,349 county-weeks
2+ categories within 8 weeks: 207,105 county-weeks
The definition's two numbers move the count by an order of magnitude. Two categories in two weeks finds 19,453 county-weeks; the same jump over eight weeks, 207,105; three categories in four weeks, 5,349. These count county-weeks meeting the test, not onsets, but the point holds: report the window and the jump with any count.
Why the definition is about speed
The Drought Monitor's categories are defined by how rare conditions are, not how fast they arrived, so a county that reaches D2 over six months and one that reaches it in three weeks look the same on a single map. Flash drought definitions add the rate: the change over a window. Research definitions more often use soil moisture or evaporative stress, such as a fall from above the 40th to below the 20th percentile of soil moisture within a few weeks; the Drought Monitor version is popular because the data are official, weekly and county-level.
Its weaknesses come from the same source. The categories are integers drawn by hand, so a two-category change is coarse, and the authors may hold back a change for a week while evidence accumulates. A county starting in D0 needs only to reach D2 in four weeks, while one already in D1 must reach D3, so "flash" is easier to meet from near-normal conditions. Results are best read as a count of rapid intensifications on the official map, not as a physical measurement.
Checks worth making
- Sort before shifting.
shift(4)withingroupby("FIPS")is four rows back, which is four weeks only if each county's rows are in date order with no gaps. - Onset or week. Counting every week that meets the test overweights long fast declines; decide whether you count onsets (first week per county and year, as here) or weeks.
- County size. Counts by state follow the number of counties. Weight by area or population for a fairer comparison.
- The worst-category rule. Using "half the county" picks one category per county-week; a share-weighted index such as the DSCI changes which weeks qualify.
Internal links
- How to analyse US Drought Monitor county statistics — the weekly county series
- How to identify drought events from an index — events by duration rather than speed
- How to animate the US Drought Monitor — the 2024 flash drought on a map
FAQ
Which year had the most flash droughts?
By county onsets of two categories in four weeks, 2024 (2,104), then 2012 (1,932).
When in the year do flash droughts start?
Mostly from May to October, peaking in July (4,606 onsets in 26 years).