
Drought Percentages That Add Up to More Than 100%: Cumulative Categories
On this page
Problem statement
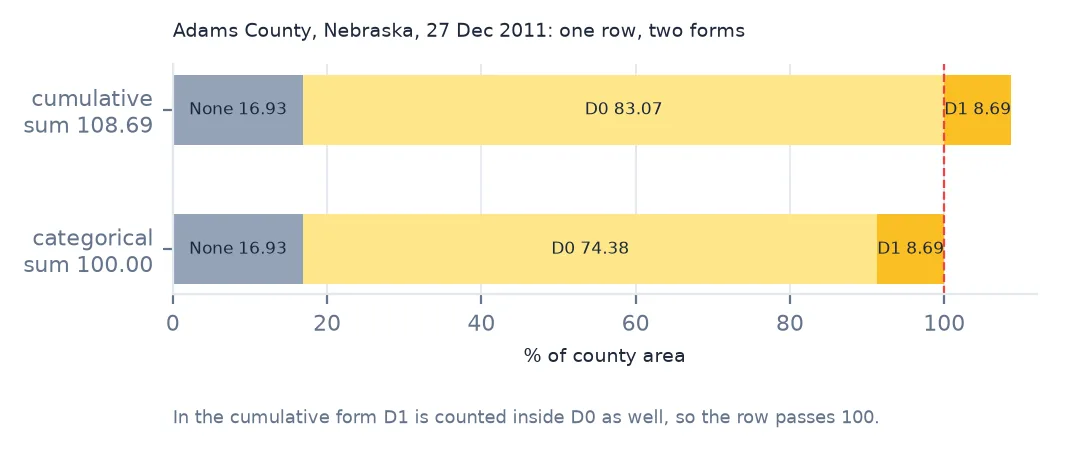
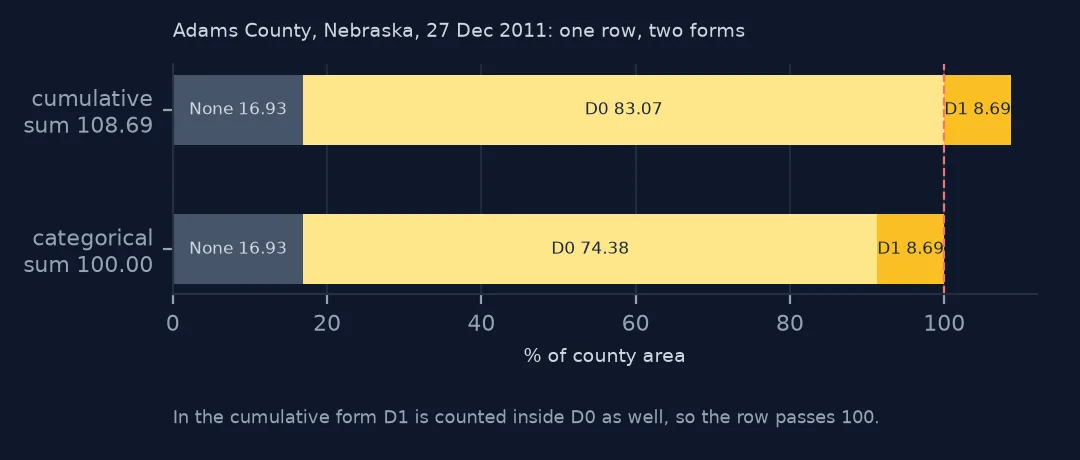
You download Drought Monitor statistics, add up the D0 to D4 columns to get "percent in drought", and get numbers up to 500%. Or a row reads None 16.93, D0 83.07, D1 8.69 and sums to 108.69. Nothing is corrupt: the default statistics are cumulative, so each column is the share in that category or worse, and the shares nest inside each other. The weekly shapefiles, on the other hand, are categorical — each polygon is exactly one category. This page shows how to tell the two forms apart, convert between them, and reconcile the shapefiles with the published numbers, using Nebraska's counties through 2012.
Quick answer
In the cumulative form (statisticsType=1, the default), D0 already is "D0 or worse"; to get exact categories, subtract the next column: D0 − D1, D1 − D2, and so on, with D4 unchanged. Or request statisticsType=2 from the service.
cols = ["None", "D0", "D1", "D2", "D3", "D4"]
print(cum[cols].iloc[0].to_dict(), "| sum", round(cum[cols].iloc[0].sum(), 2))
categorical = cum[["D0", "D1", "D2", "D3", "D4"]] - cum[["D1", "D2", "D3", "D4"]].assign(D5=0).values
categorical.insert(0, "None", cum["None"])
print(categorical.iloc[0].round(2).to_dict(), "| sum", round(categorical.iloc[0].sum(), 2))
print(f"rows matching the service's own categorical numbers: {(categorical.round(2).values == catg[cols].values).all(axis=1).mean():.1%}")
{'None': 16.93, 'D0': 83.07, 'D1': 8.69, 'D2': 0.0, 'D3': 0.0, 'D4': 0.0} | sum 108.69
{'None': 16.93, 'D0': 74.38, 'D1': 8.69, 'D2': 0.0, 'D3': 0.0, 'D4': 0.0} | sum 100.0
rows matching the service's own categorical numbers: 99.6%
The first Nebraska row sums to 108.69 because D1's 8.69 is counted inside D0's 83.07 as well. Subtracting gives 74.38 in exactly D0, and the row sums to 100.0. The converted table matches the service's own categorical numbers in 99.6% of rows; the rest differ only in the second decimal, from rounding.
Telling the forms apart and converting
1. Recognise cumulative numbers
s = cum[cols].sum(axis=1)
print(f"row sums, cumulative form: min {s.min():.1f}, max {s.max():.1f}; categorical form: {catg[cols].sum(axis=1).round(1).unique()[:3]}")
print(f"D0 >= D1 >= ... >= D4 in every row: {(cum[['D0', 'D1', 'D2', 'D3', 'D4']].diff(axis=1).iloc[:, 1:] <= 0.001).all(axis=1).mean():.1%}")
row sums, cumulative form: min 100.0, max 500.0; categorical form: [100.]
D0 >= D1 >= ... >= D4 in every row: 100.0%
Two tests identify the cumulative form: rows summing to between 100 and 500, and columns that never increase from D0 to D4. Every row passes the second test. The categorical form sums to 100 in every row.
2. Convert either way
back = catg[["D4", "D3", "D2", "D1", "D0"]].cumsum(axis=1)[["D0", "D1", "D2", "D3", "D4"]]
print(f"cumulative rebuilt from categorical, largest error: {(back.values - cum[['D0', 'D1', 'D2', 'D3', 'D4']].values).__abs__().max():.2f} points")
cumulative rebuilt from categorical, largest error: 0.01 points
Going the other way, a cumulative sum from D4 back to D0 rebuilds the cumulative table to within 0.01 points.
3. The shapefiles are categorical
shp = gpd.read_file("zip://data/USDM_20120925_M.zip").to_crs(5070)
lower48 = gpd.clip(shp, states.union_all())                       # the file also covers Alaska, Hawaii and Puerto Rico
print(f"polygon area outside the lower 48: {(shp.area.sum() - lower48.area.sum()) / 1e9:,.0f} thousand km2")
km2 = lower48.assign(km2=lower48.area / 1e6).groupby("DM").km2.sum()
print("polygon area by category in the lower 48, thousand km2:", (km2 / 1000).round(0).astype(int).to_dict())
d0, d1 = shp[shp.DM == 0].union_all(), shp[shp.DM == 1].union_all()
print(f"D1 polygons lying inside D0 polygons: {d1.intersection(d0).area / d1.area:.1%}")
polygon area outside the lower 48: 459 thousand km2
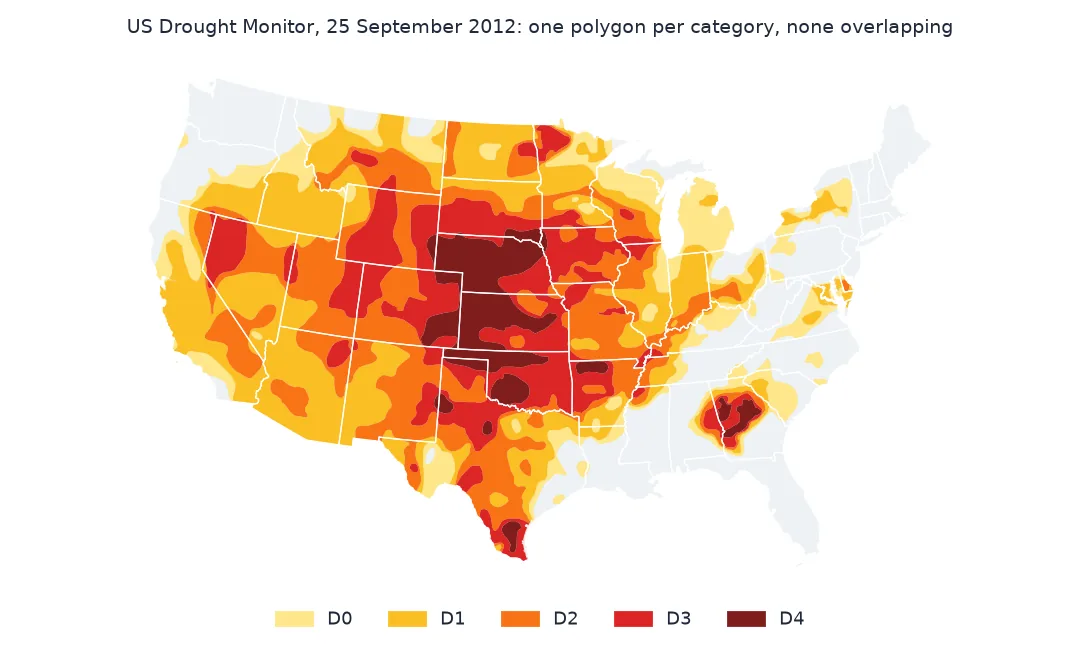
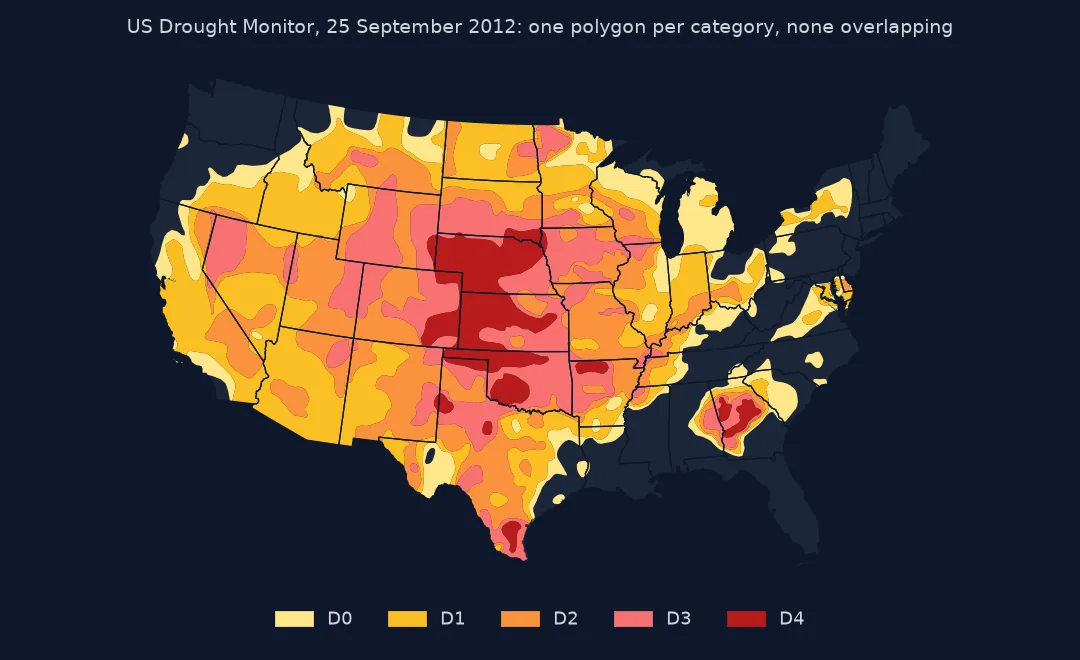
polygon area by category in the lower 48, thousand km2: {0: 867, 1: 1817, 2: 1607, 3: 1196, 4: 477}
D1 polygons lying inside D0 polygons: 0.0%
The weekly shapefile has one polygon per category, and they do not overlap: none of the D1 area lies inside a D0 polygon. That is the categorical form. The file also covers Alaska, Hawaii and Puerto Rico — 459 thousand km² of polygons outside the lower 48 on this date — which must be clipped away before comparing with statistics for the contiguous states.
4. Match the shapefile to the published statistic
conus_km2 = states.area.sum() / 1e6
shp_cum = km2[::-1].cumsum()[::-1] / conus_km2 * 100
pub = us[us.MapDate == "2012-09-25"][["D0", "D1", "D2", "D3", "D4"]].iloc[0]
print(pd.DataFrame({"from polygons, cumulative": shp_cum.round(2).values, "published": pub.values}, index=pub.index).to_string())
from polygons, cumulative published
D0 76.11 76.60
D1 65.04 65.45
D2 41.86 42.12
D3 21.35 21.49
D4 6.09 6.12
Accumulating the clipped polygon areas from D4 up and dividing by the lower 48's area reproduces the published national cumulative shares to within half a point: 76.11 against 76.60 for D0 or worse, 6.09 against 6.12 for D4. The remaining gap comes from boundary generalisation and the area each side uses for the denominator. Without the clip, D0 or worse comes out several points too high.
The wrong sum and the right subtraction
The data used on this page
The US Drought Monitor web service's county statistics for Nebraska in both forms (cumulative, statistics type 1, and categorical, type 2) for 2012, its national area statistics, and the weekly shapefile for 25 September 2012; Census Bureau 2023 cartographic boundary states for the contiguous US area.
import io
from pathlib import Path

import geopandas as gpd
import numpy as np
import pandas as pd
import requests

Path("data").mkdir(exist_ok=True)
API = "https://usdmdataservices.unl.edu/api"


def usdm_get(path, aoi, stat_type, start="1/1/2012", end="12/31/2012"):
    r = requests.get(f"{API}/{path}", params={"aoi": aoi, "startdate": start, "enddate": end, "statisticsType": stat_type}, timeout=300)
    d = pd.read_csv(io.StringIO(r.text), dtype={"FIPS": str})
    d["MapDate"] = pd.to_datetime(d.MapDate.astype(str), format="%Y%m%d")
    return d.sort_values(["MapDate"] + (["FIPS"] if "FIPS" in d else [])).reset_index(drop=True)


cum = usdm_get("CountyStatistics/GetDroughtSeverityStatisticsByAreaPercent", "NE", 1)    # cumulative: D1 = D1 or worse
catg = usdm_get("CountyStatistics/GetDroughtSeverityStatisticsByAreaPercent", "NE", 2)   # categorical: D1 = exactly D1
us = usdm_get("USStatistics/GetDroughtSeverityStatisticsByAreaPercent", "conus", 1)
for name, url in {"USDM_20120925_M.zip": "https://droughtmonitor.unl.edu/data/shapefiles_m/USDM_20120925_M.zip",
                  "cb_2023_us_state_20m.zip": "https://www2.census.gov/geo/tiger/GENZ2023/shp/cb_2023_us_state_20m.zip"}.items():
    if not Path(f"data/{name}").exists():
        Path(f"data/{name}").write_bytes(requests.get(url, timeout=300).content)
states = gpd.read_file("data/cb_2023_us_state_20m.zip").to_crs(5070)
states = states[~states.STUSPS.isin(["AK", "HI", "PR"])]
print(f"Nebraska 2012: {len(cum):,} county-weeks cumulative, {len(catg):,} categorical; {len(us)} national weeks")
Nebraska 2012: 4,929 county-weeks cumulative, 4,929 categorical; 53 national weeks
Example 1: the wrong sum
wrong = cum[["D0", "D1", "D2", "D3", "D4"]].sum(axis=1)
print(f"'percent in drought' made by adding cumulative columns: up to {wrong.max():.0f}%")
print(f"the right figure for D0 or worse is just D0: up to {cum.D0.max():.0f}%")
'percent in drought' made by adding cumulative columns: up to 500%
the right figure for D0 or worse is just D0: up to 100%
Adding cumulative columns reaches 500% for a county wholly in D4, where every column is 100. The share in D0 or worse is just the D0 column, which never exceeds 100%.
Example 2: area in exactly D2
lan = cum.FIPS == "31109"
print("Lancaster County, 2012, % of area in exactly D2, by month:",
      (categorical[lan].D2.groupby(cum[lan].MapDate.dt.month).mean()).round(1).to_dict())
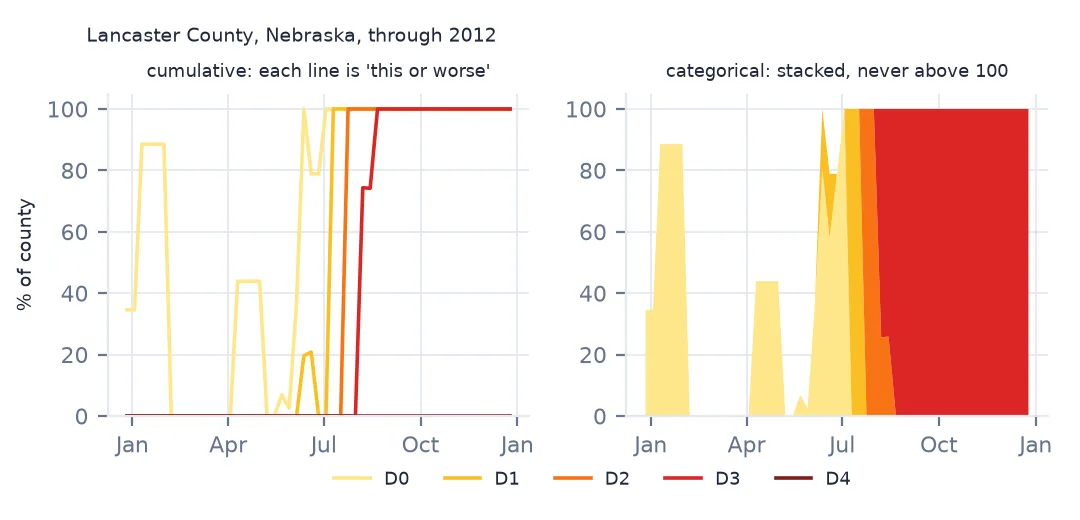
Lancaster County, 2012, % of area in exactly D2, by month: {1: 0.0, 2: 0.0, 3: 0.0, 4: 0.0, 5: 0.0, 6: 0.0, 7: 40.0, 8: 12.9, 9: 0.0, 10: 0.0, 11: 0.0, 12: 0.0}
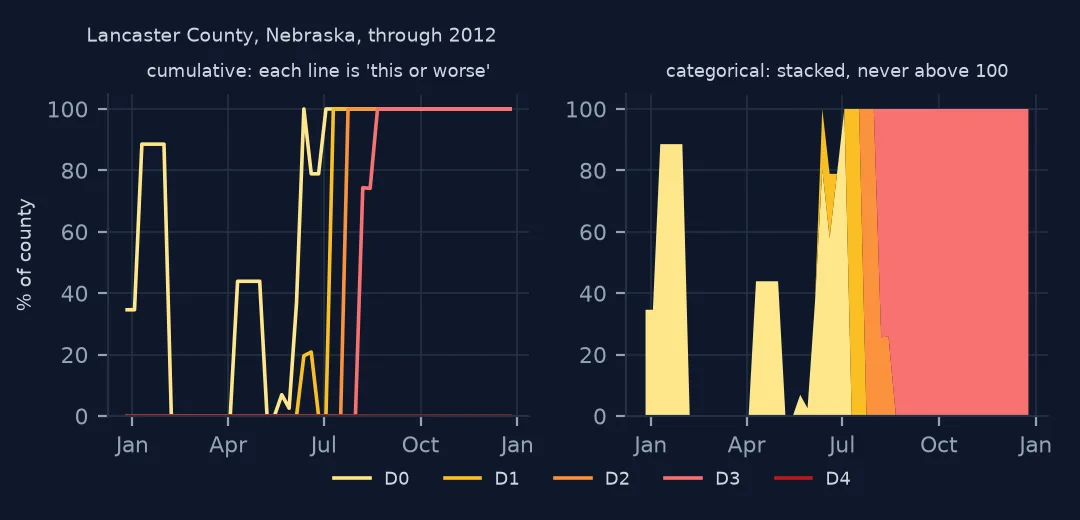
Exact-category shares show the path a drought takes. Lancaster County had 40.0% of its area in exactly D2 on average in July 2012 and 12.9% in August, then none: by September it had moved on to D3. In cumulative form D2 would have stayed at 100 throughout, hiding that transition.
Why two forms exist
The Drought Monitor is drawn as categorical polygons — each place is in exactly one category — because that is how a map works. Most users then ask cumulative questions: what share of the state is in moderate drought or worse? Drought programmes are triggered that way too (for example, by weeks at D2 or worse), so the statistics service defaults to the cumulative form. Both are correct; they answer different questions, and the only mistake is treating one as the other.
The None column is the same in both forms: the area outside every drought polygon. In the cumulative form None + D0 = 100, which is a quick check that you are looking at cumulative data.
Other places this goes wrong
- Averaging over time. Mean cumulative D1 over a year is the average share in D1 or worse; mean categorical D1 is the share in exactly D1. Neither is wrong, but they are not interchangeable in a chart legend.
- Stacked bar charts. Stack the categorical form; stacking cumulative shares draws a bar up to 500%.
- Shapefile areas in degrees. Reproject before computing area (EPSG:5070 here);
.areaon latitude-longitude coordinates gives square degrees. - Rounding. Published shares have two decimals, so converting between forms can disagree in the last digit.
Internal links
- How to analyse US Drought Monitor county statistics — the cumulative columns in use
- How to animate the US Drought Monitor — the categorical shapefiles, week by week
- How to count the people living in drought — D1 meaning D1 or worse
FAQ
How do I get "percent of area in drought" from Drought Monitor statistics?
Take the D1 column of the cumulative statistics (D1 or worse), or D0 if abnormally dry counts. Do not add columns.
Are the Drought Monitor shapefiles cumulative?
No. Each polygon is a single category and they do not overlap; accumulate their areas from D4 upwards to get cumulative shares.