
SPI Fails in Dry Climates: Months With No Rain and the Gamma Fit
On this page
Problem statement
SPI code that works for a humid station breaks in a desert. In Las Vegas, 20 of the 30 Junes from 1991 to 2020 had no rain at all, and a gamma distribution cannot be fitted to zeros — scipy raises FitDataError. The common workaround, dropping the zeros before fitting, makes every rainless month -inf. The textbook fix, a probability mass at zero, removes the infinities but scores a rainless June above normal. This page works through each failure on 77 years of Las Vegas records and fixes them by placing a zero at the centre of its probability mass.
Quick answer
Fit the gamma to the non-zero totals only, estimate the probability of zero from the reference period, and give a zero total the probability at the middle of that mass, (n0 + 1) / (2(n + 1)), rather than its top. That keeps SPI finite and puts a rainless month below normal.
p = monthly_precip("USW00023169")
acc = p.rolling(1).sum()
june = acc[acc.index.month == 6].loc["1991":"2020"].dropna()
print(f"Las Vegas, June totals 1991-2020: {len(june)} years, {(june == 0).sum()} with no rain at all")
try:
    stats.gamma.fit(june, floc=0)
    print("gamma fit on all values: ran")
except Exception as e:
    print("gamma fit on all values:", type(e).__name__)
n, n0 = len(june), (june == 0).sum()
a, _, b = stats.gamma.fit(june[june > 0], floc=0)
print(f"mixed fit: P(zero) = {n0 / n:.2f}, gamma shape {a:.2f} on the {n - n0} wet Junes")
print(f"SPI of a rainless June: {stats.norm.ppf(n0 / n):+.2f} if it takes the top of the zero mass, "
      f"{stats.norm.ppf((n0 + 1) / (2 * (n + 1))):+.2f} at its centre")
Las Vegas, June totals 1991-2020: 30 years, 20 with no rain at all
gamma fit on all values: FitDataError
mixed fit: P(zero) = 0.67, gamma shape 1.46 on the 10 wet Junes
SPI of a rainless June: +0.43 if it takes the top of the zero mass, -0.42 at its centre
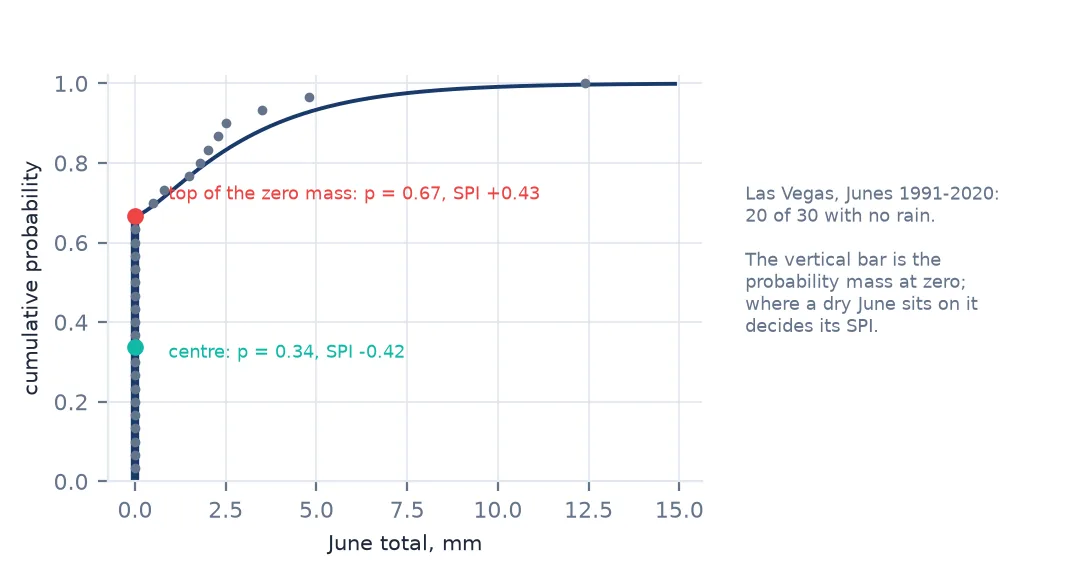
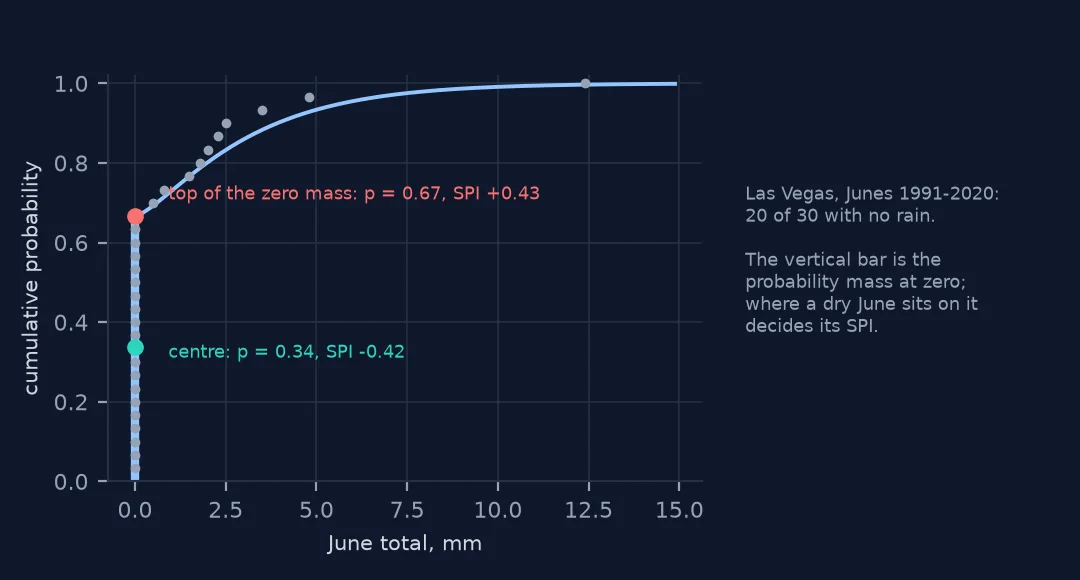
With two thirds of Junes dry, the gamma is fitted to the 10 wet ones (shape 1.46). The usual mixed formula, q + (1 − q)·G(x), gives a zero total the probability q = 0.67 — the top of the zero mass — and an SPI of +0.43: a June with no rain is scored as wetter than normal. At the centre of the mass it scores −0.42.
Three ways to handle zeros, two of them wrong
1. How common are dry months
z = (p.loc["1991":"2020"] == 0).groupby(p.loc["1991":"2020"].index.month).mean()
print("share of months with zero rain, 1991-2020:", (100 * z).round(0).astype(int).to_dict())
share of months with zero rain, 1991-2020: {1: 20, 2: 10, 3: 20, 4: 33, 5: 47, 6: 67, 7: 17, 8: 17, 9: 40, 10: 43, 11: 37, 12: 7}
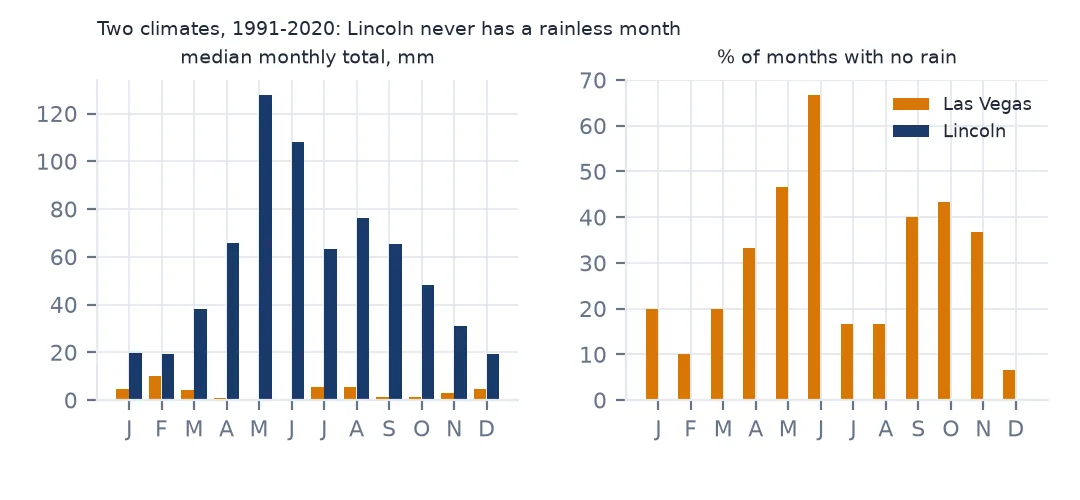
Rainless months are common in every season in Las Vegas: 67% of Junes, 47% of Mays, 43% of Octobers, and even 7% of Decembers, the month least often dry. Any monthly SPI here has to handle zeros in every calendar month.
2. What a naive SPI does
def naive_spi(x, ref=("1991", "2020")):
    out = pd.Series(np.nan, index=x.index)
    for m in range(1, 13):
        sel = x[x.index.month == m]
        v = sel.loc[ref[0]:ref[1]].dropna()
        v = v[v > 0]                                   # zeros dropped to make the fit run
        a, _, b = stats.gamma.fit(v, floc=0)
        out[sel.index] = stats.norm.ppf(stats.gamma.cdf(sel, a, loc=0, scale=b))
    return out
n1 = naive_spi(p)
print(f"SPI-1 values that are -inf: {np.isinf(n1).sum()}; months with zero rain: {(p == 0).sum()}")
SPI-1 values that are -inf: 252; months with zero rain: 252
Dropping zeros to make the fit run gives exactly one -inf per rainless month — 252 of them — because a gamma distribution puts zero probability at zero. They break means, plots and any threshold count downstream.
3. The usual mixed distribution
m1 = spi(p, 1)
print(f"mixed SPI-1: -inf values {np.isinf(m1).sum()}; lowest value {m1.min():.2f}; mean over 1991-2020 {m1.loc['1991':'2020'].mean():+.2f}")
print("a zero-rain month scores:", m1[p == 0].groupby(m1[p == 0].index.month).first().round(2).to_dict())
mixed SPI-1: -inf values 0; lowest value -1.50; mean over 1991-2020 +0.20
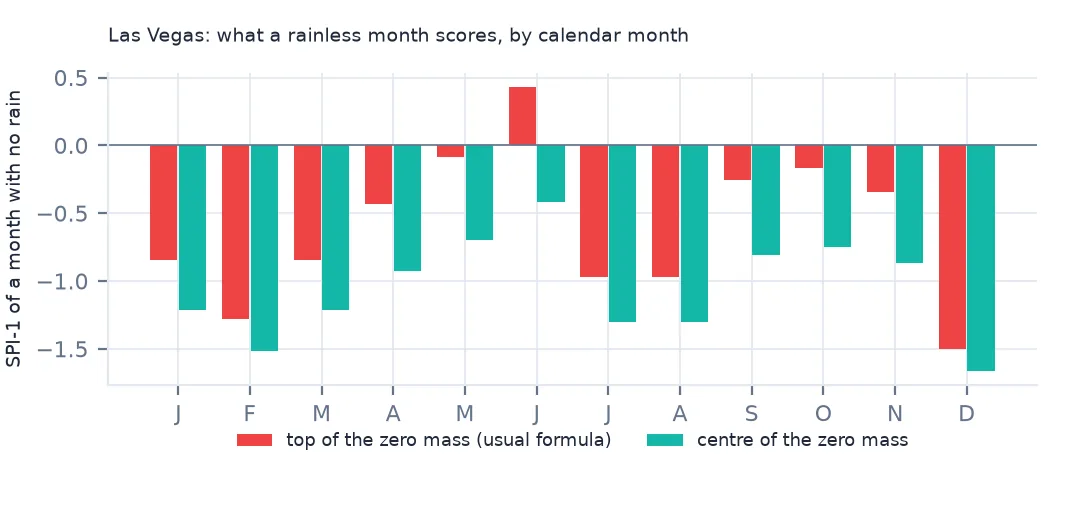
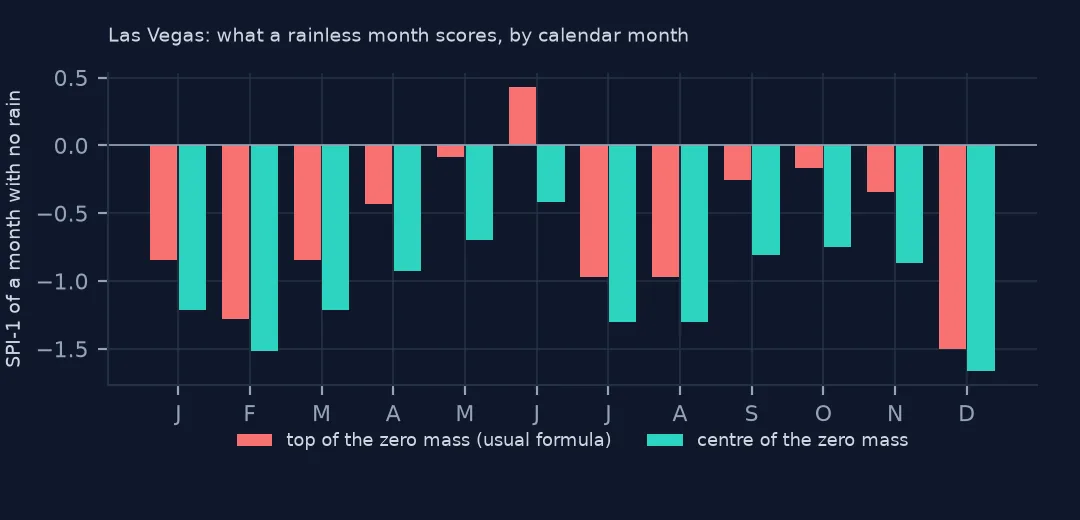
a zero-rain month scores: {1: -0.84, 2: -1.28, 3: -0.84, 4: -0.43, 5: -0.08, 6: 0.43, 7: -0.97, 8: -0.97, 9: -0.25, 10: -0.17, 11: -0.34, 12: -1.5}
The mixed distribution removes the infinities, and the lowest SPI-1 becomes −1.50. But look at what a rainless month scores: −1.50 in December, where dry months are rare, and +0.43 in June, where they are the norm. The reference-period mean is +0.20 instead of zero. Giving a zero the full probability q treats every rainless month as the wettest of the dry ones.
4. Score a zero at the centre of its mass
def spi_centre(precip, scale, ref=("1991", "2020")):
    acc = precip.rolling(scale).sum()
    out = pd.Series(np.nan, index=acc.index)
    for m in range(1, 13):
        sel = acc[acc.index.month == m]
        v = sel.loc[ref[0]:ref[1]].dropna()
        n, n0 = len(v), (v == 0).sum()
        a, _, b = stats.gamma.fit(v[v > 0], floc=0)
        prob = n0 / n + (1 - n0 / n) * stats.gamma.cdf(sel, a, loc=0, scale=b)
        prob = np.where(sel == 0, (n0 + 1) / (2 * (n + 1)), prob)   # a zero sits halfway up the zero mass
        out[sel.index] = stats.norm.ppf(prob)
    return out
c1 = spi_centre(p, 1)
print("a zero-rain month now scores:", c1[p == 0].groupby(c1[p == 0].index.month).first().round(2).to_dict())
print(f"mean over 1991-2020: {c1.loc['1991':'2020'].mean():+.2f} (top of the mass: {m1.loc['1991':'2020'].mean():+.2f})")
a zero-rain month now scores: {1: -1.21, 2: -1.52, 3: -1.21, 4: -0.93, 5: -0.7, 6: -0.42, 7: -1.3, 8: -1.3, 9: -0.81, 10: -0.75, 11: -0.86, 12: -1.66}
mean over 1991-2020: +0.03 (top of the mass: +0.20)
Placing zero at the centre of its mass (the correction Stagge and colleagues proposed in 2015) moves every rainless month down: June to −0.42, December to −1.66. The reference mean falls to +0.03, close to the zero a standardised index should have.
5. Longer scales: zeros the reference period never saw
for k in [1, 3, 6, 12]:
    acc_k = p.rolling(k).sum()
    print(f"SPI-{k:<2d}: totals of zero {(acc_k == 0).mean():.1%}; top-of-mass range {spi(p, k).min():.2f} to {spi(p, k).max():.2f}; "
          f"centred range {spi_centre(p, k).min():.2f} to {spi_centre(p, k).max():.2f}")
SPI-1 : totals of zero 27.2%; top-of-mass range -1.50 to 4.15; centred range -1.66 to 4.15
SPI-3 : totals of zero 3.3%; top-of-mass range -inf to 3.02; centred range -2.14 to 3.02
SPI-6 : totals of zero 0.3%; top-of-mass range -inf to 2.46; centred range -2.94 to 2.46
SPI-12: totals of zero 0.0%; top-of-mass range -2.88 to 2.55; centred range -2.88 to 2.55
At three and six months, zero totals are rarer (3.3% and 0.3% of months), and that creates a second failure: some calendar months had no zero three-month total in 1991–2020, so q is 0, and a zero total outside the reference period gets -inf even with the mixed formula. The centred version gives those a finite value (the lowest SPI-6 becomes −2.94), because (n0 + 1) / (2(n + 1)) is never zero. By 12 months there are no zero totals and the methods agree.
A wet climate for contrast, and a desert's wet month
The data used on this page
NOAA NCEI GHCN-Daily precipitation for Las Vegas Harry Reid International Airport, Nevada (USW00023169), and, for comparison, Lincoln, Nebraska (USW00014939).
from pathlib import Path

import numpy as np
import pandas as pd
import requests
from scipy import stats

Path("data").mkdir(exist_ok=True)
GHCN = "https://www.ncei.noaa.gov/data/global-historical-climatology-network-daily/access/{}.csv"
STATIONS = ["USW00023169", "USW00014939"]                                       # Las Vegas, Lincoln
for sid in STATIONS:
    f = Path(f"data/{sid}.csv")
    if not f.exists():
        # the per-station files grow daily; this page uses complete months up to December 2025
        f.write_bytes(requests.get(GHCN.format(sid), timeout=300).content)


def monthly_precip(sid, min_days=25):
    d = pd.read_csv(f"data/{sid}.csv", usecols=["DATE", "PRCP", "PRCP_ATTRIBUTES"], parse_dates=["DATE"], low_memory=False)
    d = d[(d.DATE < "2026-01-01")]
    ok = d.PRCP_ATTRIBUTES.fillna(",,,").str.split(",").str[1] == ""            # drop quality-flagged values
    d = d.assign(mm=d.PRCP.where(ok) / 10).set_index("DATE")
    m = d.mm.resample("MS").agg(["sum", "count"])
    return m["sum"].where(m["count"] >= min_days)                                # a month needs 25 days of data


def spi(precip, scale, ref=("1991", "2020")):
    """Standardized Precipitation Index: gamma fit per calendar month on the reference period, with a point mass at zero."""
    acc = precip.rolling(scale).sum()
    out = pd.Series(np.nan, index=acc.index)
    for m in range(1, 13):
        sel = acc[acc.index.month == m]
        ref_vals = sel.loc[ref[0]:ref[1]].dropna()
        q = (ref_vals == 0).mean()
        a, _, b = stats.gamma.fit(ref_vals[ref_vals > 0], floc=0)
        out[sel.index] = stats.norm.ppf(q + (1 - q) * stats.gamma.cdf(sel, a, loc=0, scale=b))
    return out


for sid in STATIONS:
    m = monthly_precip(sid)
    print(f"{sid}: {m.notna().sum()} complete months, {m.first_valid_index():%Y-%m} to {m.last_valid_index():%Y-%m}")
USW00023169: 928 complete months, 1948-09 to 2025-12
USW00014939: 718 complete months, 1948-01 to 2025-12
Example 1: Lincoln never meets the problem
lin = monthly_precip("USW00014939")
print(f"Lincoln: months with zero rain since 1991: {(lin.loc['1991':] == 0).sum()}; Las Vegas: {(p.loc['1991':] == 0).sum()}")
Lincoln: months with zero rain since 1991: 0; Las Vegas: 129
Lincoln, Nebraska, has had no rainless month since 1991; Las Vegas has had 129. Code tested only on a humid station never meets this branch, which is how these bugs reach production.
Example 2: a wet month in a dry climate
wet = m1.idxmax()
print(f"wettest month by SPI-1: {wet:%B %Y}, {p[wet]:.1f} mm, SPI {m1.max():.2f}")
print(f"its calendar-month median 1991-2020: {p[p.index.month == wet.month].loc['1991':'2020'].median():.1f} mm")
wettest month by SPI-1: June 1990, 24.6 mm, SPI 4.15
its calendar-month median 1991-2020: 0.0 mm
The other tail is extreme too. June 1990 brought 24.6 mm to a month whose median is 0.0 mm, and scores 4.15 — a value from far out in a gamma fitted to ten numbers. In a desert, SPI-1 is a poor index in both directions; SPI-3 and longer are steadier, which is why dry-climate drought monitoring rarely uses one month.
Where the zero belongs
A gamma distribution describes positive amounts. Precipitation over a month in a desert is a mixture: a probability q of exactly zero and, otherwise, a positive amount. The cumulative probability of a zero total is any value from 0 to q, because all the dry months are tied. The original SPI papers used q, the top of the tie; that is defensible when q is small, as in humid climates, and misleading when q is large, because the tied dry months are then the middle of the distribution and should score near it.
Using the centre of the tie, with a small-sample correction so that it is never exactly zero, gives each dry month the average rank of all the dry months. It is the same reasoning as giving tied values their mean rank in a rank test. With it, a rainless June in Las Vegas is mildly dry (−0.42): unremarkable, as it should be.
Other dry-climate traps
- Few wet values. With 10 wet Junes, the gamma's shape and scale are uncertain and the upper tail is extrapolation. Report extreme SPI values as "above 3" or "below −3".
- Trace amounts. GHCN-Daily records trace precipitation as 0 with a
Tflag. Treating traces as zero is standard, but say so. - Dry seasons in wet climates. Mediterranean and monsoon climates have zero-heavy months too — a California August or an Indian winter — so this is not only a desert problem.
- Libraries differ. Packages implement zeros differently; check which formula yours uses before comparing results.
Internal links
- How to calculate the SPI in Python — the standard method
- Drought indices explained — what SPI measures
- How much rain and cold cut bike-share ridership — daily rain from the same station network
FAQ
Why does scipy raise FitDataError when fitting SPI?
Because some totals are zero and a gamma with location 0 cannot include them. Fit to the non-zero totals and handle zeros with a probability mass.
Why is my SPI positive for a month with no rain?
Your code gives a zero total the whole zero probability q. Where most months are dry that is above the median. Use the centre of the mass instead.