
How to Draw a Hurricane's Wind Field from HURDAT2 Wind Radii
On this page
Problem statement
A hurricane track is a line, but the storm is an area of damaging wind hundreds of kilometres across, and usually lopsided. Since 2004, HURDAT2 records how far tropical-storm-force (34 kt), 50-kt and hurricane-force (64 kt) winds extend from the centre in each of four quadrants. Those twelve numbers let you draw each fix's wind field as a polygon and sweep it along the track into a swath. This page draws Erin's 2025 wind field, measures how lopsided storms are, and shows that the largest wind fields belong to storms that were not hurricanes at all.
Quick answer
For a fix, take the four radii (nautical miles) for one threshold. Draw a quarter-circle arc for each quadrant, clockwise from north (NE, SE, SW, NW), in an azimuthal equidistant projection centred on the storm, join the arcs into a polygon, and transform it to longitude and latitude. Union the polygons of all fixes for a swath.
from pyproj import CRS, Transformer
from shapely.geometry import Polygon
from shapely.ops import transform


def wind_field(fix, kt):
    """Quadrant radii (nautical miles) as a polygon around the centre, drawn in a local equidistant projection."""
    aeqd = CRS.from_proj4(f"+proj=aeqd +lat_0={fix.lat} +lon_0={fix.lon} +units=m")
    pts = []
    for q, (a0, a1) in zip(("ne", "se", "sw", "nw"), [(0, 90), (90, 180), (180, 270), (270, 360)]):
        r = fix[f"r{kt}_{q}"] * 1852
        pts += [(r * np.sin(np.radians(a)), r * np.cos(np.radians(a))) for a in np.linspace(a0, a1, 19)]
    to_ll = Transformer.from_crs(aeqd, 4326, always_xy=True).transform
    return transform(to_ll, Polygon(pts)), Polygon(pts).area / 1e6


fix = hd[(hd.sid == "AL052025") & hd.synoptic].set_index("time").loc["2025-08-19 12:00"]
poly, km2 = wind_field(fix, 34)
print(f"Erin, 19 Aug 12 UTC: 34-kt radii NE/SE/SW/NW {fix.r34_ne:.0f}/{fix.r34_se:.0f}/{fix.r34_sw:.0f}/{fix.r34_nw:.0f} n mi; area {km2:,.0f} km2")
Erin, 19 Aug 12 UTC: 34-kt radii NE/SE/SW/NW 180/220/150/160 n mi; area 346,795 km2
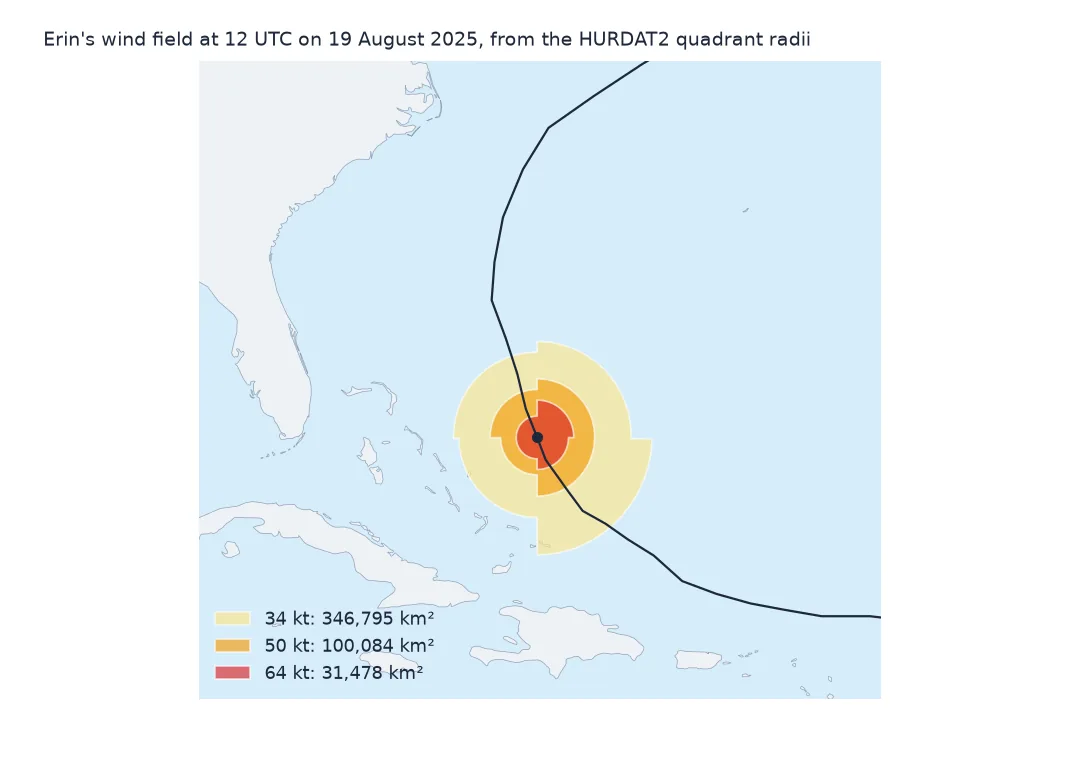
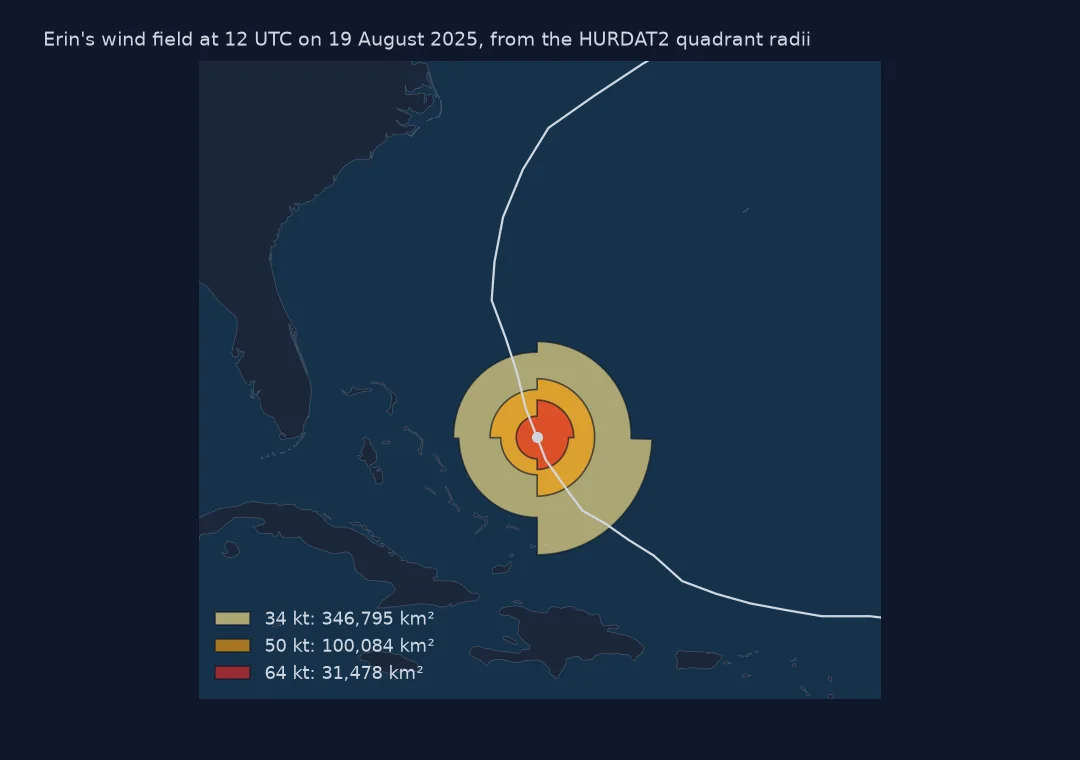
At 12 UTC on 19 August 2025, as Erin passed east of the Bahamas, tropical-storm-force winds reached 180 n mi to the north-east and 220 n mi to the south-east but only 150 to the south-west. The 34-kt field covered 346,795 km², about the size of Germany.
Radii, quadrants and thresholds
1. Which fixes have radii
has = hd.r34_ne.notna()
print(f"fixes with 34-kt radii: {has.sum():,}, first season {hd.season[has].min()}; "
      f"of tropical-storm-strength fixes since 2004: {has[(hd.season >= 2004) & (hd.wind >= 35)].mean():.1%}")
print(f"tropical-storm-strength fixes with a zero radius (no 34-kt wind in that quadrant): "
      f"{(hd.loc[has & (hd.wind >= 35), ['r34_ne', 'r34_se', 'r34_sw', 'r34_nw']] == 0).any(axis=1).mean():.1%}")
fixes with 34-kt radii: 11,805, first season 2004; of tropical-storm-strength fixes since 2004: 99.1%
tropical-storm-strength fixes with a zero radius (no 34-kt wind in that quadrant): 39.3%
11,805 fixes carry 34-kt radii, all from 2004 onward, and 99.1% of tropical-storm-strength fixes since then have them. 39.3% of those have a zero radius in at least one quadrant. A weak or sheared storm may have tropical-storm winds on one side only, so a quadrant polygon can be a pie slice rather than a full shape.
2. Quadrants are not a circle
q = hd.loc[has & (hd.wind >= 64), ["r34_ne", "r34_se", "r34_sw", "r34_nw"]]
print("median 34-kt radius by quadrant for hurricanes, n mi:", q.median().to_dict())
print(f"largest quadrant over smallest: median {(q.max(axis=1) / q.min(axis=1).replace(0, np.nan)).median():.2f}")
median 34-kt radius by quadrant for hurricanes, n mi: {'r34_ne': 140.0, 'r34_se': 120.0, 'r34_sw': 90.0, 'r34_nw': 110.0}
largest quadrant over smallest: median 1.67
For hurricanes, the median 34-kt radius is 140 n mi in the north-east quadrant and 90 in the south-west. The storm's forward motion adds to the winds on its right side, which in the Atlantic is usually north and east. In the median fix the largest quadrant is 1.67 times the smallest. A circle of the mean radius would understate the reach of damaging wind on the right side and overstate it on the left.
3. Three wind thresholds
for kt in (34, 50, 64):
    p, a = wind_field(fix, kt)
    print(f"{kt}-kt field: {a:,.0f} km2")
34-kt field: 346,795 km2
50-kt field: 100,084 km2
64-kt field: 31,478 km2
Each threshold gives a nested polygon. Erin's 50-kt field was 100,084 km² and its hurricane-force core 31,478 km², about a tenth of the tropical-storm field. A wind-field map usually shows all three, from light to dark.
4. The swath along the track
from shapely.ops import unary_union

erin = hd[(hd.sid == "AL052025") & hd.synoptic & hd.r34_ne.notna()]
fields = [wind_field(r, 34)[0] for _, r in erin.iterrows()]
swath = gpd.GeoSeries([unary_union(fields)], crs=4326)
print(f"Erin: {len(fields)} fixes with radii; 34-kt swath {swath.to_crs('ESRI:102008').area.iloc[0] / 1e6:,.0f} km2")
land = gpd.GeoSeries([states.union_all()], crs=4326)
print(f"of which over US states: {swath.intersection(land).to_crs('ESRI:102008').area.iloc[0] / 1e6:,.0f} km2")
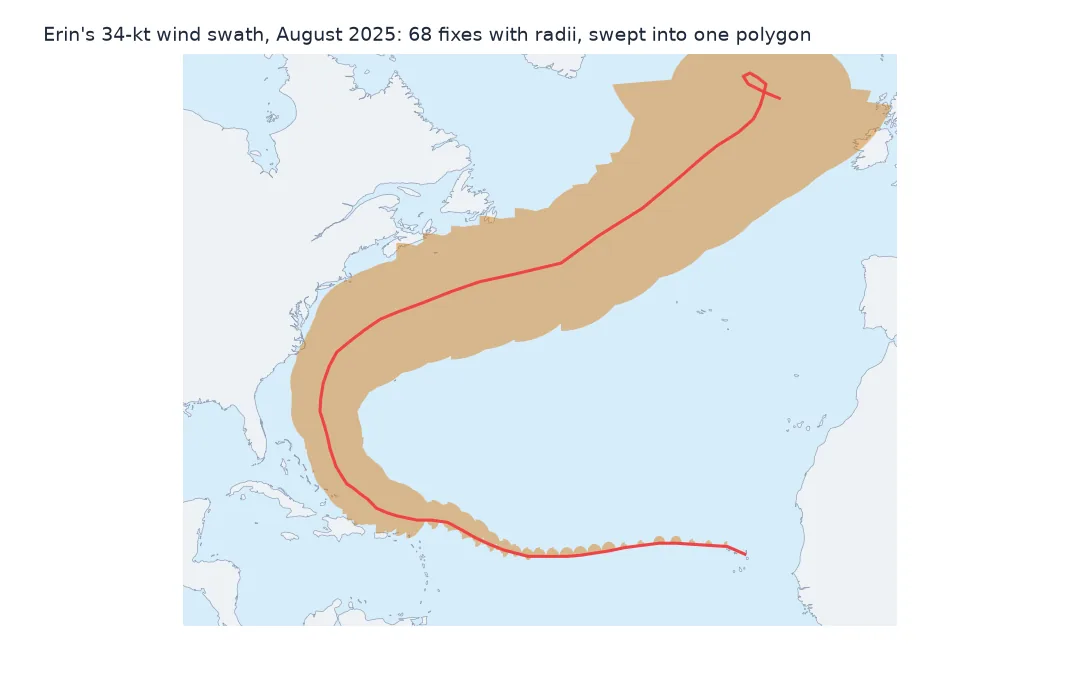
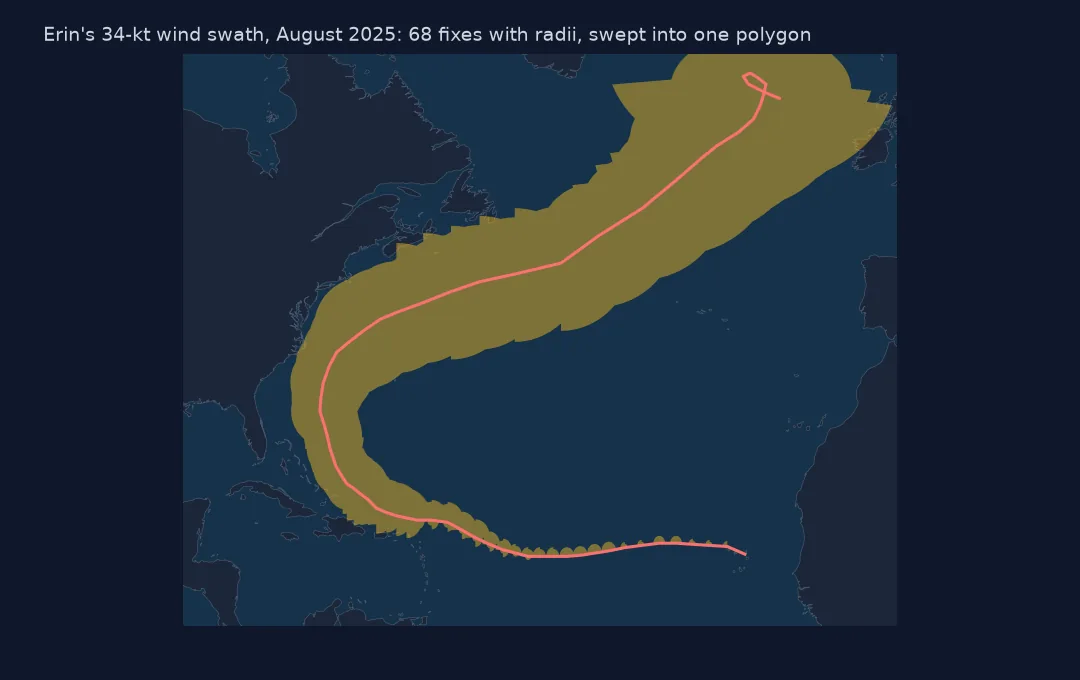
Erin: 68 fixes with radii; 34-kt swath 9,077,635 km2
of which over US states: 4,543 km2
Erin's 68 fixes with radii sweep a 34-kt swath of 9,077,635 km² across the Atlantic, of which only 4,543 km² was over US states, along the Outer Banks of North Carolina. The swath is the polygon to intersect with population, buildings or insured exposure. A buffer around the track line gives a very different answer.
The largest wind fields, and size against strength
The data used on this page
The National Hurricane Center's HURDAT2 Atlantic best-track file, 1851–2025, and Census Bureau 2023 state boundaries.
from pathlib import Path

import geopandas as gpd
import numpy as np
import pandas as pd
import requests

Path("data").mkdir(exist_ok=True)
# NOAA National Hurricane Center HURDAT2 best tracks: Atlantic 1851-2025 (released 23 September 2026) and
# north-east and north-central Pacific 1949-2025 (29 September 2026). NHC keeps every release under its own name.
FILES = ["hurdat2-1851-2025-092326.txt", "hurdat2-nepac-1949-2025-092926.txt"]
for name in FILES:
    if not Path(f"data/{name}").exists():
        Path(f"data/{name}").write_bytes(requests.get(f"https://www.nhc.noaa.gov/data/hurdat/{name}", timeout=300).content)

COLS = ["date", "time", "record", "status", "lat", "lon", "wind", "pressure"] + \
       [f"r{kt}_{q}" for kt in (34, 50, 64) for q in ("ne", "se", "sw", "nw")] + ["rmw"]


def read_hurdat2(path):
    """One header line per storm (id, name, number of fixes), then one line per fix; -999 means missing."""
    rows = []
    for line in open(path):
        f = [x.strip() for x in line.split(",")]
        if f[0][:2].isalpha():
            sid, name = f[0], f[1]
            continue
        rows.append([sid, name] + f[:21])
    h = pd.DataFrame(rows, columns=["sid", "name"] + COLS)
    h["time"] = pd.to_datetime(h.date + h.time, format="%Y%m%d%H%M")
    h["lat"] = h.lat.str[:-1].astype(float) * np.where(h.lat.str[-1] == "S", -1, 1)
    h["lon"] = h.lon.str[:-1].astype(float) * np.where(h.lon.str[-1] == "W", -1, 1)
    for c in COLS[6:]:
        h[c] = pd.to_numeric(h[c]).replace(-999, np.nan)
    h["season"] = h.sid.str[-4:].astype(int)
    h["synoptic"] = h.time.dt.strftime("%H%M").isin(["0000", "0600", "1200", "1800"])
    return h.drop(columns="date")


hd = read_hurdat2("data/hurdat2-1851-2025-092326.txt")
if not Path("data/cb_2023_us_state_20m.zip").exists():
    Path("data/cb_2023_us_state_20m.zip").write_bytes(requests.get("https://www2.census.gov/geo/tiger/GENZ2023/shp/cb_2023_us_state_20m.zip", timeout=300).content)
states = gpd.read_file("data/cb_2023_us_state_20m.zip").to_crs(4326)
print(f"HURDAT2 Atlantic: {hd.sid.nunique():,} storms, {len(hd):,} fixes, {hd.season.min()}-{hd.season.max()}")
HURDAT2 Atlantic: 1,988 storms, 55,524 fixes, 1851-2025
Example 1: the largest wind fields since 2004
r = hd[has].copy()
r["area"] = [wind_field(x, 34)[1] for _, x in r.iterrows()]
big = r.loc[r.groupby("sid").area.idxmax()].sort_values("area", ascending=False)
print(big[["name", "time", "status", "wind", "area"]].head(6).assign(area=lambda d: d.area.round(-3)).to_string(index=False))
name time status wind area
OSCAR 2018-11-03 12:00:00 EX 55 4397000.0
MARTIN 2022-11-04 12:00:00 EX 60 3308000.0
RAFAEL 2012-10-20 00:00:00 EX 50 2615000.0
NIGEL 2023-09-24 12:00:00 EX 45 2523000.0
REBEKAH 2019-10-29 18:00:00 EX 50 2292000.0
SANDY 2012-10-29 23:30:00 EX 70 2014000.0
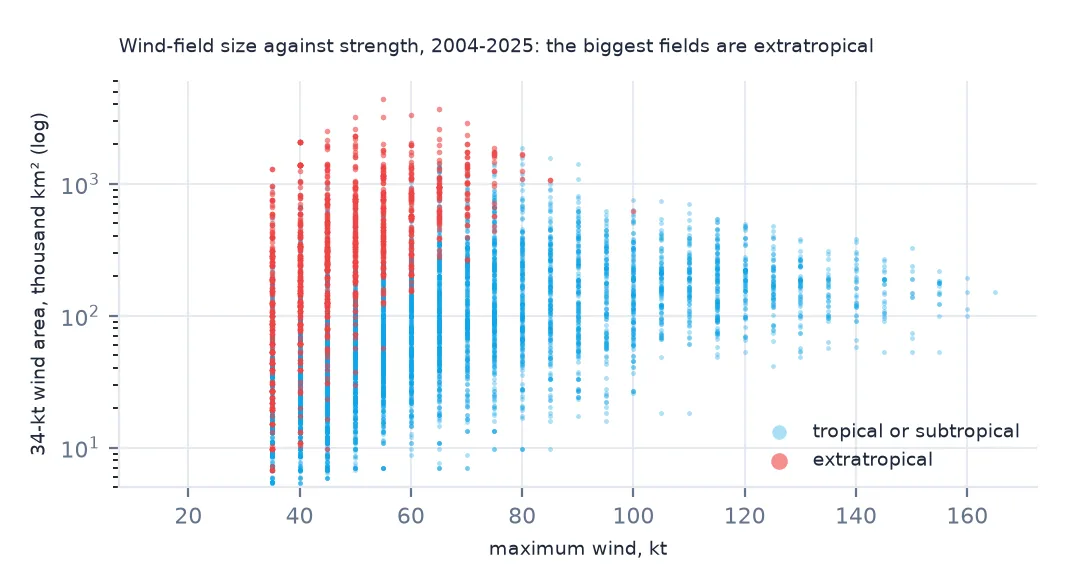
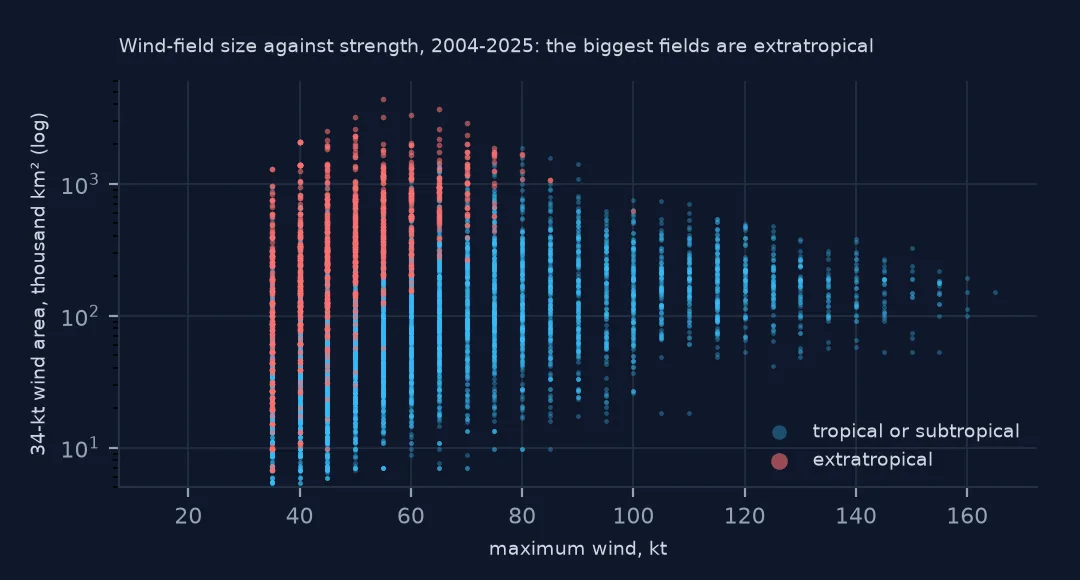
The six largest 34-kt fields since 2004 all belong to storms in their extratropical stage: Oscar 2018 at 4,397,000 km², Martin 2022, Rafael 2012, Nigel 2023, Rebekah 2019 and Sandy 2012 as it came ashore in New Jersey. As a hurricane loses its tropical core over cooler water, its wind field spreads out while its peak wind falls. Filter on status before ranking hurricane size.
Example 2: size and strength are different things
hur = r[r.wind >= 64]
print(f"hurricane fixes: rank correlation of 34-kt area with wind {hur.area.corr(hur.wind, method='spearman'):.2f}")
print("median 34-kt area by category, km2:", hur.groupby(pd.cut(hur.wind, [63, 82, 95, 112, 136, 200], labels=[1, 2, 3, 4, 5]), observed=True).area.median().round(-3).to_dict())
hurricane fixes: rank correlation of 34-kt area with wind 0.06
median 34-kt area by category, km2: {1: 131000.0, 2: 151000.0, 3: 165000.0, 4: 175000.0, 5: 150000.0}
Size and strength are almost unrelated: across hurricane fixes the rank correlation of 34-kt area with maximum wind is 0.06. The median 34-kt area grows only from 131,000 km² at category 1 to 175,000 km² at category 4, and category 5 hurricanes are smaller (150,000 km²). Saffir–Simpson category says nothing about how wide an area a storm affects, which is why NHC forecasts the radii separately.
Where the radii come from
Wind radii are the maximum extent of each wind speed in each quadrant, analysed by NHC forecasters from scatterometer passes, aircraft reconnaissance, buoys and surface observations, and smoothed in the post-season best track. They are an envelope, not a contour: the 34-kt radius in the north-east quadrant is the farthest distance at which 34-kt winds exist anywhere in that quadrant. The polygon built from four arcs therefore overstates the area a little, especially where winds are patchy.
The radii were added to HURDAT2 from the 2004 season. For earlier storms, the Extended Best Track dataset and IBTrACS carry estimates from other sources, with more uncertainty.
Geometry details
- Units. Radii are nautical miles; multiply by 1,852 for metres.
- Project locally. Build each polygon in an azimuthal equidistant projection centred on the fix, so the radii are true distances; a buffer in degrees is wrong east–west.
- Zero radii collapse a quadrant to the centre point. The polygon is still valid but not convex.
- Swaths crossing the antimeridian (Pacific storms) need splitting before union.
Internal links
- How to read HURDAT2 — the radii columns
- How to map a hurricane season's tracks — the centre lines
- Accumulated cyclone energy explained — a season measure that ignores size
FAQ
What are wind radii in HURDAT2?
The maximum distance, in nautical miles, from the storm centre at which 34-kt, 50-kt and 64-kt winds occur in each of the four quadrants (NE, SE, SW, NW). They are available from 2004.
Are stronger hurricanes bigger?
Not much. Across Atlantic hurricane fixes since 2004 the rank correlation between the 34-kt wind area and maximum wind is 0.06.