
Why Restaurant Inspection Data Only Shows Restaurants Still Open
On this page
Problem statement
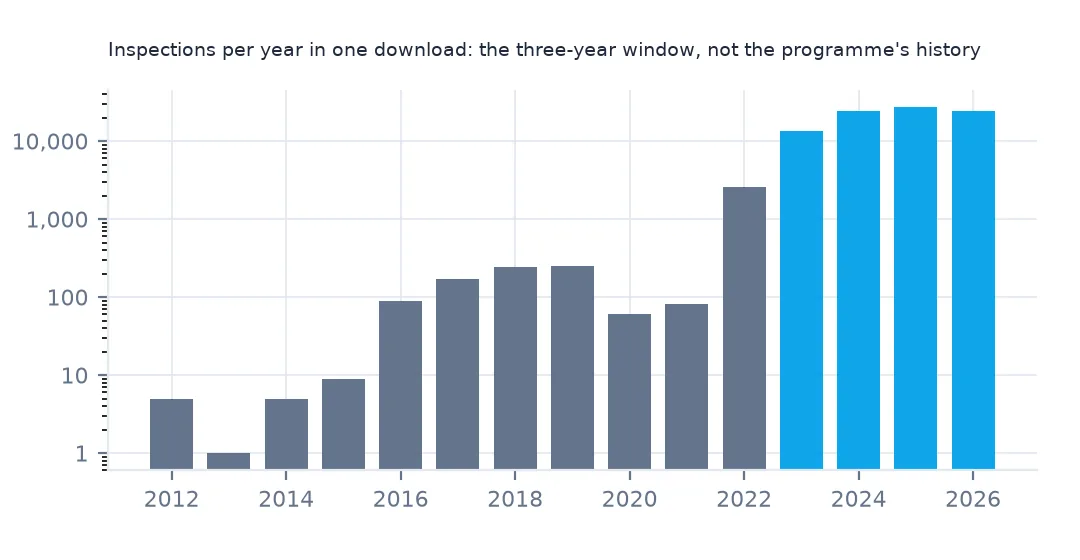
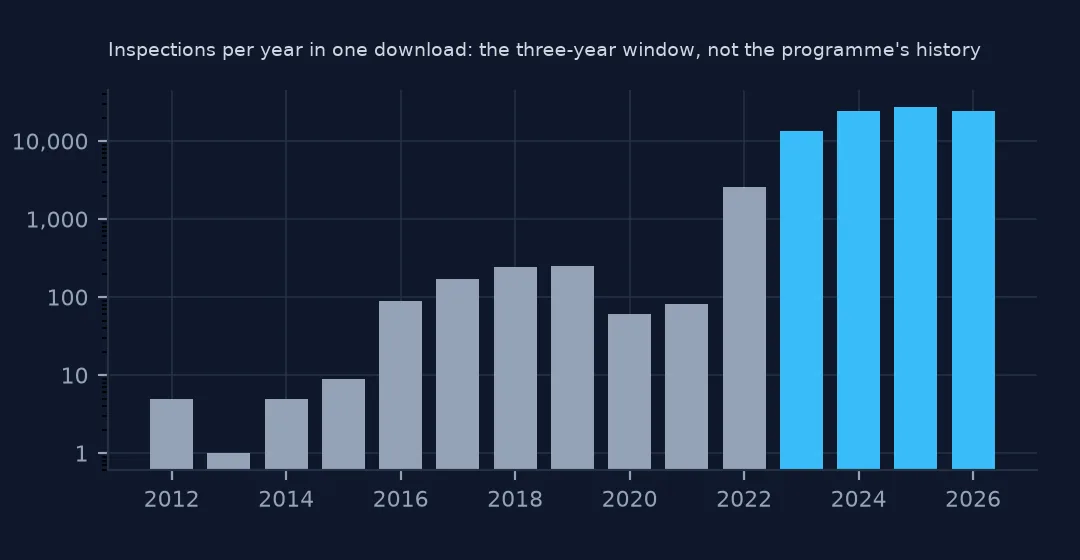
Plot New York's restaurant inspections by year and the line rises from almost nothing before 2022 to more than twenty thousand a year since, which looks like a huge expansion of the inspection programme. It is not. The open dataset keeps only restaurants that are still active, and only up to three years of inspections before each one's latest. Closed restaurants vanish with their history. This page measures that window in the October 2026 file and shows what it does to trends, closure counts and any comparison over time.
Quick answer
Treat the file as a snapshot of currently active restaurants, not a history. For trends over time, use only the period every restaurant is fully covered for (roughly the last year), or a series of saved snapshots. Never count closures or bad inspections by year from one download without saying that closed restaurants are missing.
ins = insp[insp.date.dt.year > 1900].drop_duplicates(["CAMIS", "INSPECTION DATE", "INSPECTION TYPE"])
span = ins.groupby("CAMIS").date.agg(["min", "max"])
print(f"inspection years: {ins.date.dt.year.value_counts().sort_index().loc[2016:].to_dict()}")
print(f"longest history of any restaurant: {((span['max'] - span['min']).dt.days / 365.25).max():.2f} years")
inspection years: {2016: 89, 2017: 169, 2018: 241, 2019: 251, 2020: 60, 2021: 82, 2022: 2579, 2023: 13429, 2024: 24601, 2025: 27385, 2026: 24390}
longest history of any restaurant: 3.00 years
Inspections run from 89 in 2016 to 251 in 2019 and 82 in 2021, then 2,579 in 2022 and 27,385 in 2025. No restaurant's kept history is longer than 3.00 years from its first to its last inspection.
The three-year window and what it hides
1. A three-year window per restaurant
yrs = (span["max"] - span["min"]).dt.days / 365.25
print(f"restaurants whose oldest kept inspection is within 3 years of their newest: {(yrs <= 3.0).mean():.1%}")
print(f"latest inspection: median {span['max'].median():%Y-%m-%d}; before 2025: {(span['max'] < '2025-01-01').sum():,} restaurants")
restaurants whose oldest kept inspection is within 3 years of their newest: 100.0%
latest inspection: median 2026-03-25; before 2025: 1,310 restaurants
Every restaurant's oldest kept inspection is within three years of its newest. The median restaurant was last inspected on 25 March 2026, and 1,310 have not been inspected since before 2025; their records stop where theirs do.
2. Trends are distorted
y = ins[ins["INSPECTION TYPE"].str.contains("Cycle Inspection / Initial")].groupby(ins.date.dt.year).agg(n=("SCORE", "size"), median=("SCORE", "median"))
print(y.loc[2019:].to_string())
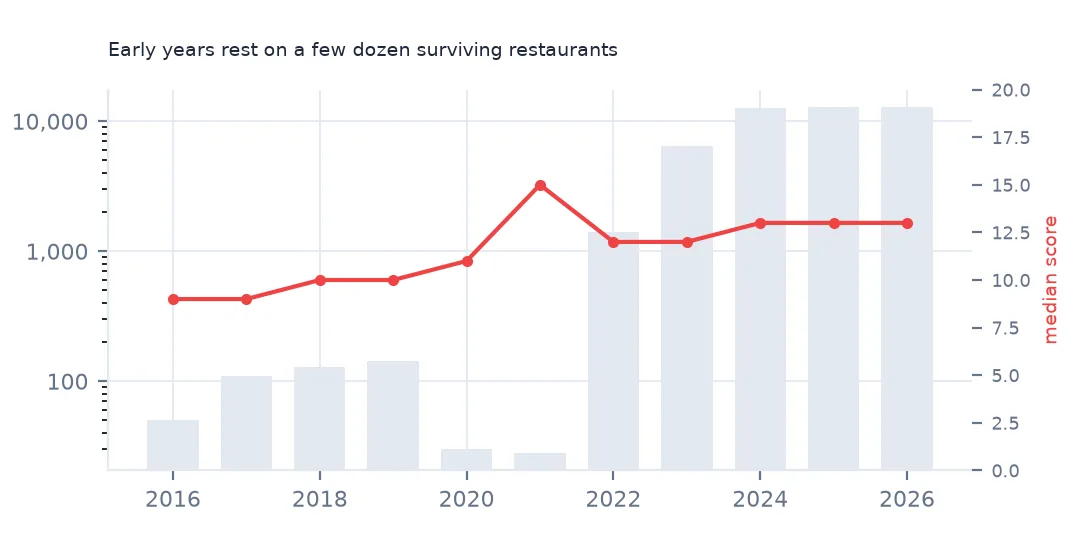
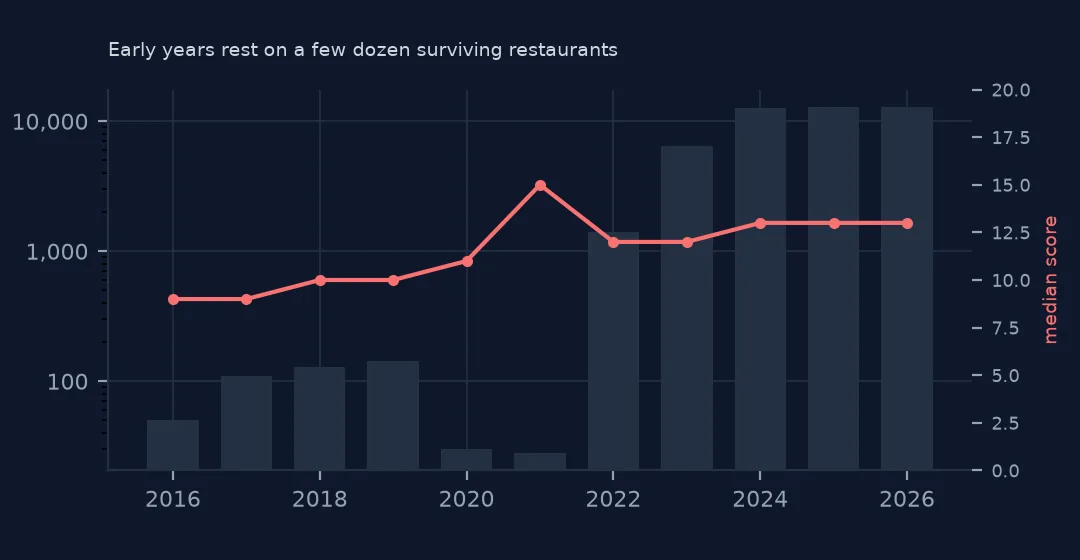
n median
date
2019 144 10.0
2020 30 11.0
2021 28 15.0
2022 1416 12.0
2023 6502 12.0
2024 12664 13.0
2025 12895 13.0
2026 12871 13.0
Initial cycle inspections number 144 in 2019, 30 in 2020 and 1,416 in 2022, then more than twelve thousand a year. The median score moves from 10 in 2019 and 15 in 2021 to 12–13. Those early numbers come from a few dozen surviving restaurants and say nothing about those years.
3. Closed restaurants are gone
cl = ins[ins.ACTION.str.startswith("Establishment Closed", na=False)]
print(f"closure records in the file: {len(cl):,}; restaurants whose latest action is a closure: {(ins.sort_values('date').drop_duplicates('CAMIS', keep='last').ACTION.str.startswith('Establishment Closed', na=False)).sum():,}")
closure records in the file: 1,590; restaurants whose latest action is a closure: 138
The file holds 1,590 closure records, and 138 restaurants' latest action is a closure. Those are restaurants still listed as active while closed. Every restaurant that closed and never reopened before being removed is missing.
Old records and the denominator
The data used on this page
New York City Department of Health and Mental Hygiene restaurant inspection results from NYC Open Data, saved on this site on 16 October 2026.
from pathlib import Path

import geopandas as gpd
import numpy as np
import pandas as pd
import requests
from shapely import wkt

Path("data").mkdir(exist_ok=True)
# NYC Department of Health and Mental Hygiene (DOHMH) restaurant inspection results (NYC Open Data, dataset 43nn-pn8j),
# downloaded on 16 October 2026 and saved on this site (xz-compressed, unchanged), because the city replaces it daily.
# Live: https://data.cityofnewyork.us/api/views/43nn-pn8j/rows.csv?accessType=DOWNLOAD
# Also NYC 2020 Neighborhood Tabulation Areas (dataset 9nt8-h7nd), saved on 15 October 2026.
FILES = ["nyc-restaurant-inspections-2026-10-16-v2.csv.xz", "nyc-nta-2020-2026-10-15.zip"]
for name in FILES:
    if not Path(f"data/{name}").exists():
        Path(f"data/{name}").write_bytes(requests.get(f"https://data.spatialworkflow.io/{name}", timeout=600).content)
insp = pd.read_csv("data/nyc-restaurant-inspections-2026-10-16-v2.csv.xz", dtype=str)
insp["date"] = pd.to_datetime(insp["INSPECTION DATE"], format="%m/%d/%Y")
insp["SCORE"] = pd.to_numeric(insp.SCORE)
insp["lat"], insp["lon"] = pd.to_numeric(insp.Latitude), pd.to_numeric(insp.Longitude)
print(f"DOHMH inspections file: {len(insp):,} rows for {insp.CAMIS.nunique():,} restaurants")
DOHMH inspections file: 296,514 rows for 31,531 restaurants
Example 1: old inspections still present
old = ins[ins.date < "2022-01-01"]
print(f"inspections before 2022: {len(old):,} at {old.CAMIS.nunique()} restaurants; their median latest inspection: {span.loc[old.CAMIS.unique(), 'max'].median():%Y-%m-%d}")
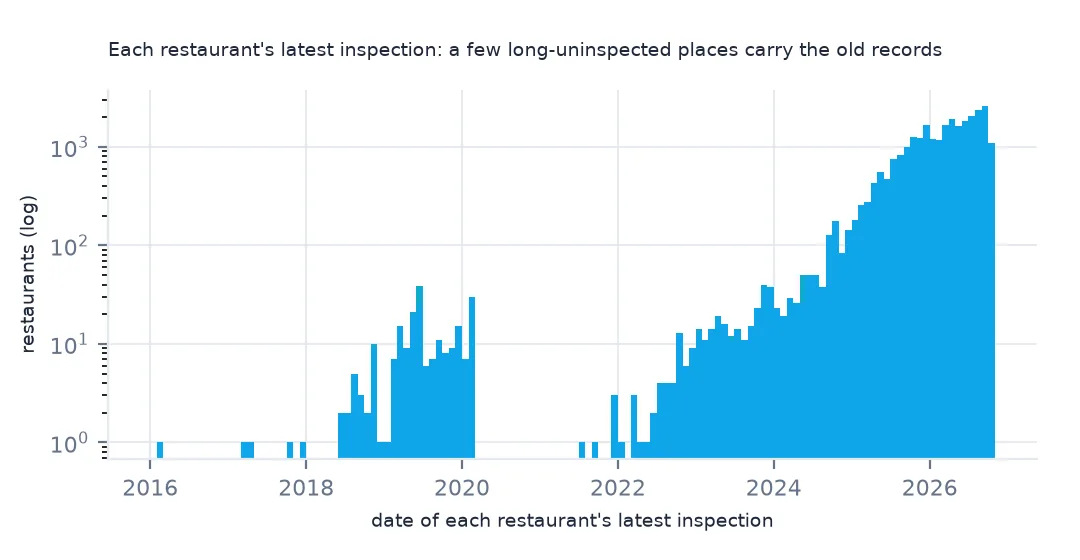
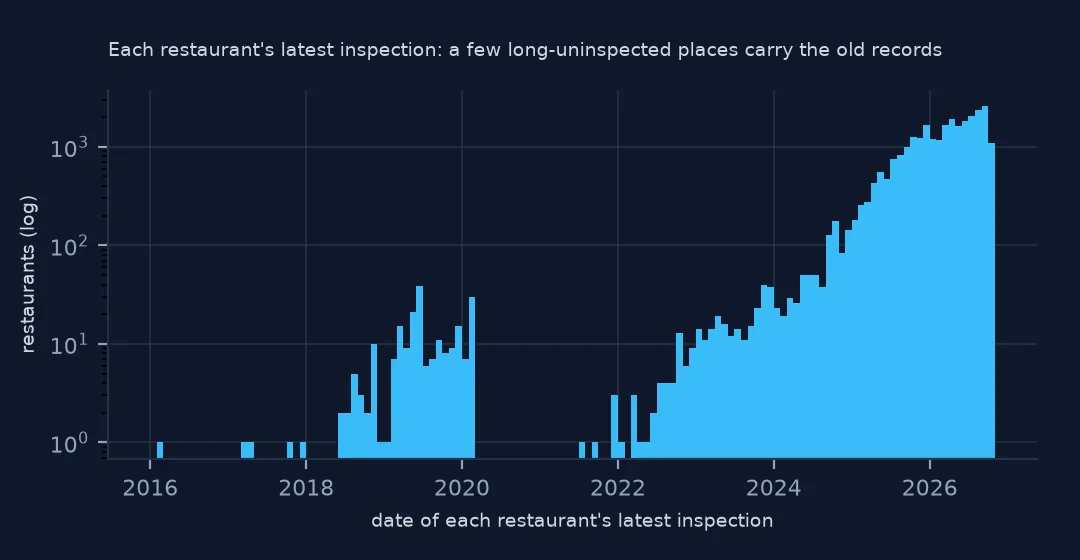
inspections before 2022: 937 at 305 restaurants; their median latest inspection: 2019-10-10
The 937 inspections before 2022 belong to 305 restaurants whose median latest inspection was 10 October 2019. They are restaurants that have not been inspected since, still listed as active, not a sample of those years.
Example 2: the denominator
print(f"restaurants in the file: {ins.CAMIS.nunique():,}; inspected in 2025: {ins[ins.date.dt.year == 2025].CAMIS.nunique():,}")restaurants in the file: 27,631; inspected in 2025: 17,871
Of the 27,631 inspected restaurants in the file, 17,871 were inspected in 2025. Rates per restaurant need a denominator that matches the period, not the whole file.
Survivorship bias
Survivorship bias arises when a dataset keeps only the cases that survived some process. Here the process is staying in business. A restaurant with chronic violations that closed in 2024 takes all its inspections with it, while a clean restaurant that is still open keeps three years of good results. Any average over the past looks better than reality was, and any count of closures or failures in earlier years is too low. The design is reasonable for its purpose, which is showing diners the current record of places they can eat at, but it makes the file unsuitable for history without saved snapshots.
Working around the window
- Save dated copies if you need a history; this page reads one saved on 16 October 2026.
- Compare like with like: restaurants inspected in both years, or only the latest twelve months.
- Closure counts are a floor. Restaurants that closed permanently after a health closure are gone.
- The few pre-2022 inspections belong to restaurants whose latest inspection is also old; they are not a sample of those years.
Internal links
- How to analyse NYC restaurant inspection results — the file and its fields
- Restaurant inspections dated 1 January 1900 — placeholder dates
- How to find restaurants closed by the health department — closures
FAQ
Does the NYC restaurant inspection data include closed restaurants?
No. It covers restaurants in an active status and up to three years of inspections before each one's latest; in the October 2026 file no restaurant's history spans more than 3.00 years.
Can I use NYC restaurant inspection data for trends?
Only with care: the counts by year mostly show the three-year window. Use the latest year, restaurants present throughout, or dated snapshots.