
How to Rank the Most Common Restaurant Health Code Violations
On this page
Problem statement
What do New York's restaurant inspectors find most often? The inspection file lists every violation cited, 289,605 of them under 147 codes, with a description and a critical flag. Ranking them is a groupby, but the result depends on whether you count rows or inspections, and the commonest code is not the most serious. This page ranks violations by frequency, separates critical from non-critical ones, and looks at which cuisines collect the most.
Quick answer
Filter rows with a VIOLATION CODE, group by code and description, and count. For how often each problem occurs, count each code once per inspection and divide by the number of inspections. Separate CRITICAL FLAG == "Critical" from the rest.
v = insp[insp["VIOLATION CODE"].notna() & (insp.date.dt.year > 1900)]
top = v.groupby(["VIOLATION CODE", "VIOLATION DESCRIPTION"]).size().sort_values(ascending=False)
print(f"{len(v):,} violations cited; {v['VIOLATION CODE'].nunique()} codes")
for (code, desc), n in top.head(6).items():
    print(f"{code} {n:>6,}  {desc[:90]}")
289,605 violations cited; 147 codes
10F 40,765 Non-food contact surface or equipment made of unacceptable material, not kept clean, or no
08A 24,858 Establishment is not free of harborage or conditions conducive to rodents, insects or othe
02G 18,821 Cold TCS food item held above 41 °F; smoked or processed fish held above 38 °F; intact raw
10B 18,777 Anti-siphonage or back-flow prevention device not provided where required; equipment or fl
06D 18,576 Food contact surface not properly washed, rinsed and sanitized after each use and followin
06C 17,890 Food, supplies, or equipment not protected from potential source of contamination during s
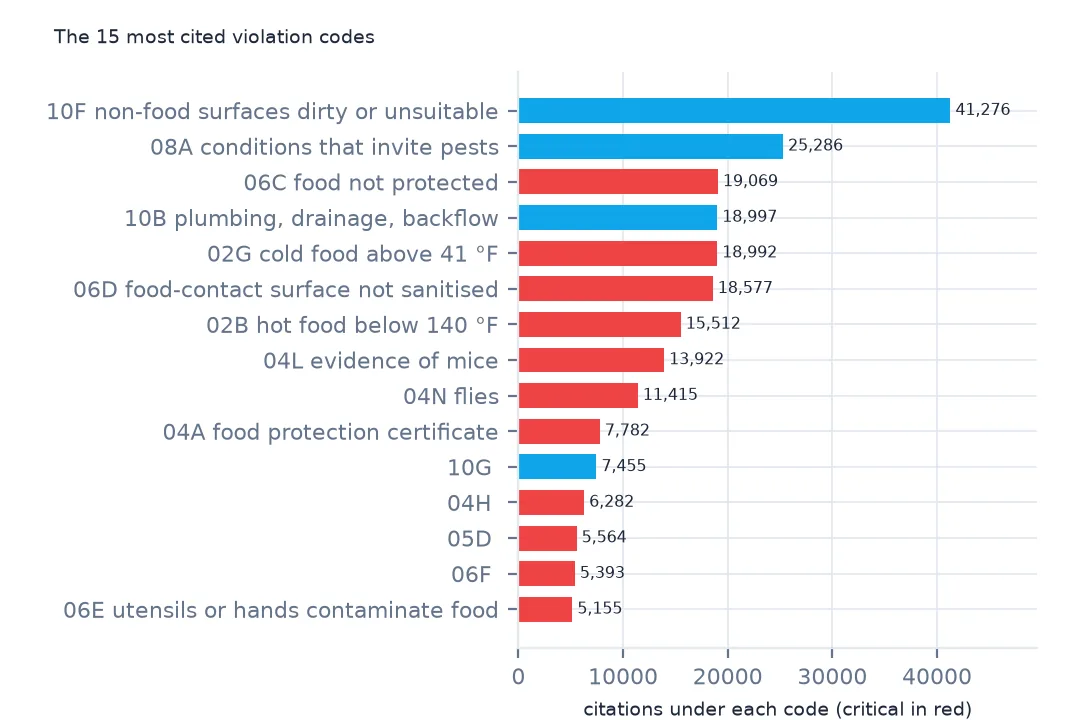
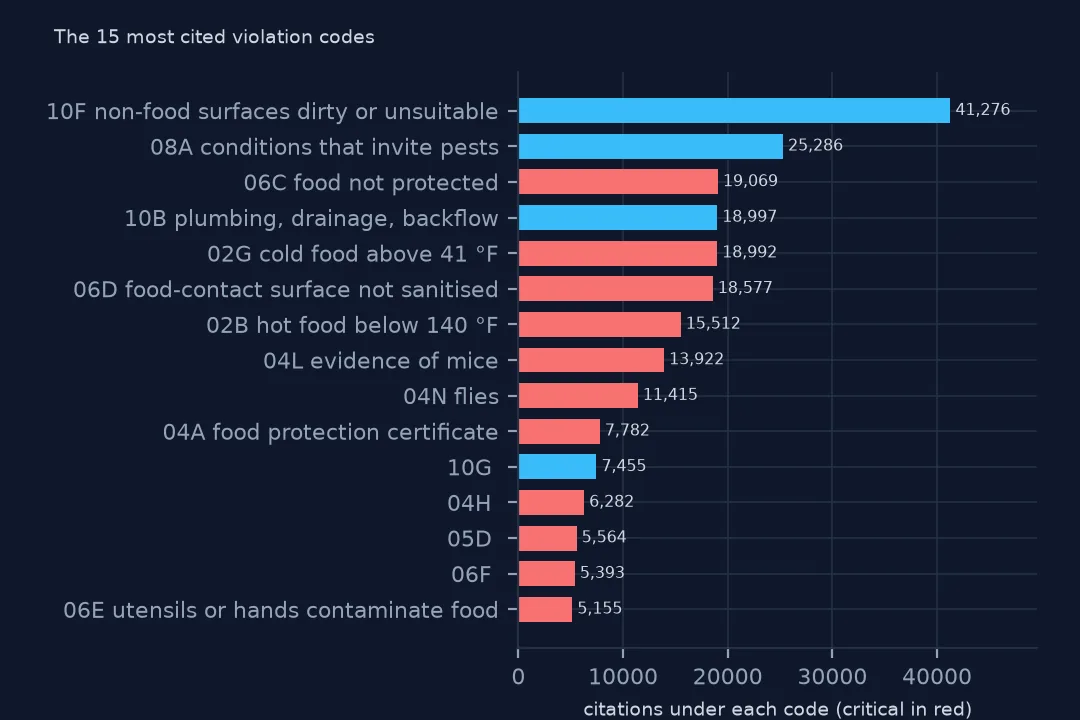
The file cites 289,605 violations under 147 codes. The top code, 10F, is about non-food-contact surfaces (40,765 citations under its current wording), ahead of conditions that invite pests (08A), cold food held above 41 °F (02G), plumbing (10B) and food-contact surfaces not sanitised (06D).
Critical flags, inspections and codes
1. Critical and not critical
print(v["CRITICAL FLAG"].value_counts().to_dict())
crit = v[v["CRITICAL FLAG"] == "Critical"].groupby("VIOLATION CODE").size().sort_values(ascending=False).head(5)
print("most common critical codes:", crit.to_dict())
{'Critical': 155250, 'Not Critical': 132526, 'Not Applicable': 1829}
most common critical codes: {'06C': 19069, '02G': 18992, '06D': 18577, '02B': 15512, '04L': 13922}
155,250 violations are critical and 132,526 not. The commonest critical ones are food not protected from contamination (06C), cold-holding temperatures (02G), unsanitised food-contact surfaces (06D), hot-holding temperatures (02B) and mice (04L, 13,922).
2. Per inspection, not per row
ins = v.drop_duplicates(["CAMIS", "INSPECTION DATE", "INSPECTION TYPE"])
per_ins = v.groupby(["CAMIS", "INSPECTION DATE", "INSPECTION TYPE"]).size()
print(f"inspections with a violation: {len(ins):,}; violations per inspection: median {per_ins.median():.0f}, most {per_ins.max()}")
share = v.drop_duplicates(["CAMIS", "INSPECTION DATE", "VIOLATION CODE"]).groupby("VIOLATION CODE").size() / len(ins)
print("share of inspections citing:", share.sort_values(ascending=False).head(4).round(3).to_dict())
inspections with a violation: 90,312; violations per inspection: median 3, most 24
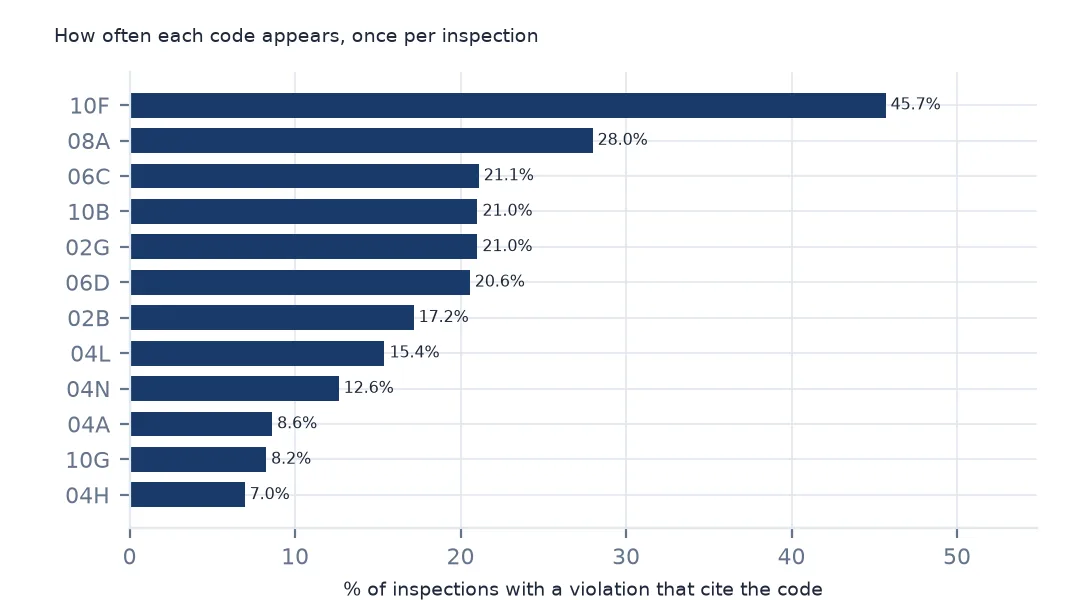
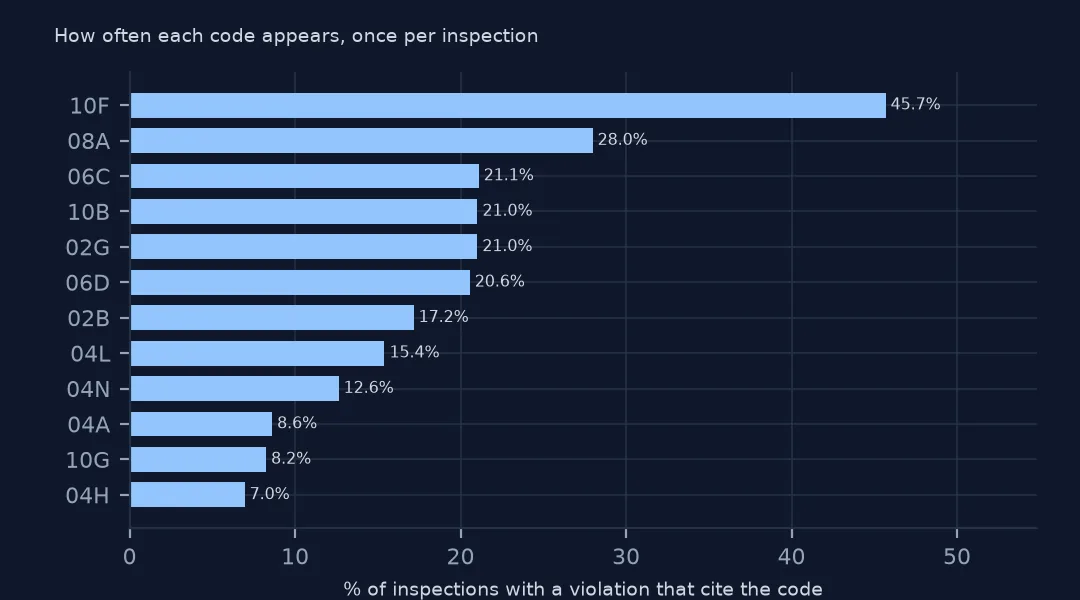
share of inspections citing: {'10F': 0.457, '08A': 0.28, '06C': 0.211, '10B': 0.21}
90,312 inspections cited at least one violation, with a median of 3 and a maximum of 24. Counted once per inspection, 10F appears at 45.7% of them, pest-conducive conditions (08A) at 28.0%, and contamination (06C) and plumbing (10B) at about 21% each.
3. Codes change over time
v["prefix"] = v["VIOLATION CODE"].str[:2]
print(v.groupby([v.date.dt.year, "prefix"]).size().unstack(fill_value=0).loc[2023:, ["02", "04", "06", "08", "10"]].to_string())
prefix 02 04 06 08 10
date
2023 4954 7950 7224 4833 10401
2024 9891 13959 14087 8749 20355
2025 11457 14578 15919 8998 22954
2026 10696 12742 15421 8030 20821
By code family, maintenance (10) leads every year, followed by contamination (06) and pests (04). The rise from 2023 to 2025 is the file's three-year window filling up, not a rise in violations.
Cuisines and temperatures
The data used on this page
New York City Department of Health and Mental Hygiene restaurant inspection results from NYC Open Data, saved on this site on 16 October 2026.
from pathlib import Path

import geopandas as gpd
import numpy as np
import pandas as pd
import requests
from shapely import wkt

Path("data").mkdir(exist_ok=True)
# NYC Department of Health and Mental Hygiene (DOHMH) restaurant inspection results (NYC Open Data, dataset 43nn-pn8j),
# downloaded on 16 October 2026 and saved on this site (xz-compressed, unchanged), because the city replaces it daily.
# Live: https://data.cityofnewyork.us/api/views/43nn-pn8j/rows.csv?accessType=DOWNLOAD
# Also NYC 2020 Neighborhood Tabulation Areas (dataset 9nt8-h7nd), saved on 15 October 2026.
FILES = ["nyc-restaurant-inspections-2026-10-16-v2.csv.xz", "nyc-nta-2020-2026-10-15.zip"]
for name in FILES:
    if not Path(f"data/{name}").exists():
        Path(f"data/{name}").write_bytes(requests.get(f"https://data.spatialworkflow.io/{name}", timeout=600).content)
insp = pd.read_csv("data/nyc-restaurant-inspections-2026-10-16-v2.csv.xz", dtype=str)
insp["date"] = pd.to_datetime(insp["INSPECTION DATE"], format="%m/%d/%Y")
insp["SCORE"] = pd.to_numeric(insp.SCORE)
insp["lat"], insp["lon"] = pd.to_numeric(insp.Latitude), pd.to_numeric(insp.Longitude)
print(f"DOHMH inspections file: {len(insp):,} rows for {insp.CAMIS.nunique():,} restaurants")
DOHMH inspections file: 296,514 rows for 31,531 restaurants
Example 1: by cuisine
cu = v.drop_duplicates(["CAMIS", "INSPECTION DATE", "VIOLATION CODE"])
c = cu.groupby("CUISINE DESCRIPTION").agg(cites=("CAMIS", "size"), restaurants=("CAMIS", "nunique"))
print((c.cites / c.restaurants)[c.restaurants >= 300].sort_values(ascending=False).round(1).head(5).to_dict())
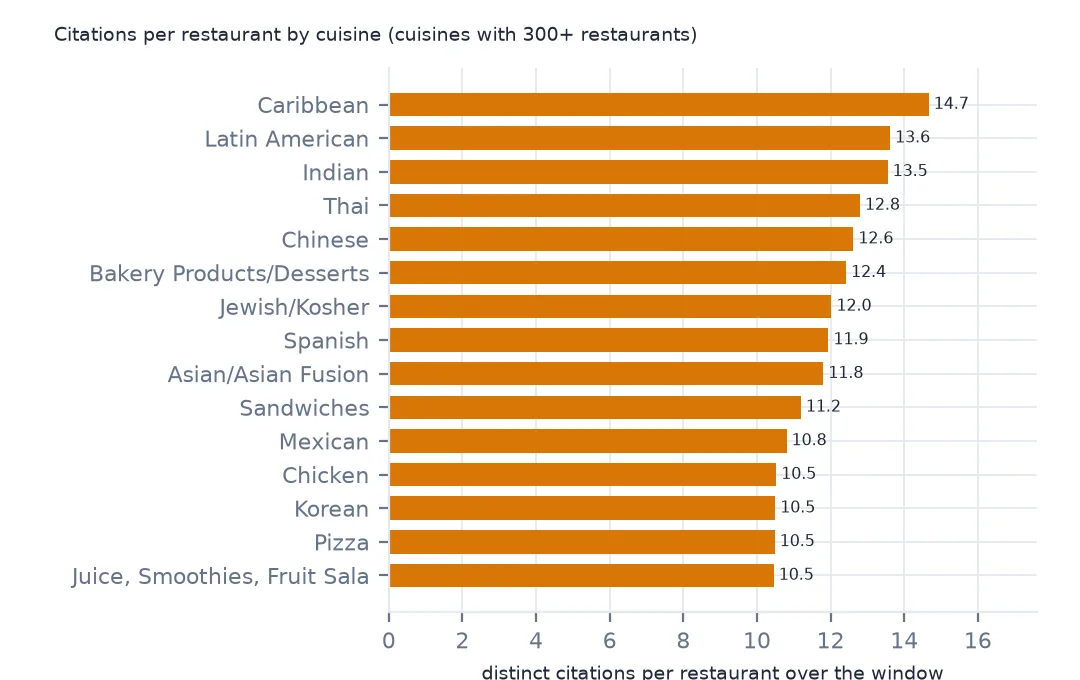
{'Caribbean': 14.7, 'Latin American': 13.6, 'Indian': 13.5, 'Thai': 12.8, 'Chinese': 12.6}
Among cuisines with enough restaurants to compare, Caribbean restaurants collect the most distinct citations per restaurant (14.7 over the window), then Latin American, Indian, Thai and Chinese. Restaurants with more complex hot and cold holding and more ingredients have more to cite, so this is not a ranking of safety.
Example 2: temperature violations
temp = v[v["VIOLATION DESCRIPTION"].str.contains("°F", na=False)]
print(f"temperature violations: {len(temp):,}; by code: {temp['VIOLATION CODE'].value_counts().head(4).to_dict()}")
temperature violations: 37,225; by code: {'02G': 18821, '02B': 15379, '02H': 2610, '02A': 245}
37,225 violations mention a temperature, mostly cold-holding (02G, 18,821) and hot-holding (02B, 15,379). Temperature control is the single biggest group of critical problems.
How violations are scored
Each violation code has points, and critical violations, the ones most likely to cause foodborne illness, carry more: food held at the wrong temperature, contamination, pests in food areas. Non-critical violations are mostly about maintenance: surfaces, plumbing, lighting. The inspection score is the sum of the points, so two inspections with the same score can mean a few serious problems or many small ones. Ranking codes by frequency answers "what goes wrong most", not "what matters most".
Counting pitfalls
- Count per inspection when comparing codes; some codes are cited more than once at the same inspection.
- Codes differ in kind. Some, such as
28-06, are administrative rather than food-safety findings; check a code's description before ranking it. - Descriptions are long; group by code and look descriptions up afterwards.
- Cuisine comparisons need a minimum number of restaurants and say nothing about individual places.
Internal links
- How to analyse NYC restaurant inspection results — the file and its fields
- Restaurant inspection counts too high — one row per violation
- How to map mice, rats and roaches — pests by neighbourhood
FAQ
What is the most common restaurant health code violation in New York?
Code 10F, a non-food-contact surface or piece of equipment not clean or properly made, cited at 45.7% of inspections with a violation.
What is a critical violation?
One that is more likely to contribute to foodborne illness, such as food held at the wrong temperature or evidence of mice. 155,250 of the cited violations are critical.