
Restaurant Inspections Dated 1 January 1900: New Places Not Yet Inspected
On this page
Problem statement
Parse the inspection dates in New York's restaurant data and the range starts in 1900. 3,900 rows carry 1 January 1900, one per restaurant, and nothing else: no violation, score, grade or inspection type. They are not historical records. They are restaurants that have a permit but have not been inspected yet, with a placeholder date. Left in, they stretch every timeline back more than a century, add a spike to any chart by year and inflate restaurant counts. This page finds them and filters them out.
Quick answer
Drop rows whose INSPECTION DATE is 01/01/1900 (or parsed year 1900) before any analysis of inspections. Keep them only if you want to count restaurants awaiting a first inspection.
z = insp[insp.date.dt.year == 1900]
print(f"rows dated 1900-01-01: {len(z):,} for {z.CAMIS.nunique():,} restaurants")
print(f"naive date range: {insp.date.min():%Y-%m-%d} to {insp.date.max():%Y-%m-%d}")
rows dated 1900-01-01: 3,900 for 3,900 restaurants
naive date range: 1900-01-01 to 2026-10-14
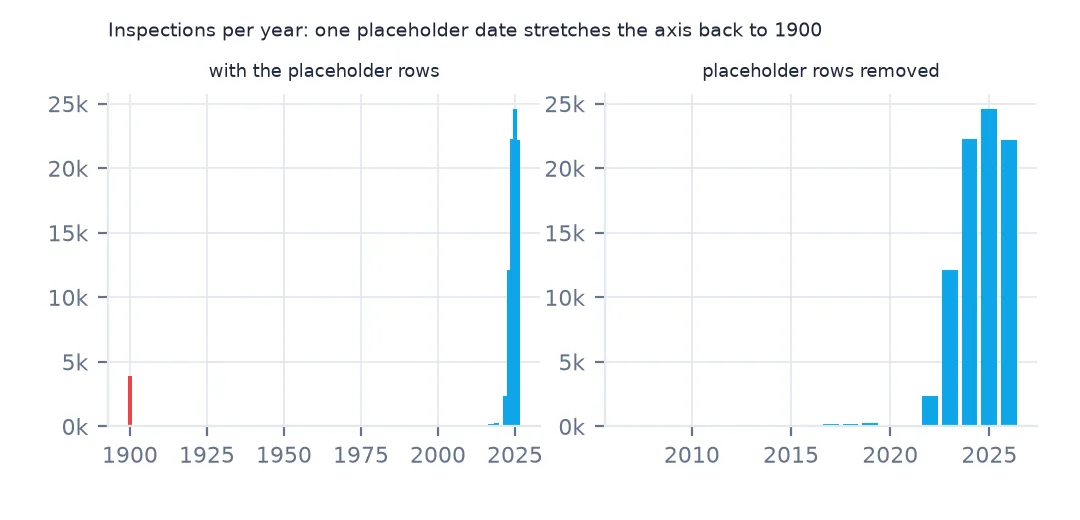
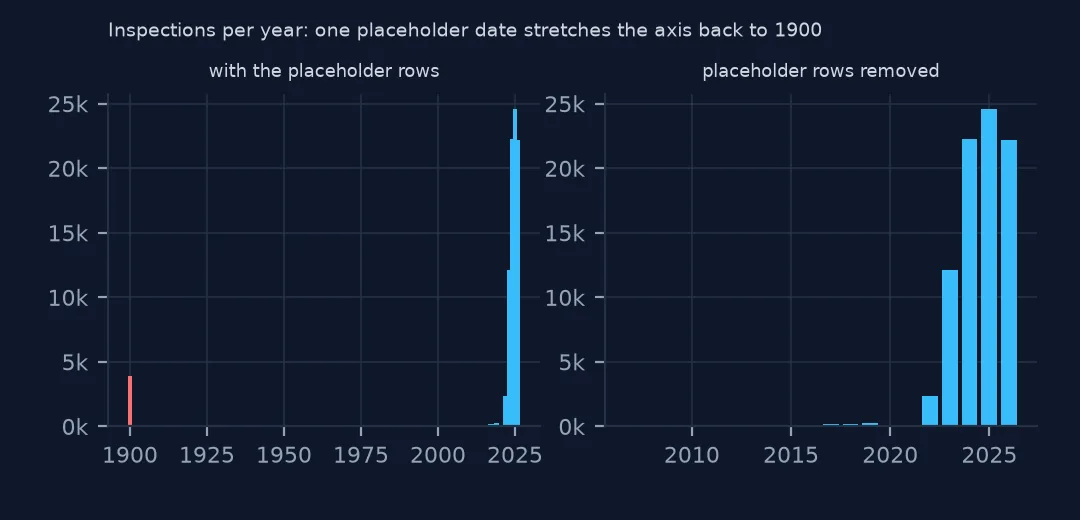
3,900 rows are dated 1 January 1900, one each for 3,900 restaurants. With them the date range starts in 1900, and without them in 2007.
Finding and removing the placeholder
1. What the rows contain
print(z[["CAMIS", "DBA", "BORO", "ACTION", "VIOLATION CODE", "SCORE", "GRADE", "INSPECTION TYPE"]].head(3).to_string(index=False))
print("non-empty fields:", {c: int(z[c].notna().sum()) for c in ["ACTION", "VIOLATION CODE", "SCORE", "GRADE", "INSPECTION TYPE"]})
CAMIS DBA BORO ACTION VIOLATION CODE SCORE GRADE INSPECTION TYPE
50167120 STUDIO 345A Brooklyn NaN NaN NaN NaN NaN
50136812 GUEST NEW YORK Manhattan NaN NaN NaN NaN NaN
50189557 LIGHT SWITCH CAFE Brooklyn NaN NaN NaN NaN NaN
non-empty fields: {'ACTION': 0, 'VIOLATION CODE': 0, 'SCORE': 0, 'GRADE': 0, 'INSPECTION TYPE': 0}
The rows have a name and a borough but no action, violation, score, grade or inspection type, all five empty on every one. Studio 345A in Brooklyn and Guest New York in Manhattan are new places with a permit and no visit yet.
2. They are restaurants with no inspection yet
other = insp[insp.date.dt.year > 1900]
print(f"of those restaurants, any real inspection in the file: {z.CAMIS.isin(other.CAMIS).mean():.1%}")
print("cuisine filled in:", f"{z['CUISINE DESCRIPTION'].notna().mean():.1%}")
of those restaurants, any real inspection in the file: 0.0%
cuisine filled in: 0.0%
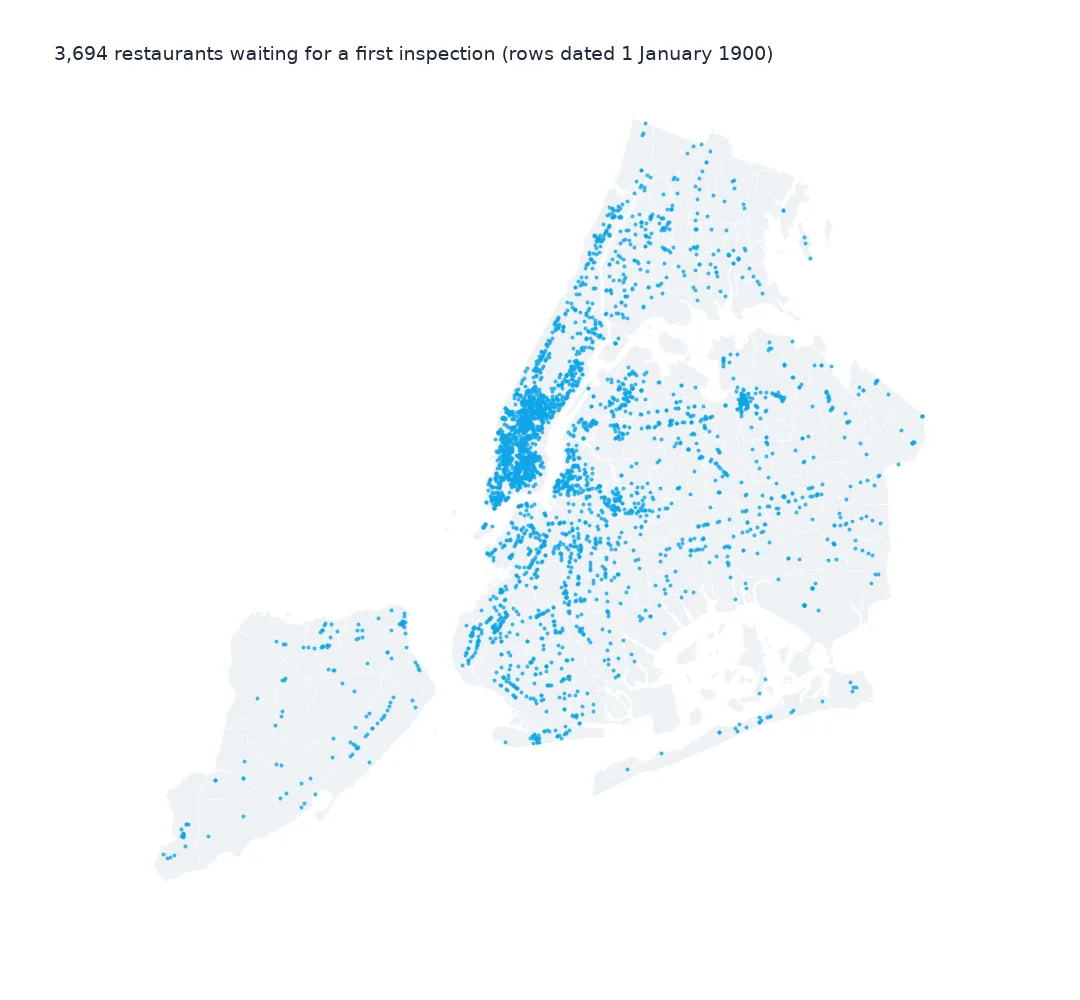
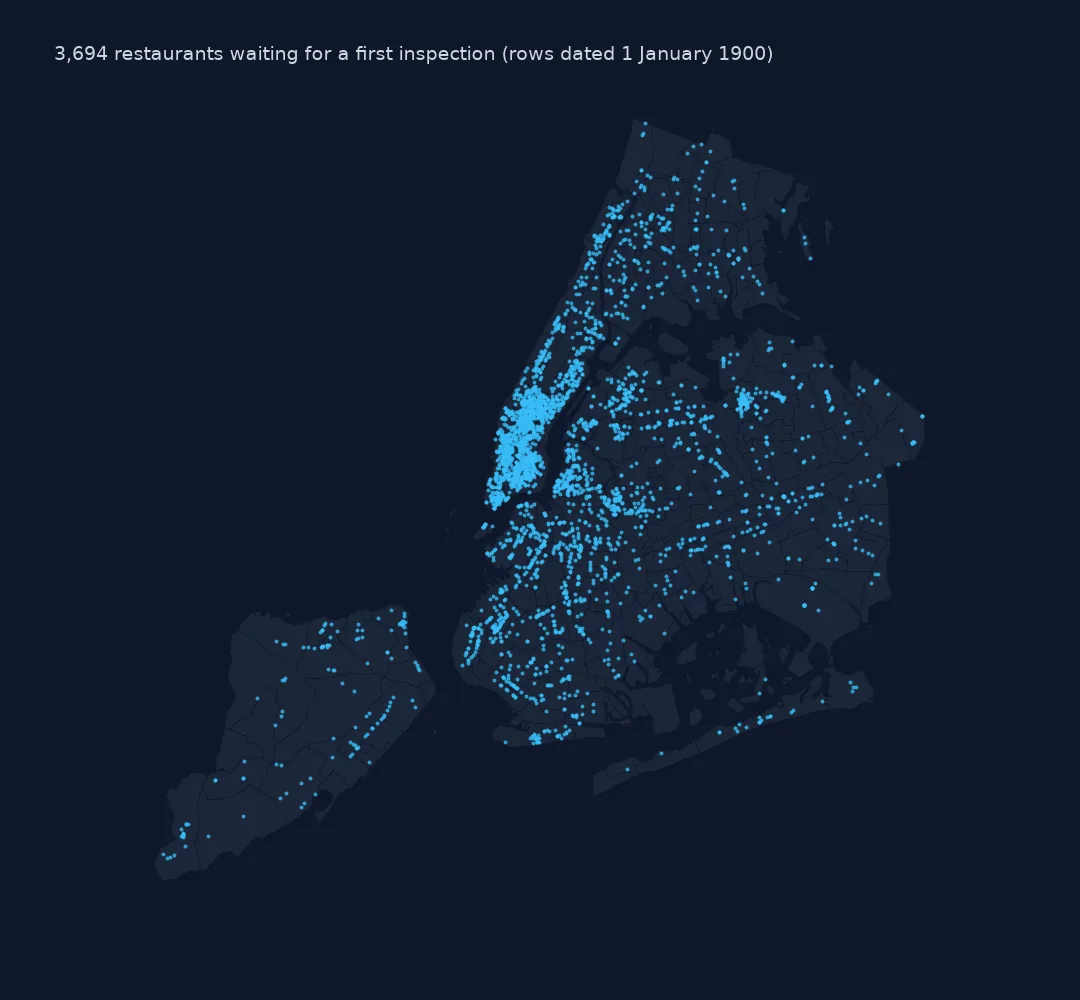
None of these restaurants has a real inspection anywhere in the file, and none has a cuisine yet. The 1900 row is their only row.
3. Filter them out
real = insp[insp.date > "1900-01-01"]
print(f"after filtering: {len(real):,} rows, {real.date.min():%Y-%m-%d} to {real.date.max():%Y-%m-%d}")
after filtering: 292,614 rows, 2007-08-10 to 2026-10-14
Filtering leaves 292,614 rows from 2007 to 2026, all real inspections.
Charts and counts
The data used on this page
New York City Department of Health and Mental Hygiene restaurant inspection results from NYC Open Data, saved on this site on 16 October 2026.
from pathlib import Path

import geopandas as gpd
import numpy as np
import pandas as pd
import requests
from shapely import wkt

Path("data").mkdir(exist_ok=True)
# NYC Department of Health and Mental Hygiene (DOHMH) restaurant inspection results (NYC Open Data, dataset 43nn-pn8j),
# downloaded on 16 October 2026 and saved on this site (xz-compressed, unchanged), because the city replaces it daily.
# Live: https://data.cityofnewyork.us/api/views/43nn-pn8j/rows.csv?accessType=DOWNLOAD
# Also NYC 2020 Neighborhood Tabulation Areas (dataset 9nt8-h7nd), saved on 15 October 2026.
FILES = ["nyc-restaurant-inspections-2026-10-16-v2.csv.xz", "nyc-nta-2020-2026-10-15.zip"]
for name in FILES:
    if not Path(f"data/{name}").exists():
        Path(f"data/{name}").write_bytes(requests.get(f"https://data.spatialworkflow.io/{name}", timeout=600).content)
insp = pd.read_csv("data/nyc-restaurant-inspections-2026-10-16-v2.csv.xz", dtype=str)
insp["date"] = pd.to_datetime(insp["INSPECTION DATE"], format="%m/%d/%Y")
insp["SCORE"] = pd.to_numeric(insp.SCORE)
insp["lat"], insp["lon"] = pd.to_numeric(insp.Latitude), pd.to_numeric(insp.Longitude)
print(f"DOHMH inspections file: {len(insp):,} rows for {insp.CAMIS.nunique():,} restaurants")
DOHMH inspections file: 296,514 rows for 31,531 restaurants
Example 1: what the placeholder does to a monthly chart
m = insp.drop_duplicates(["CAMIS", "INSPECTION DATE"]).groupby(insp.date.dt.to_period("Y")).size()
print("inspections by year, naive:", {str(k): v for k, v in m.items() if str(k) in ("1900", "2024", "2025")})
inspections by year, naive: {'1900': 3900, '2024': 22251, '2025': 24555}
In a chart of inspections by year, the placeholder adds 3,900 to the year 1900, a bar a sixth the height of 2025's 24,555. On a time axis it squashes 2007–2026 into a sliver at the right edge.
Example 2: counting restaurants
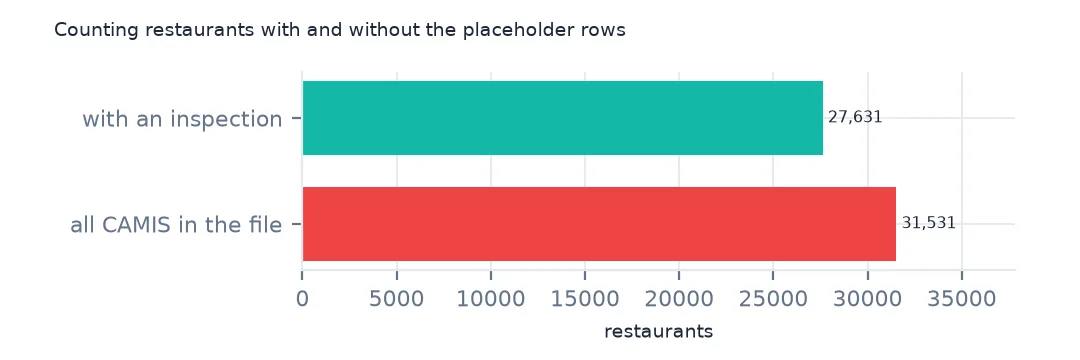
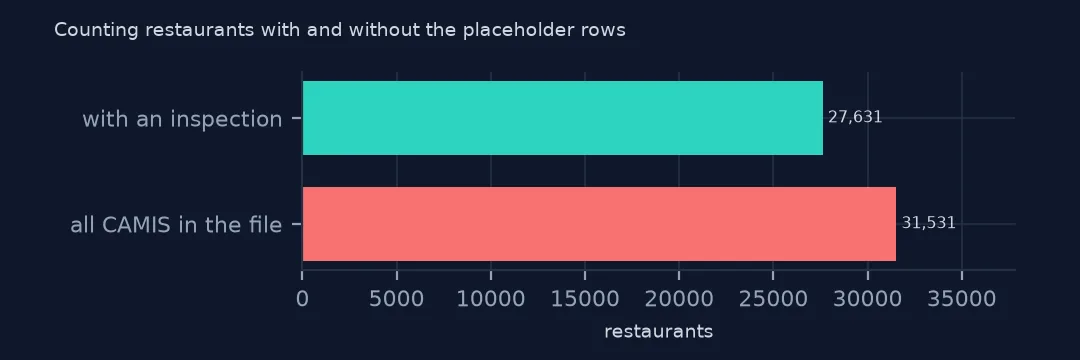
print(f"restaurants in the file: {insp.CAMIS.nunique():,}; with at least one inspection: {real.CAMIS.nunique():,}")restaurants in the file: 31,531; with at least one inspection: 27,631
The file lists 31,531 restaurants but only 27,631 have been inspected. Counting CAMIS without filtering overstates inspected restaurants by 3,900.
Why a placeholder date
The dataset is built from a join of restaurants and their inspections. A restaurant with no inspection yet still needs a row so that it appears in the city's lookup tools, and a date column cannot be empty in the source system, so it gets the earliest date the system accepts. Placeholder dates such as 1900-01-01 or 1970-01-01 are common in exports from such systems. Treat any implausibly early date as a sign of a missing value rather than an old record.
Similar placeholders
- Grade dates can also be empty for the same restaurants; check
GRADE DATEseparately. - Excel reads 1900-01-01 as day 1 of its calendar, so the value survives spreadsheet round trips.
- Filtering on year < 2000 is safer than an exact match if other placeholders appear.
- These restaurants matter for questions about new openings: 3,900 places were waiting for an inspection.
Internal links
- How to analyse NYC restaurant inspection results — the file and its fields
- Why restaurant inspection data only shows restaurants still open — what the file leaves out
- Restaurant inspection counts too high — one row per violation
FAQ
Why does NYC restaurant inspection data have dates in 1900?
Restaurants that have not been inspected yet get the placeholder date 1 January 1900; 3,900 rows in the October 2026 file carry it, with no other inspection data.
How do I remove placeholder dates in pandas?
Parse the column and filter it: insp[insp.date > "1900-01-01"]. Here that leaves 292,614 rows from 2007 to 2026.