
How to Map Mice, Rats and Roaches in Restaurant Inspections
On this page
Problem statement
Mice, rats, roaches and flies are among the violations New York's restaurant inspectors cite most, and the ones diners care about most. Each has its own code (04L mice, 04K rats, 04M roaches, 04N flies), so mapping them by neighbourhood is a matter of flagging inspections and joining them to boundaries. This page measures how often initial cycle inspections since 2024 found each pest, maps the share by 2020 neighbourhood, and ranks the neighbourhoods with enough inspections to compare.
Quick answer
Flag each inspection that cites a pest code, keep initial cycle inspections with a position, join them to 2020 NTA polygons, and compute the share of inspections citing each pest per neighbourhood. Report shares, not counts, and only for neighbourhoods with enough inspections.
ins = insp[insp.date.dt.year > 1900].drop_duplicates(["CAMIS", "INSPECTION DATE", "INSPECTION TYPE"])
cyc = ins[ins["INSPECTION TYPE"].str.contains("Cycle Inspection / Initial") & (ins.date >= "2024-01-01") & (ins.lat > 0)]
pest = {"04L": "mice", "04K": "rats", "04M": "roaches", "04N": "flies"}
hit = insp[insp["VIOLATION CODE"].isin(pest)].drop_duplicates(["CAMIS", "INSPECTION DATE", "VIOLATION CODE"])
for code, name in pest.items():
    k = hit[hit["VIOLATION CODE"] == code][["CAMIS", "INSPECTION DATE"]].assign(**{name: True})
    cyc = cyc.merge(k, on=["CAMIS", "INSPECTION DATE"], how="left")
cyc[list(pest.values())] = cyc[list(pest.values())].fillna(False).astype(bool)
print(f"initial cycle inspections since 2024: {len(cyc):,}; share citing:", cyc[list(pest.values())].mean().round(3).to_dict())
initial cycle inspections since 2024: 37,684; share citing: {'mice': 0.162, 'rats': 0.032, 'roaches': 0.059, 'flies': 0.135}
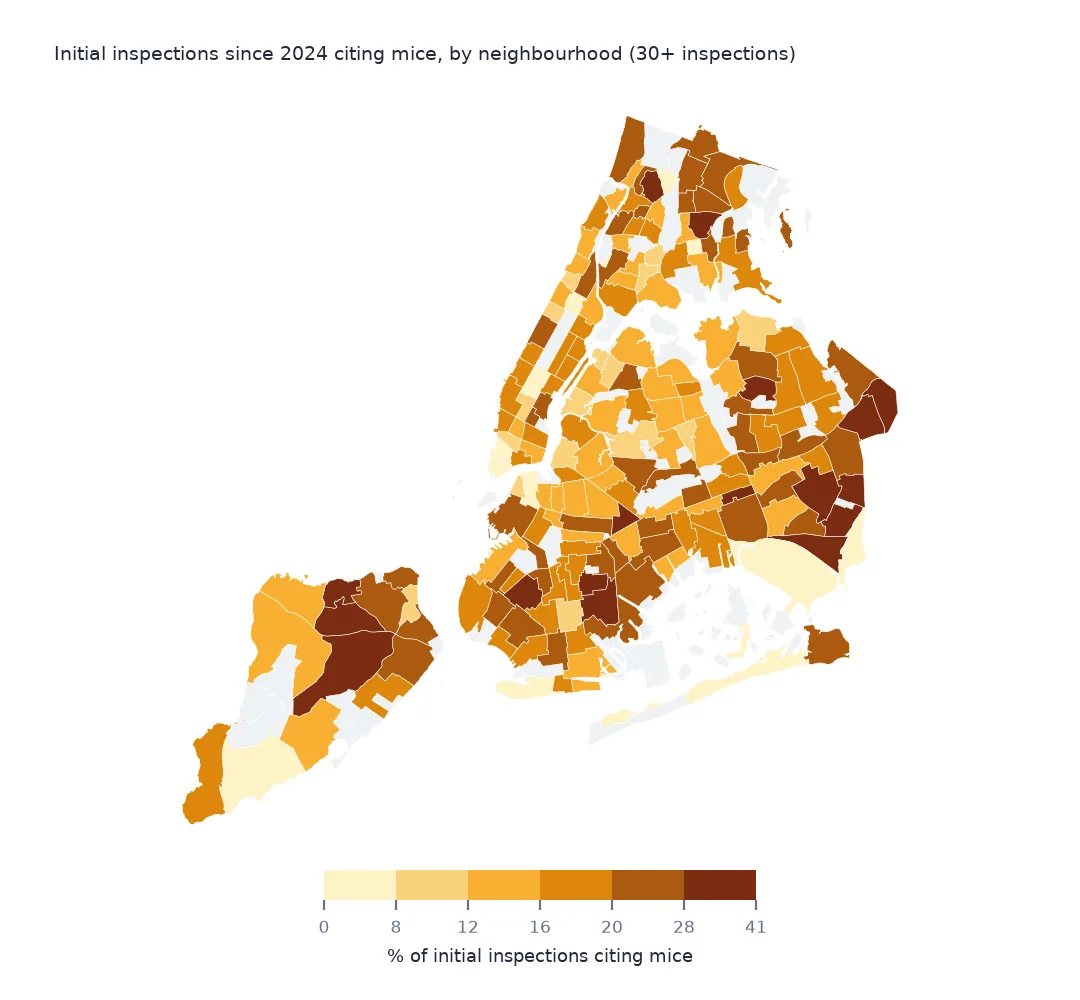
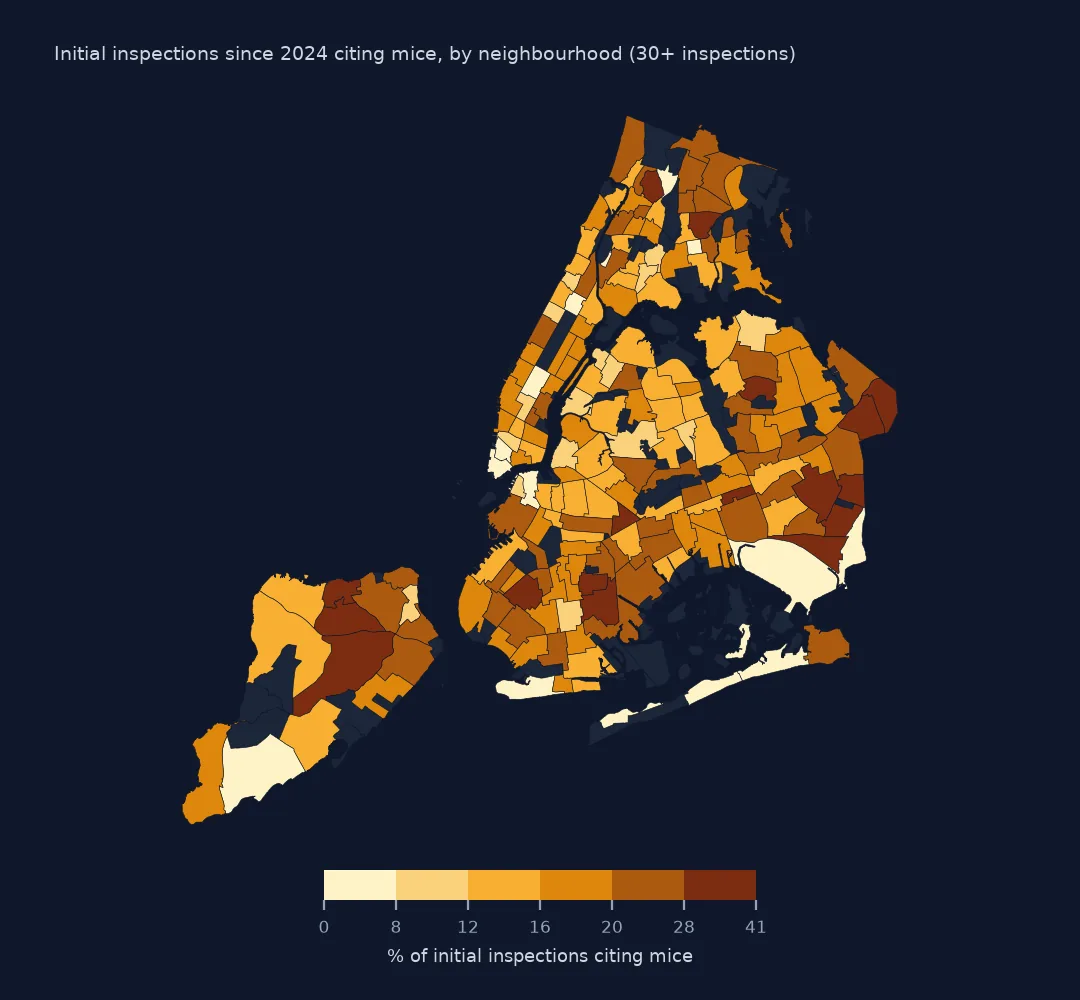
Of 37,684 initial cycle inspections since 2024, 16.2% cited mice, 13.5% flies, 5.9% roaches and 3.2% rats. Mice are by far the commonest pest found in New York kitchens.
Pest codes, neighbourhoods and rankings
1. Pest codes
print(insp[insp["VIOLATION CODE"].isin(pest)].drop_duplicates("VIOLATION CODE").set_index("VIOLATION CODE")["VIOLATION DESCRIPTION"].str[:80].to_dict()){'04L': "Evidence of mice or live mice in establishment's food or non-food areas.", '04M': "Live roaches in facility's food or non-food area.", '04N': 'Filth flies or food/refuse/sewage associated with (FRSA) flies or other nuisance', '04K': "Evidence of rats or live rats in establishment's food or non-food areas."}
Each code describes evidence of the pest anywhere in the establishment, in food or non-food areas. Flies include filth flies and other nuisance flies. The wording is broad, so a citation means signs were found, not that food was contaminated.
2. Join to neighbourhoods
pts = gpd.GeoDataFrame(cyc, geometry=gpd.points_from_xy(cyc.lon, cyc.lat), crs=4326).to_crs(2263)
j = gpd.sjoin(pts, nta[["NTA2020", "NTAName", "BoroName", "geometry"]], predicate="within")
per = j.groupby(["NTA2020", "NTAName", "BoroName"]).agg(n=("mice", "size"), mice=("mice", "mean"), rats=("rats", "mean"), roaches=("roaches", "mean")).reset_index()
print(f"neighbourhoods with 30 or more inspections: {(per.n >= 30).sum()}")
neighbourhoods with 30 or more inspections: 191
191 neighbourhoods have at least 30 initial inspections since 2024, enough for a share to mean something.
3. Rank the neighbourhoods
ok = per[per.n >= 30]
for c in ("mice", "rats", "roaches"):
    t = ok.sort_values(c, ascending=False).head(2)
    print(c, [(r["NTAName"], r["BoroName"], round(r[c], 3)) for _, r in t.iterrows()])
mice [('Cambria Heights', 'Queens', 0.4), ('South Richmond Hill', 'Queens', 0.396)]
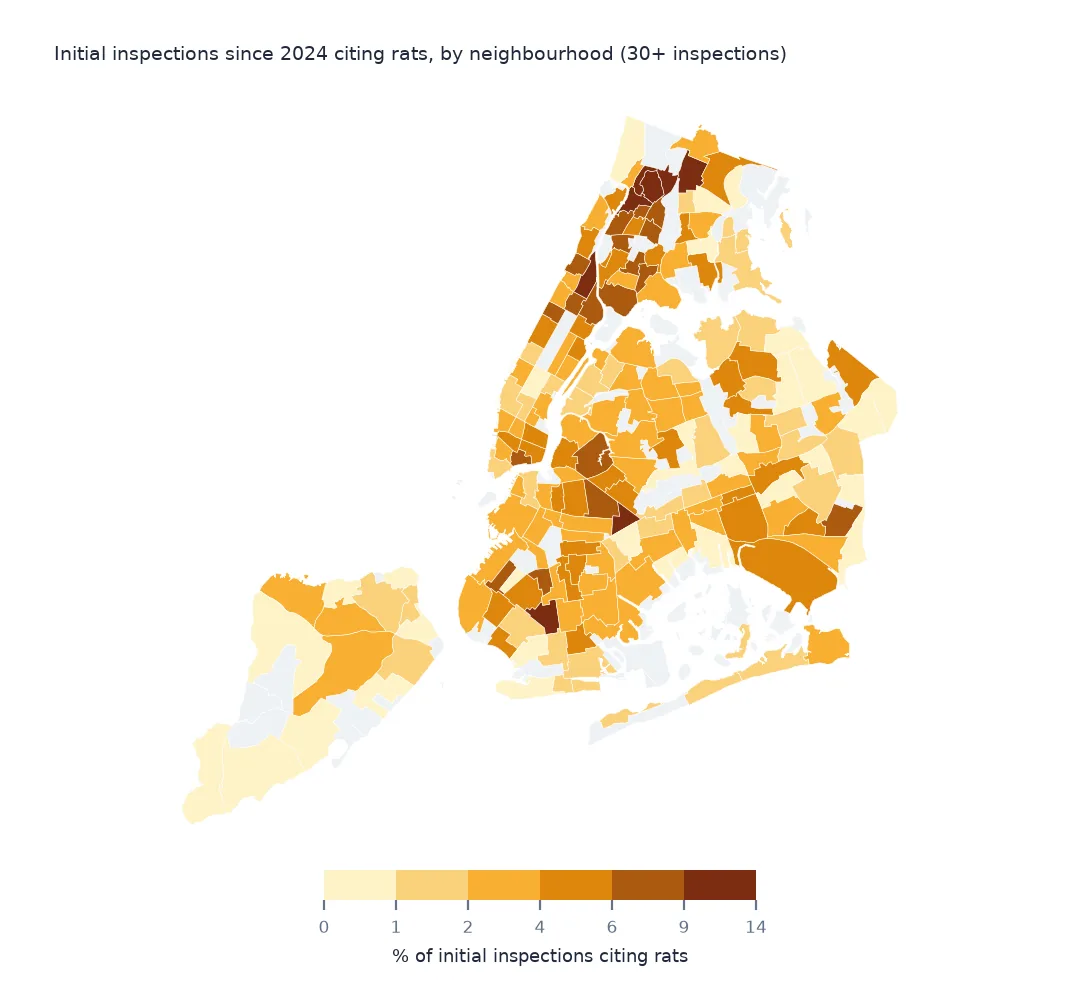
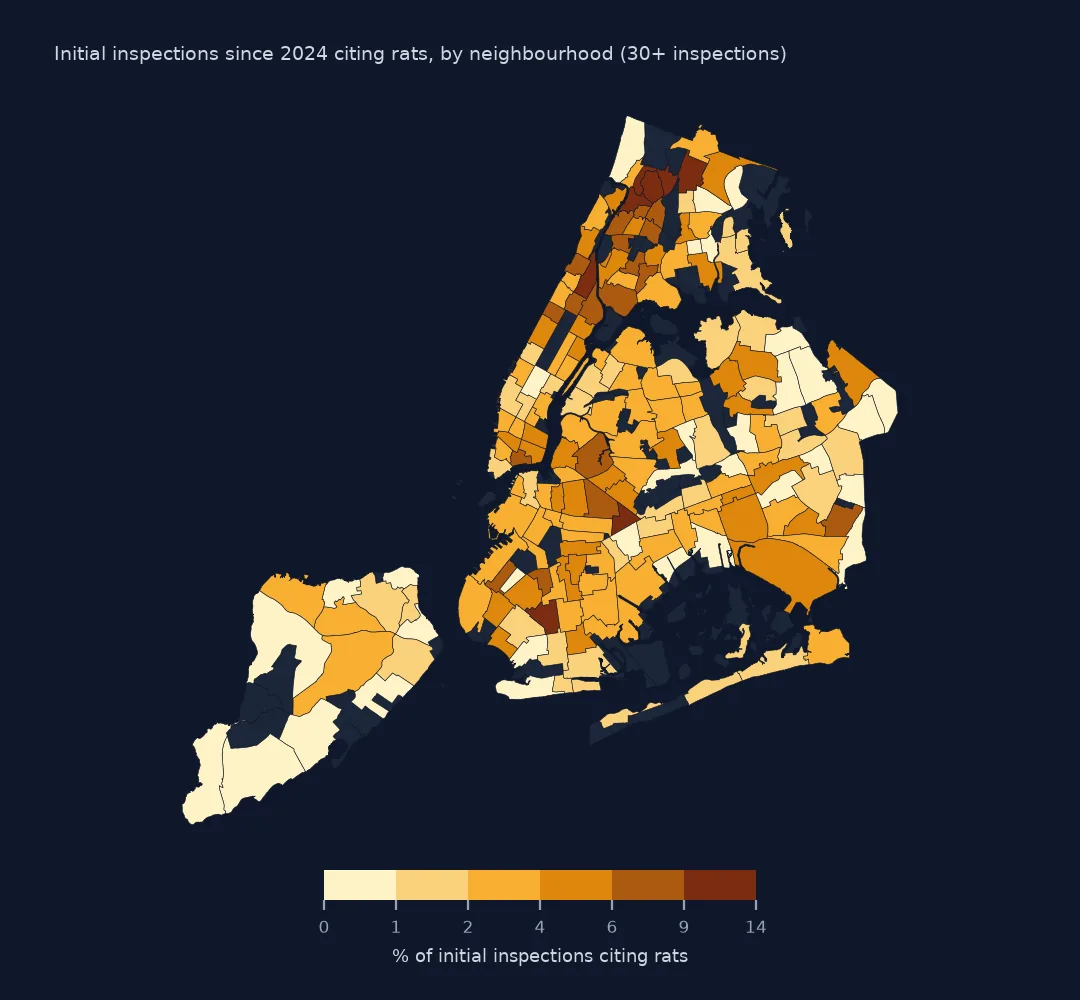
rats [('Kingsbridge Heights-Van Cortlandt Village', 'Bronx', 0.132), ('Williamsbridge-Olinville', 'Bronx', 0.127)]
roaches [('Ozone Park (North)', 'Queens', 0.176), ('Jamaica', 'Queens', 0.146)]
Mice were cited at 40.0% of inspections in Cambria Heights and 39.6% in South Richmond Hill, both in Queens. Rats are commonest in the north Bronx (Kingsbridge Heights 13.2%, Williamsbridge 12.7%), and roaches in Ozone Park and Jamaica, Queens. Each pest has its own geography.
Boroughs and pests together
The data used on this page
New York City Department of Health and Mental Hygiene restaurant inspection results from NYC Open Data, saved on this site on 16 October 2026, and the city's 2020 Neighborhood Tabulation Areas.
from pathlib import Path

import geopandas as gpd
import numpy as np
import pandas as pd
import requests
from shapely import wkt

Path("data").mkdir(exist_ok=True)
# NYC Department of Health and Mental Hygiene (DOHMH) restaurant inspection results (NYC Open Data, dataset 43nn-pn8j),
# downloaded on 16 October 2026 and saved on this site (xz-compressed, unchanged), because the city replaces it daily.
# Live: https://data.cityofnewyork.us/api/views/43nn-pn8j/rows.csv?accessType=DOWNLOAD
# Also NYC 2020 Neighborhood Tabulation Areas (dataset 9nt8-h7nd), saved on 15 October 2026.
FILES = ["nyc-restaurant-inspections-2026-10-16-v2.csv.xz", "nyc-nta-2020-2026-10-15.zip"]
for name in FILES:
    if not Path(f"data/{name}").exists():
        Path(f"data/{name}").write_bytes(requests.get(f"https://data.spatialworkflow.io/{name}", timeout=600).content)
insp = pd.read_csv("data/nyc-restaurant-inspections-2026-10-16-v2.csv.xz", dtype=str)
insp["date"] = pd.to_datetime(insp["INSPECTION DATE"], format="%m/%d/%Y")
insp["SCORE"] = pd.to_numeric(insp.SCORE)
insp["lat"], insp["lon"] = pd.to_numeric(insp.Latitude), pd.to_numeric(insp.Longitude)
n = pd.read_csv("data/nyc-nta-2020-2026-10-15.zip")
nta = gpd.GeoDataFrame(n.drop(columns="the_geom"), geometry=n.the_geom.map(wkt.loads), crs=4326).to_crs(2263)
print(f"DOHMH inspections file: {len(insp):,} rows for {insp.CAMIS.nunique():,} restaurants")
DOHMH inspections file: 296,514 rows for 31,531 restaurants
Example 1: by borough
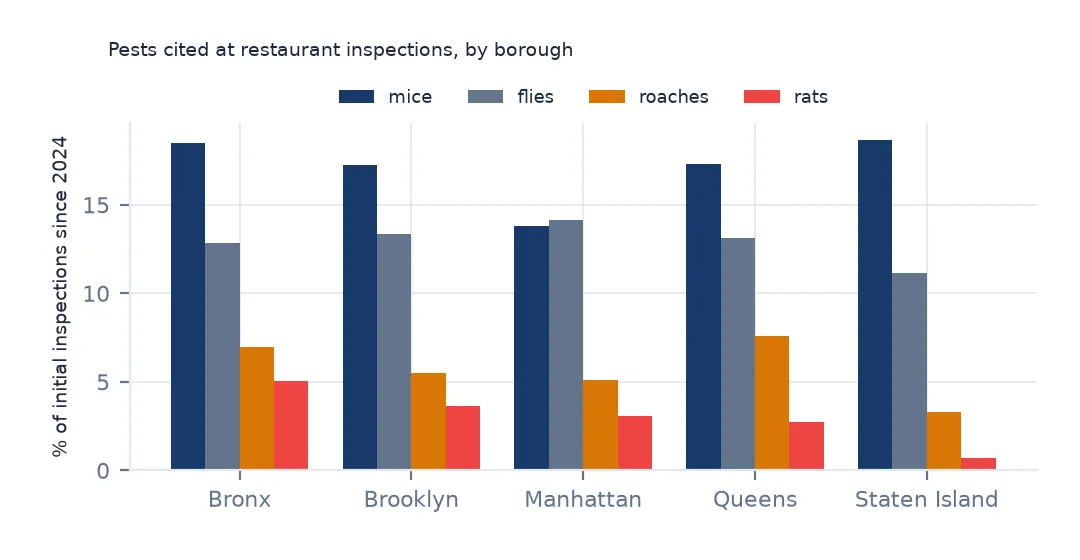
print(j.groupby("BoroName")[["mice", "rats", "roaches"]].mean().round(3).to_string()) mice rats roaches
BoroName
Bronx 0.185 0.050 0.070
Brooklyn 0.173 0.036 0.055
Manhattan 0.138 0.031 0.051
Queens 0.173 0.027 0.076
Staten Island 0.187 0.007 0.033
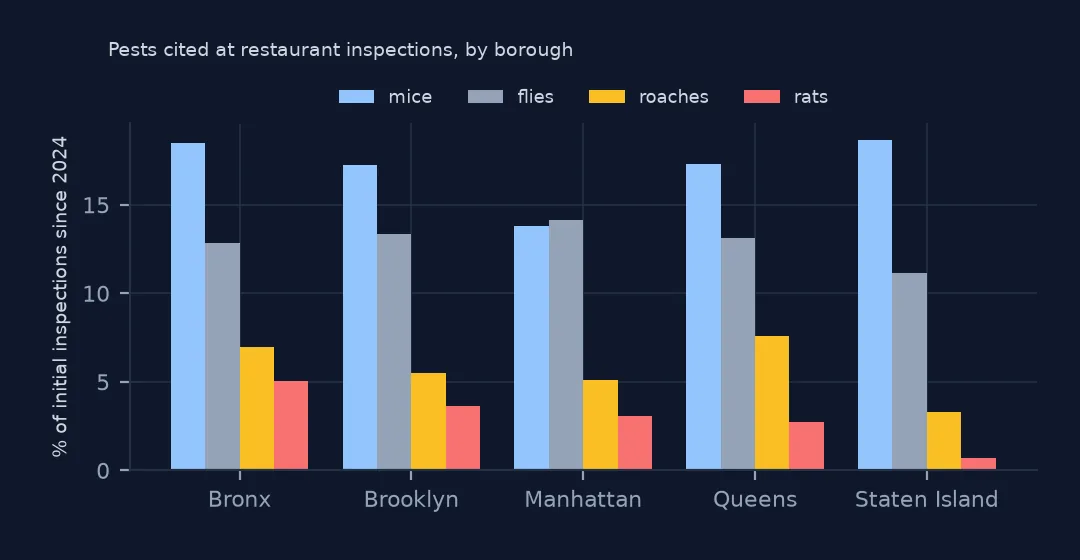
By borough, the Bronx has the most rats (5.0% of inspections) and Staten Island the fewest (0.7%), while mice are close to 17–19% everywhere except Manhattan (13.8%). Queens has the most roaches (7.6%).
Example 2: mice and roaches together
print(f"inspections citing both mice and roaches: {(cyc.mice & cyc.roaches).mean():.1%}; mice given roaches: {cyc[cyc.roaches].mice.mean():.1%}")inspections citing both mice and roaches: 1.6%; mice given roaches: 26.8%
1.6% of inspections cite both mice and roaches, and 26.8% of inspections with roaches also have mice, against 16.2% overall. Pests travel together, because the same conditions (food debris, gaps, moisture) invite all of them.
What a pest citation means
A pest violation records evidence (droppings, gnaw marks, live or dead animals) found during the inspection, in food or non-food areas. It reflects the building and the street as much as the kitchen: older buildings, shared walls, basement kitchens and nearby waste all make infestations more likely. Rats in particular follow sewers, parks and refuse, which is why their share varies more between neighbourhoods than that of mice. The map shows where inspectors found pests, a useful pointer for rodent control but not a measure of any one restaurant.
Pest map caveats
- Use initial inspections; re-inspections follow up the same problem and double-count it.
- Shares from 30 inspections have wide uncertainty. Show the count beside each share.
- Evidence is not infestation. Droppings count the same as live animals.
- Compare with the city's rodent complaints for a picture of the street outside.
Internal links
- How to rank the most common health code violations — what inspectors cite
- How to map restaurant inspection scores by neighbourhood — scores on a map
- How to find restaurants closed by the health department — closures
FAQ
How often do NYC restaurant inspections find mice?
16.2% of initial cycle inspections since 2024 cite evidence of mice, against 3.2% for rats and 5.9% for roaches.
Which NYC neighbourhood has the most restaurant mouse violations?
Among neighbourhoods with at least 30 initial inspections since 2024, Cambria Heights in Queens, at 40.0% of inspections.