
How to Map Restaurant Inspection Scores by Neighbourhood
On this page
Problem statement
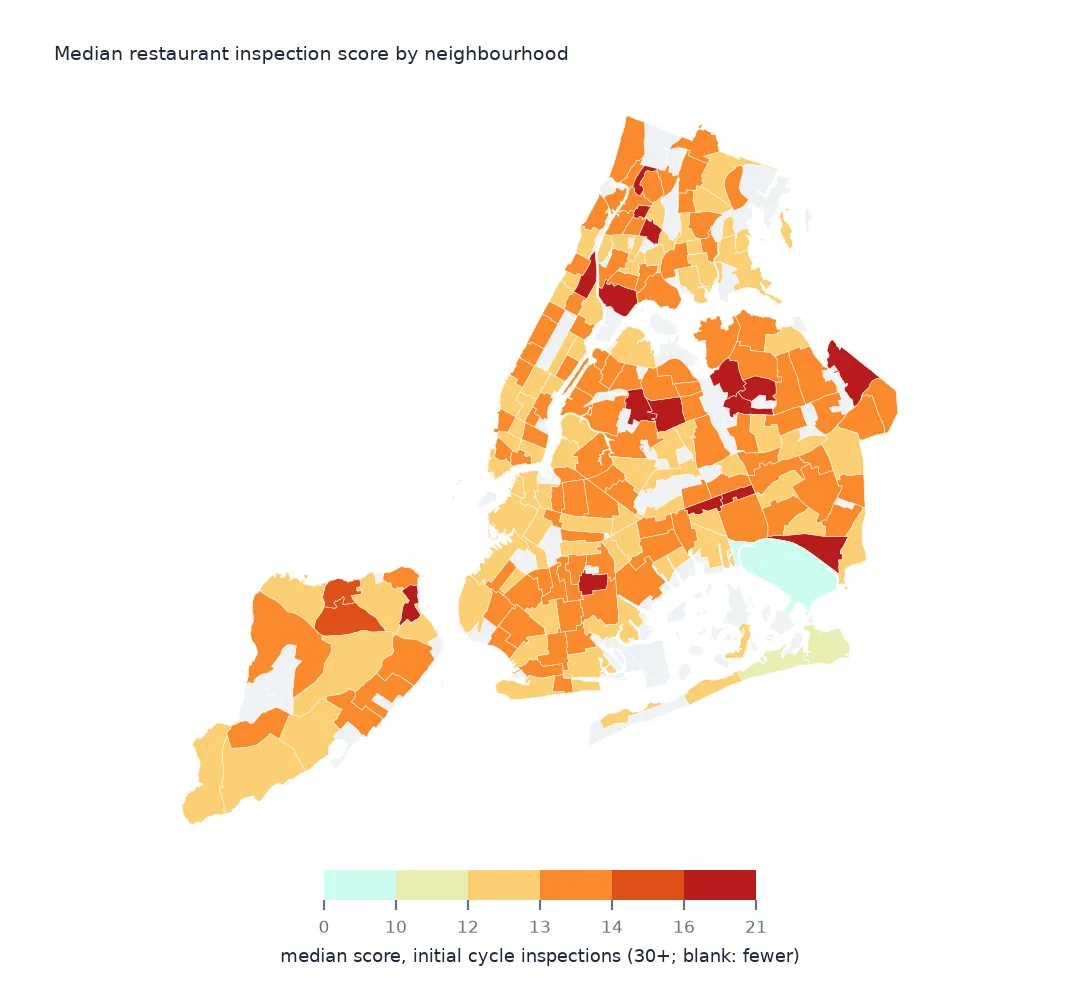
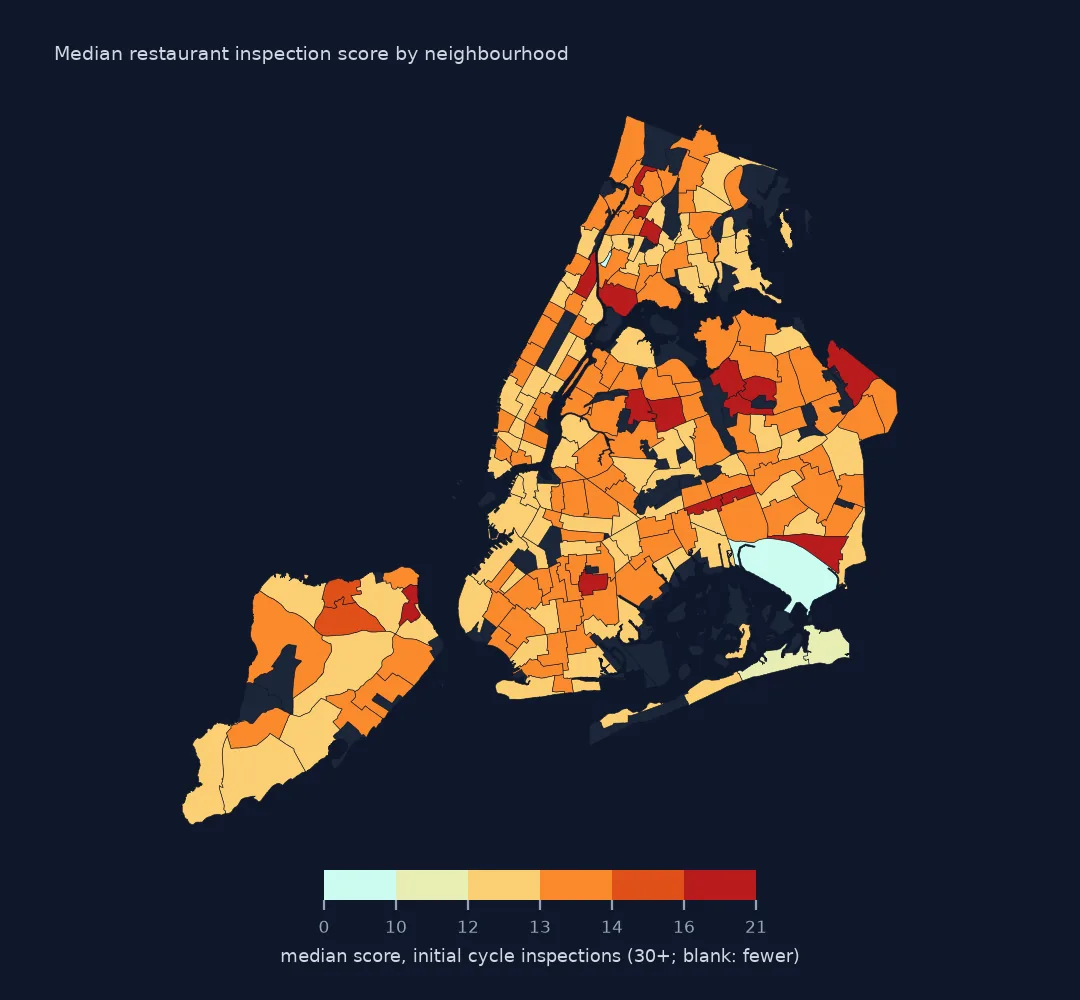
Which New York neighbourhoods have the cleanest restaurant kitchens, and which the worst? Mapping it means choosing a measure (score, grade or share of bad inspections), choosing which inspections count, and placing restaurants in neighbourhoods. The inspection file carries 2010 neighbourhood codes that match no current boundary, so the reliable route is a spatial join. This page maps the median score of initial cycle inspections across New York's 2020 Neighborhood Tabulation Areas and ranks the neighbourhoods with enough inspections to compare.
Quick answer
Keep initial cycle inspections with a score and a non-zero position, join their points to 2020 NTA polygons in a projected CRS, and take the median score per neighbourhood. Only compare neighbourhoods with enough inspections; 30 is used here.
ins = insp[insp.date.dt.year > 1900].drop_duplicates(["CAMIS", "INSPECTION DATE", "INSPECTION TYPE"])
r = ins[ins["INSPECTION TYPE"].str.contains("Cycle Inspection / Initial") & ins.SCORE.notna() & (ins.lat > 0)]
pts = gpd.GeoDataFrame(r, geometry=gpd.points_from_xy(r.lon, r.lat), crs=4326).to_crs(2263)
j = gpd.sjoin(pts, nta[["NTA2020", "NTAName", "BoroName", "geometry"]], predicate="within")
per = j.groupby(["NTA2020", "NTAName", "BoroName"]).agg(inspections=("SCORE", "size"), median_score=("SCORE", "median")).reset_index()
print(f"{len(r):,} initial cycle inspections; placed in an NTA: {len(j) / len(r):.1%}; NTAs with 30 or more: {(per.inspections >= 30).sum()}")
45,816 initial cycle inspections; placed in an NTA: 100.0%; NTAs with 30 or more: 198
45,816 initial cycle inspections have a score and a position, and all of them fall inside a 2020 neighbourhood. 198 neighbourhoods have 30 or more inspections to compare.
Choosing inspections and joining to neighbourhoods
1. Use initial inspections only
print(ins.groupby("INSPECTION TYPE").SCORE.agg(["median", "mean"]).loc[["Cycle Inspection / Initial Inspection", "Cycle Inspection / Re-inspection"]].round(1).to_string()) median mean
INSPECTION TYPE
Cycle Inspection / Initial Inspection 13.0 17.6
Cycle Inspection / Re-inspection 13.0 17.0
Initial inspections and re-inspections have the same median (13) and similar means (17.6 and 17.0). Mixing them still double-counts restaurants that failed a first visit, so keep to the initial ones.
2. Join points to 2020 neighbourhoods
print(f"restaurants carrying a 2010 NTA code: {insp.NTA.notna().mean():.1%}; codes that are 2020 codes: {insp.NTA.isin(nta.NTA2020).mean():.1%}")restaurants carrying a 2010 NTA code: 98.4%; codes that are 2020 codes: 0.0%
98.4% of rows have an NTA code, but none of them is a 2020 code: the file still uses the 2010 neighbourhood scheme. Joining on that column to 2020 boundaries matches nothing, so the points are joined spatially instead.
3. Rank neighbourhoods with enough inspections
ok = per[per.inspections >= 30].sort_values("median_score")
print("lowest median score:", ok.head(3)[["NTAName", "BoroName", "inspections", "median_score"]].to_dict("records"))
print("highest median score:", ok.tail(3)[["NTAName", "BoroName", "inspections", "median_score"]].to_dict("records"))
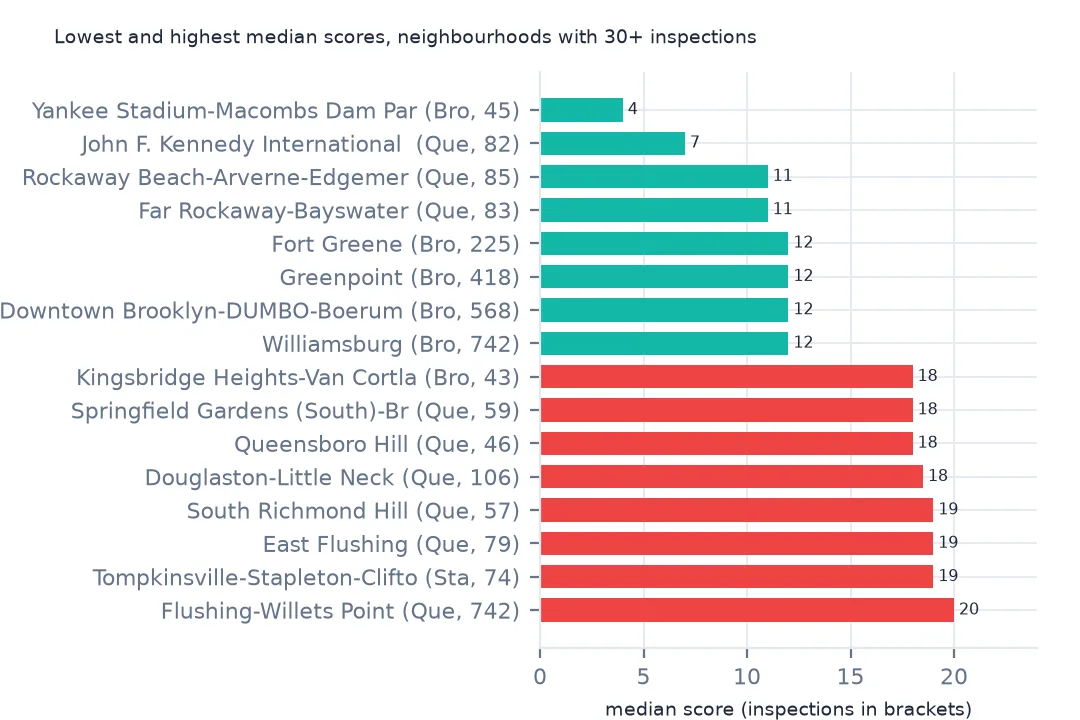
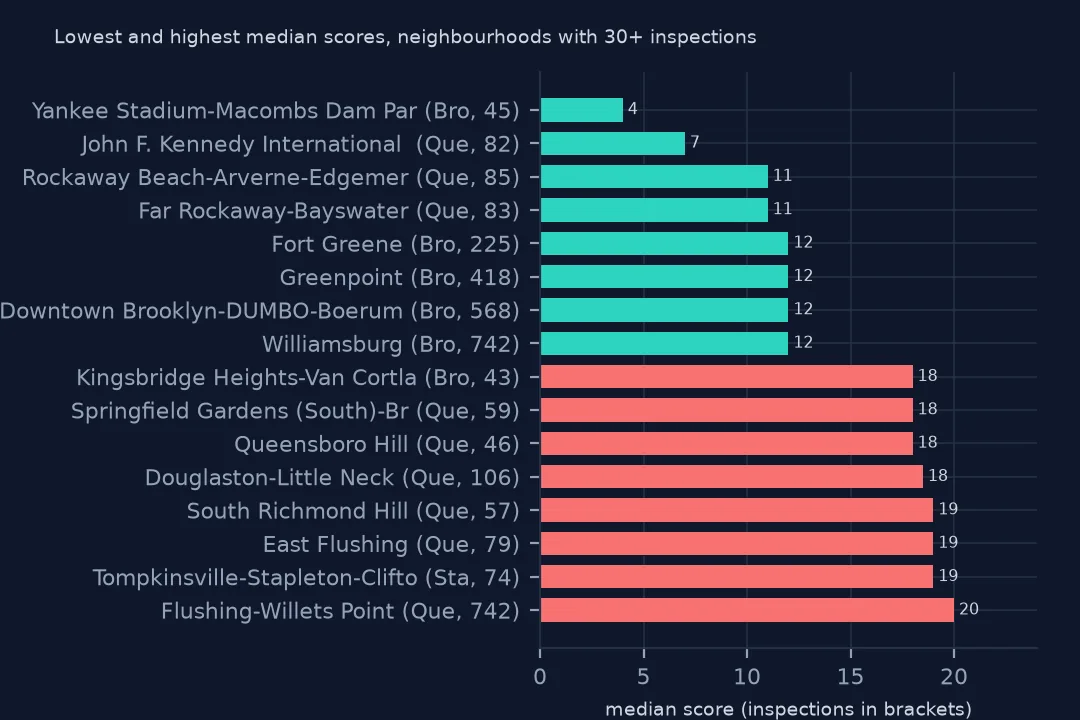
lowest median score: [{'NTAName': 'Yankee Stadium-Macombs Dam Park', 'BoroName': 'Bronx', 'inspections': 45, 'median_score': 4.0}, {'NTAName': 'John F. Kennedy International Airport', 'BoroName': 'Queens', 'inspections': 82, 'median_score': 7.0}, {'NTAName': 'Rockaway Beach-Arverne-Edgemere', 'BoroName': 'Queens', 'inspections': 85, 'median_score': 11.0}]
highest median score: [{'NTAName': 'East Flushing', 'BoroName': 'Queens', 'inspections': 79, 'median_score': 19.0}, {'NTAName': 'Tompkinsville-Stapleton-Clifton-Fox Hills', 'BoroName': 'Staten Island', 'inspections': 74, 'median_score': 19.0}, {'NTAName': 'Flushing-Willets Point', 'BoroName': 'Queens', 'inspections': 742, 'median_score': 20.0}]
The lowest medians are places dominated by stadium and airport concessions: Yankee Stadium–Macombs Dam Park (4) and JFK Airport (7), then Rockaway Beach (11). The highest are East Flushing and Flushing–Willets Point in Queens (19 and 20) and Tompkinsville–Stapleton on Staten Island (19). Flushing's 742 inspections make it one of the busiest restaurant districts in the city as well as one of the worst-scoring.
Bad inspections and boroughs
The data used on this page
New York City Department of Health and Mental Hygiene restaurant inspection results from NYC Open Data, saved on this site on 16 October 2026, and the city's 2020 Neighborhood Tabulation Areas.
from pathlib import Path

import geopandas as gpd
import numpy as np
import pandas as pd
import requests
from shapely import wkt

Path("data").mkdir(exist_ok=True)
# NYC Department of Health and Mental Hygiene (DOHMH) restaurant inspection results (NYC Open Data, dataset 43nn-pn8j),
# downloaded on 16 October 2026 and saved on this site (xz-compressed, unchanged), because the city replaces it daily.
# Live: https://data.cityofnewyork.us/api/views/43nn-pn8j/rows.csv?accessType=DOWNLOAD
# Also NYC 2020 Neighborhood Tabulation Areas (dataset 9nt8-h7nd), saved on 15 October 2026.
FILES = ["nyc-restaurant-inspections-2026-10-16-v2.csv.xz", "nyc-nta-2020-2026-10-15.zip"]
for name in FILES:
    if not Path(f"data/{name}").exists():
        Path(f"data/{name}").write_bytes(requests.get(f"https://data.spatialworkflow.io/{name}", timeout=600).content)
insp = pd.read_csv("data/nyc-restaurant-inspections-2026-10-16-v2.csv.xz", dtype=str)
insp["date"] = pd.to_datetime(insp["INSPECTION DATE"], format="%m/%d/%Y")
insp["SCORE"] = pd.to_numeric(insp.SCORE)
insp["lat"], insp["lon"] = pd.to_numeric(insp.Latitude), pd.to_numeric(insp.Longitude)
n = pd.read_csv("data/nyc-nta-2020-2026-10-15.zip")
nta = gpd.GeoDataFrame(n.drop(columns="the_geom"), geometry=n.the_geom.map(wkt.loads), crs=4326).to_crs(2263)
print(f"DOHMH inspections file: {len(insp):,} rows for {insp.CAMIS.nunique():,} restaurants")
DOHMH inspections file: 296,514 rows for 31,531 restaurants
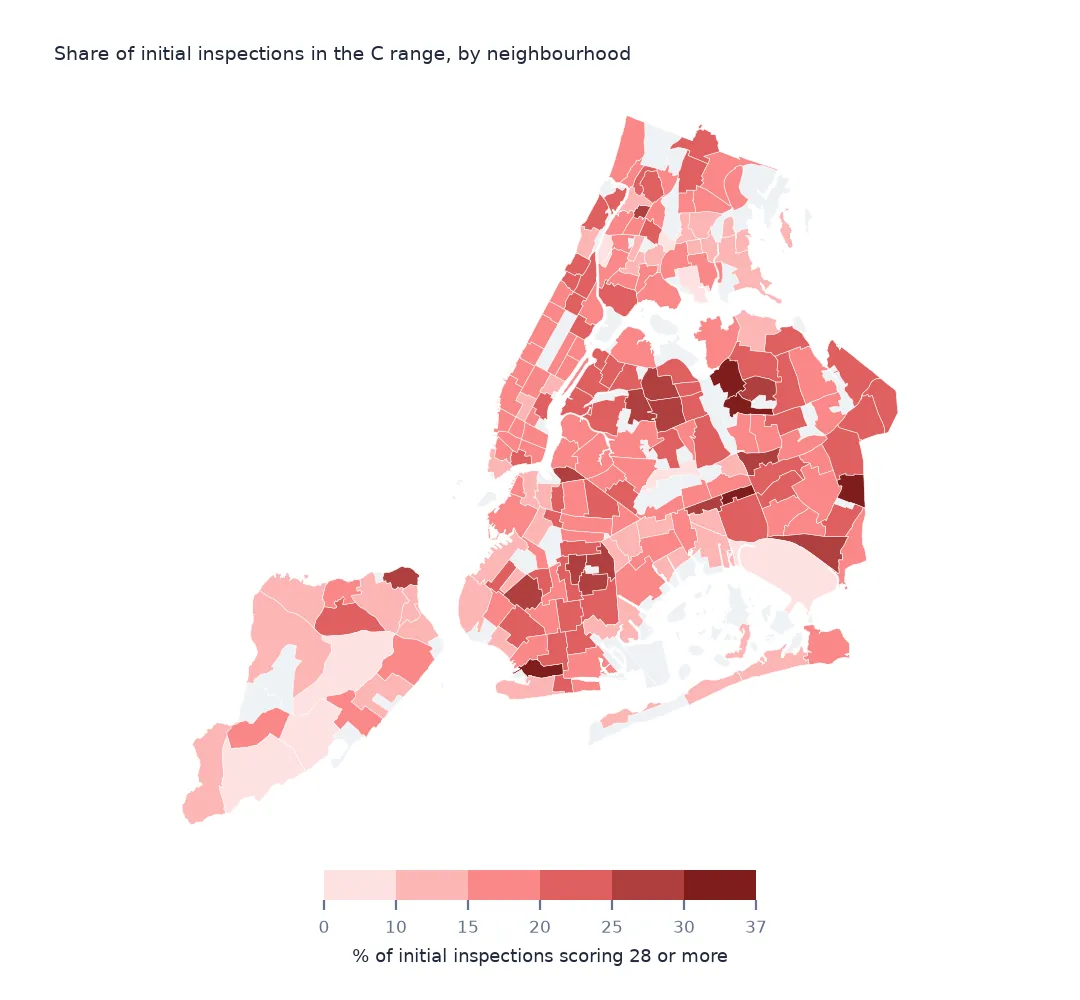
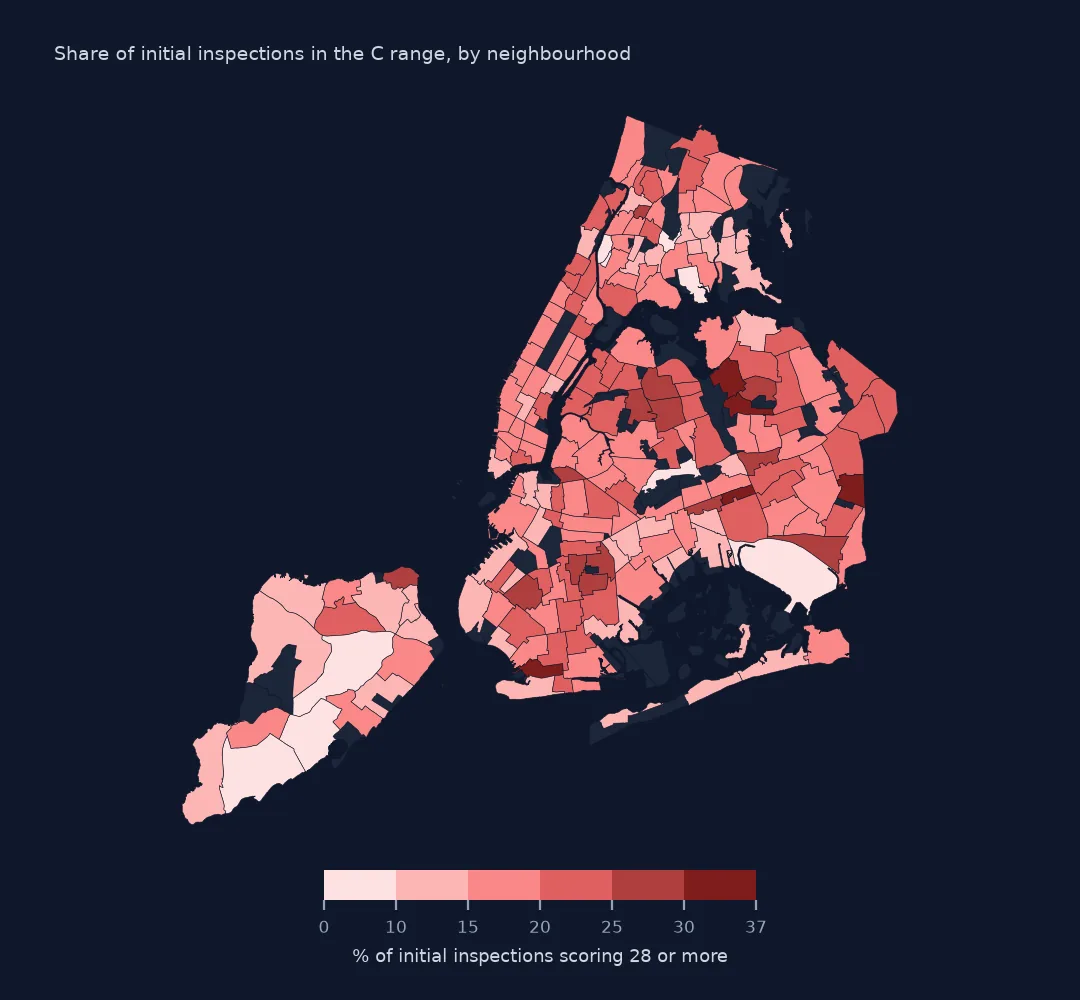
Example 1: share scoring 28 or more
j["c_range"] = j.SCORE >= 28
c = j.groupby("NTAName").agg(n=("SCORE", "size"), share=("c_range", "mean"))
print(c[c.n >= 30].sort_values("share", ascending=False).head(5).round(3).to_dict("index"))
{'Gravesend (South)': {'n': 33, 'share': 0.364}, 'Queensboro Hill': {'n': 46, 'share': 0.326}, 'Flushing-Willets Point': {'n': 742, 'share': 0.321}, 'South Richmond Hill': {'n': 57, 'share': 0.316}, 'Cambria Heights': {'n': 40, 'share': 0.3}}
By the share of inspections scoring 28 or more (the C range), Gravesend (South) leads at 36.4%, followed by Queensboro Hill and Flushing–Willets Point (32.1%). Shares from 30–50 inspections are noisy; give them less weight than Flushing's.
Example 2: by borough
print(j.groupby("BoroName").SCORE.agg(["size", "median", "mean"]).round(1).to_string()) size median mean
BoroName
Bronx 4389 13.0 17.5
Brooklyn 11992 12.0 17.5
Manhattan 17330 12.0 17.0
Queens 10396 13.0 19.2
Staten Island 1688 13.0 16.9
Borough medians are 12 or 13 everywhere, and Queens has the highest mean (19.2). The variation is between neighbourhoods, not boroughs, which is why a borough map hides it.
What a neighbourhood score measures
A neighbourhood's median score summarises the restaurants that happen to be there, so it mixes place with type of restaurant. Areas dominated by chain coffee shops and airport concessions score low, and areas with many small independent kitchens score higher, partly because older buildings make pests and maintenance harder. The map is a description of inspection outcomes, not a ranking of how safe it is to eat in each place.
Map choices
- Use the median, not the mean: a few inspections above 100 points pull means up.
- Set a minimum count. Parks and airports have few restaurants and extreme medians.
- Do not use the file's NTA column for 2020 boundaries; it holds 2010 codes.
- Points with zero coordinates must be dropped before the join or they vanish silently.
Internal links
- NYC restaurant letter grades explained — scores and grades
- Neighbourhood codes that match no boundary — 2010 against 2020 NTAs
- Restaurants plotted in the ocean — zero coordinates
FAQ
Which NYC neighbourhood has the worst restaurant inspection scores?
Among neighbourhoods with at least 30 initial inspections, Flushing–Willets Point in Queens has the highest median score, 20, from 742 inspections.
Why not map restaurant letter grades?
Grades are biased toward A by the re-inspection rule. The score of the initial inspection is the comparable measure.