
Restaurant Inspection Counts Too High: One Row per Violation
On this page
Problem statement
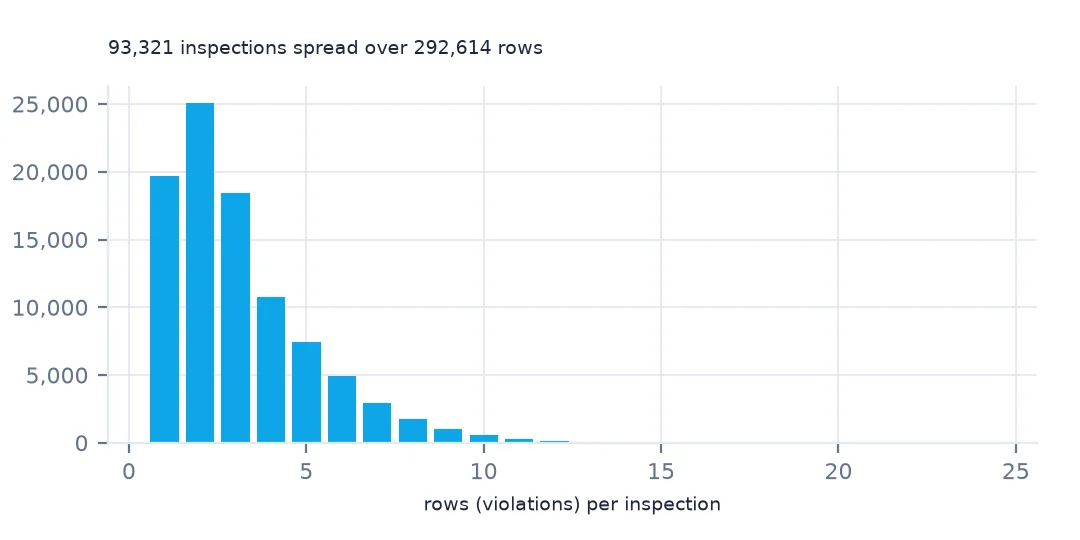
Count the rows of New York's restaurant inspection file and you get 296,514 "inspections". There are 93,321. The file has one row per violation, repeating the inspection's score and grade on each, so a bad inspection with 24 violations counts 24 times. Averages over rows are weighted toward the worst inspections: the mean score per row is 25.7 against 17.9 per inspection, and the share of C grades more than doubles. This page shows the repetition, the key that identifies an inspection, and how far row-level statistics go wrong.
Quick answer
Deduplicate on CAMIS, INSPECTION DATE and INSPECTION TYPE before counting inspections or averaging scores and grades. Count violations from the rows, and everything else from the deduplicated table.
print(f"rows: {len(insp):,}; distinct inspections: {insp[insp.date.dt.year > 1900].drop_duplicates(['CAMIS', 'INSPECTION DATE', 'INSPECTION TYPE']).shape[0]:,}")
print(f"mean score per row: {insp.SCORE.mean():.1f}; per inspection: {insp.drop_duplicates(['CAMIS', 'INSPECTION DATE', 'INSPECTION TYPE']).SCORE.mean():.1f}")
rows: 296,514; distinct inspections: 93,321
mean score per row: 25.7; per inspection: 17.9
296,514 rows are 93,321 inspections. Averaging the score over rows gives 25.7, over inspections 17.9: the row average weights each inspection by its number of violations.
The repetition and the inspection key
1. See the repetition
k = insp.groupby(["CAMIS", "INSPECTION DATE", "INSPECTION TYPE"]).size()
one = k.idxmax()
print(f"most rows for one inspection: {k.max()} ({insp[insp.CAMIS == one[0]].DBA.iloc[0]}, {one[1]})")
print(insp[(insp.CAMIS == one[0]) & (insp["INSPECTION DATE"] == one[1])][["VIOLATION CODE", "SCORE", "GRADE"]].head(4).to_string(index=False))
print(f"rows identical to another row in every column: {insp.duplicated(keep=False).sum():,}")
most rows for one inspection: 24 (A LO PERUCHO, 03/18/2026)
VIOLATION CODE SCORE GRADE
28-06 59.0 NaN
28-06 59.0 NaN
09C 59.0 NaN
09C 59.0 NaN
rows identical to another row in every column: 408
One inspection of A Lo Perucho in March 2026 produced 24 rows, each repeating the score of 59. Some codes appear twice within it, and across the file 408 rows are exact copies of another row, duplicates in the export itself.
2. The key for an inspection
key = ["CAMIS", "INSPECTION DATE", "INSPECTION TYPE"]
ins = insp[insp.date.dt.year > 1900].drop_duplicates(key)
same_day = ins.groupby(["CAMIS", "INSPECTION DATE"]).size()
print(f"inspections: {len(ins):,}; restaurant-days with more than one inspection type: {(same_day > 1).sum():,}")
inspections: 93,321; restaurant-days with more than one inspection type: 8,522
The key needs all three fields. 8,522 restaurant-days have more than one inspection type, typically a cycle inspection and an administrative one on the same visit, so restaurant and date alone would merge them.
3. Weighted averages go wrong
b = pd.DataFrame({"by_row": insp.groupby("BORO").SCORE.mean(), "by_inspection": ins.groupby("BORO").SCORE.mean()}).round(1)
print(b.to_string())
by_row by_inspection
BORO
0 22.8 16.7
Bronx 24.3 17.6
Brooklyn 26.3 18.0
Manhattan 24.9 17.2
Queens 27.2 19.2
Staten Island 22.8 16.9
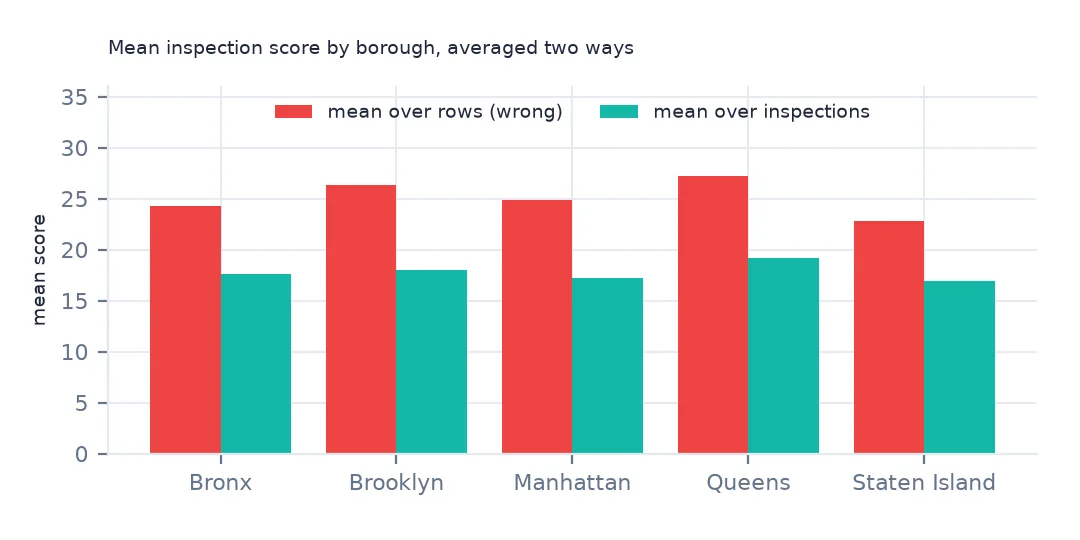
The bias is the same everywhere: borough means by row are 6–8 points higher than by inspection (Queens 27.2 against 19.2). Comparisons between boroughs happen to survive, but every absolute figure is wrong.
Grades and restaurants
The data used on this page
New York City Department of Health and Mental Hygiene restaurant inspection results from NYC Open Data, saved on this site on 16 October 2026.
from pathlib import Path

import geopandas as gpd
import numpy as np
import pandas as pd
import requests
from shapely import wkt

Path("data").mkdir(exist_ok=True)
# NYC Department of Health and Mental Hygiene (DOHMH) restaurant inspection results (NYC Open Data, dataset 43nn-pn8j),
# downloaded on 16 October 2026 and saved on this site (xz-compressed, unchanged), because the city replaces it daily.
# Live: https://data.cityofnewyork.us/api/views/43nn-pn8j/rows.csv?accessType=DOWNLOAD
# Also NYC 2020 Neighborhood Tabulation Areas (dataset 9nt8-h7nd), saved on 15 October 2026.
FILES = ["nyc-restaurant-inspections-2026-10-16-v2.csv.xz", "nyc-nta-2020-2026-10-15.zip"]
for name in FILES:
    if not Path(f"data/{name}").exists():
        Path(f"data/{name}").write_bytes(requests.get(f"https://data.spatialworkflow.io/{name}", timeout=600).content)
insp = pd.read_csv("data/nyc-restaurant-inspections-2026-10-16-v2.csv.xz", dtype=str)
insp["date"] = pd.to_datetime(insp["INSPECTION DATE"], format="%m/%d/%Y")
insp["SCORE"] = pd.to_numeric(insp.SCORE)
insp["lat"], insp["lon"] = pd.to_numeric(insp.Latitude), pd.to_numeric(insp.Longitude)
print(f"DOHMH inspections file: {len(insp):,} rows for {insp.CAMIS.nunique():,} restaurants")
DOHMH inspections file: 296,514 rows for 31,531 restaurants
Example 1: grade shares
print("by row:", insp.GRADE.value_counts(normalize=True).round(3).head(3).to_dict())
print("by inspection:", ins.GRADE.value_counts(normalize=True).round(3).head(3).to_dict())
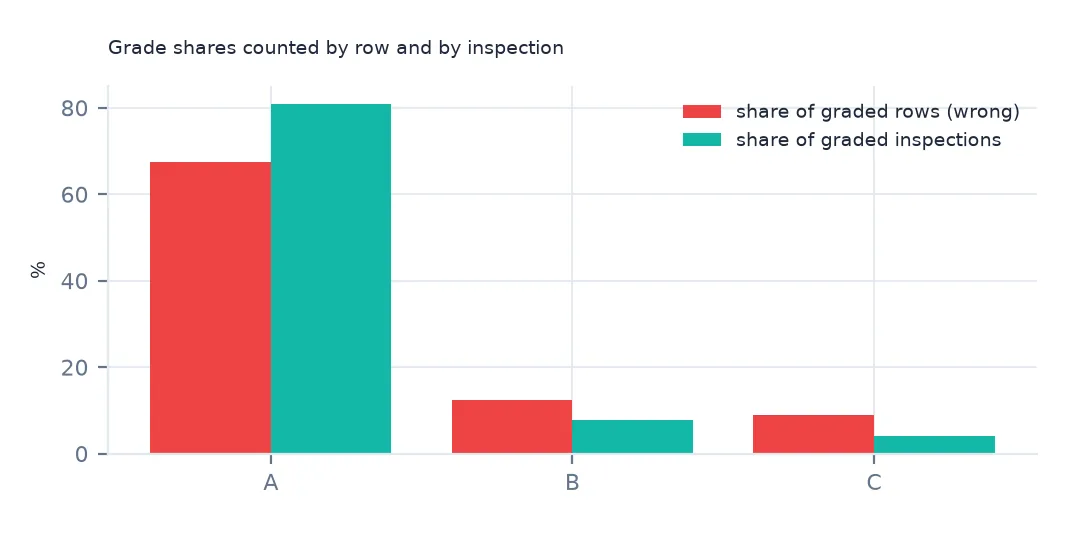
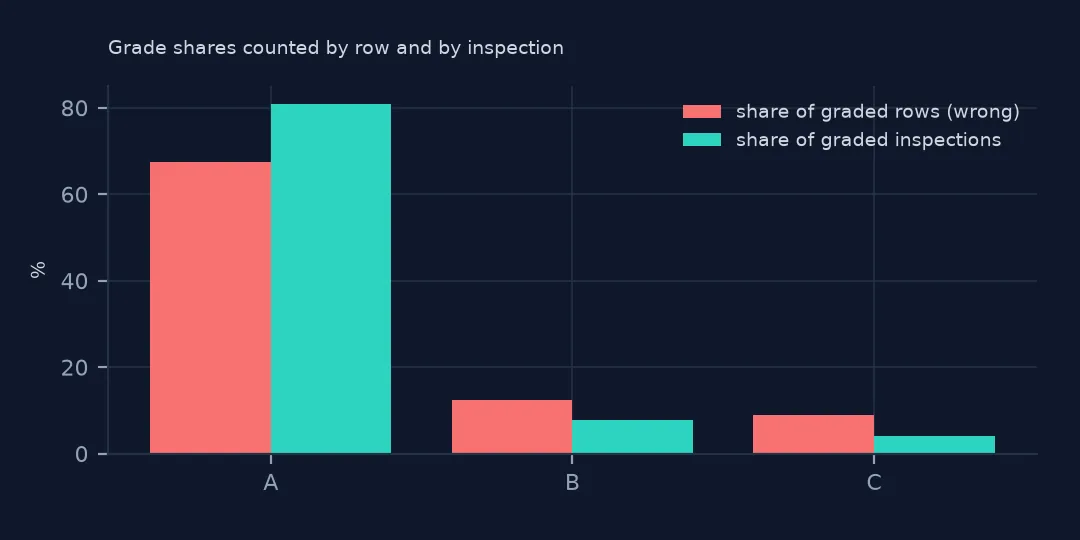
by row: {'A': 0.675, 'B': 0.124, 'C': 0.09}
by inspection: {'A': 0.809, 'B': 0.078, 'C': 0.04}
Grade shares shift too. By row, 67.5% A and 9.0% C; by inspection, 80.9% A and 4.0% C. A row-based grade chart overstates C grades more than twofold.
Example 2: restaurants, not rows
print(f"distinct restaurants: {insp.CAMIS.nunique():,}; rows: {len(insp):,}")distinct restaurants: 31,531; rows: 296,514
For restaurants, count distinct CAMIS: 31,531, against 296,514 rows.
Why the file repeats
The open dataset is a flat export of a relational structure: restaurants, their inspections, and the violations cited at each. Flattening repeats the restaurant and inspection fields on every violation row, which is convenient for reading a single restaurant's record and misleading for any aggregate. Inspections with no violation still get one row with an empty violation code, so every inspection appears at least once, and bad inspections appear many times.
Other repeated fields
- Exact duplicates: 408 rows are identical to another row in every column. Drop them before counting violations too.
- Several inspections on one day: 8,522 restaurant-days have more than one inspection type, so the date alone is not a key.
- Grade dates also repeat; use the inspection key for them as well.
- Restaurant counts need
CAMIS, not rows or names.
Internal links
- How to analyse NYC restaurant inspection results — the file and its fields
- NYC restaurant letter grades explained — scores and grades
- How to rank the most common health code violations — what inspectors cite
FAQ
Why are there more rows than inspections in NYC restaurant data?
Each row is one violation cited at an inspection; the file has 296,514 rows for 93,321 inspections.
How do I count NYC restaurant inspections in pandas?
insp.drop_duplicates(["CAMIS", "INSPECTION DATE", "INSPECTION TYPE"]), after dropping the 1900 placeholder rows.