
How to Analyse NYC Restaurant Inspection Results in Python
On this page
Problem statement
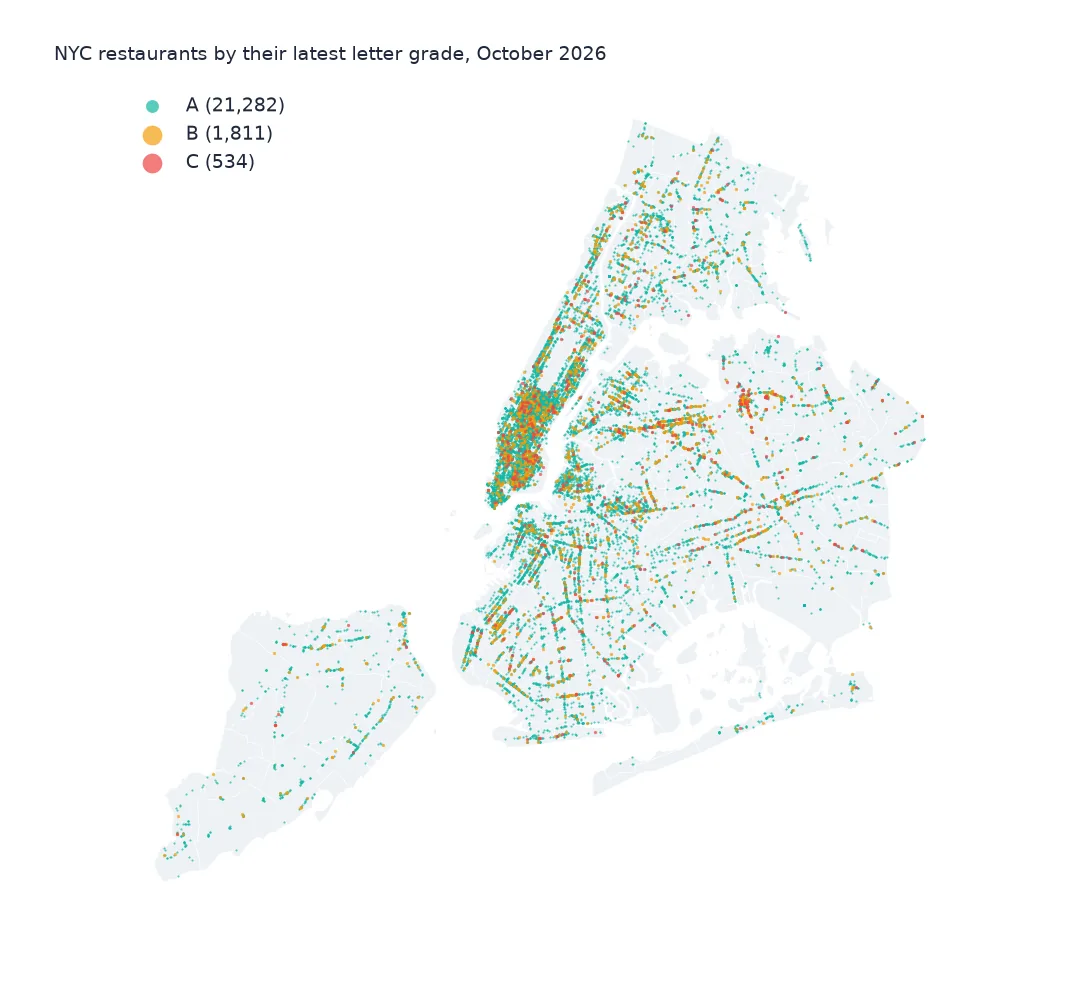
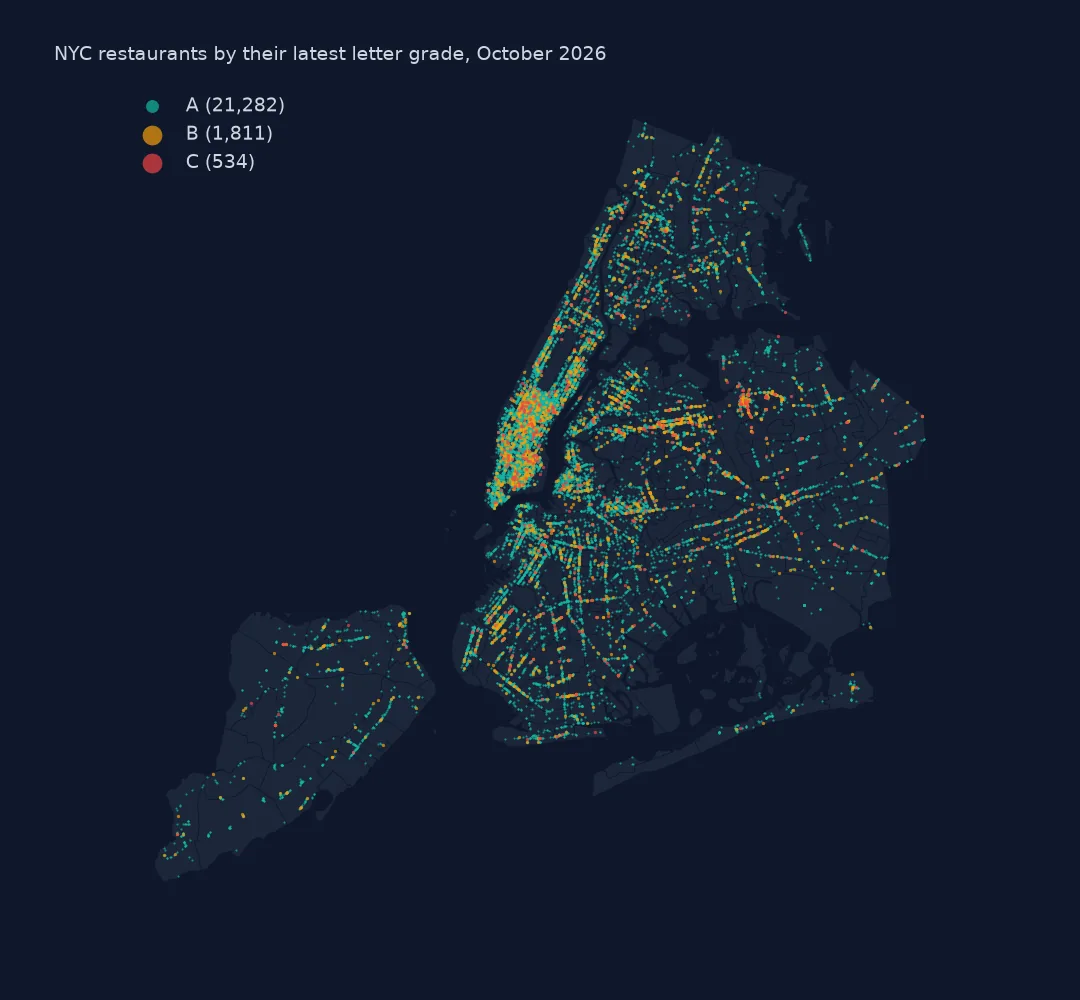
New York's health department inspects every restaurant in the city at least once a year, scores what it finds and posts a letter grade in the window. The results are published as one open dataset of 296,514 rows covering 31,531 restaurants. It looks like a table of inspections, but each row is one violation found at one inspection, scores and grades sit only on some rows, thousands of restaurants have a placeholder date of 1 January 1900, and some positions are zero. This page reads the file, explains what a row is, and gets from rows to inspections and restaurants.
Quick answer
Read the CSV as text (dtype=str), parse INSPECTION DATE with format="%m/%d/%Y", drop rows dated 1900, and deduplicate on CAMIS, INSPECTION DATE and INSPECTION TYPE to get one row per inspection. CAMIS identifies a restaurant.
ins = insp[insp.date.dt.year > 1900].drop_duplicates(["CAMIS", "INSPECTION DATE", "INSPECTION TYPE"])
print(f"{len(insp):,} rows, {len(ins):,} inspections of {ins.CAMIS.nunique():,} restaurants, {ins.date.min():%Y-%m-%d} to {ins.date.max():%Y-%m-%d}")
print("by borough:", ins.drop_duplicates("CAMIS").BORO.value_counts().to_dict())
296,514 rows, 93,321 inspections of 27,631 restaurants, 2007-08-10 to 2026-10-14
by borough: {'Manhattan': 10845, 'Brooklyn': 7070, 'Queens': 6267, 'Bronx': 2418, 'Staten Island': 1002, '0': 29}
The 296,514 rows are 93,321 inspections of 27,631 restaurants. Manhattan has the most restaurants (10,845), then Brooklyn and Queens. The earliest date, 2007, belongs to a handful of old records; nearly everything is from 2022 onward.
Rows, inspection types, scores and placeholders
1. One row per violation
print(insp[["CAMIS", "DBA", "INSPECTION DATE", "VIOLATION CODE", "CRITICAL FLAG", "SCORE", "GRADE"]].iloc[1:5].to_string(index=False))
print(f"rows per inspection: median {insp[insp.date.dt.year > 1900].groupby(['CAMIS', 'INSPECTION DATE', 'INSPECTION TYPE']).size().median():.0f}")
CAMIS DBA INSPECTION DATE VIOLATION CODE CRITICAL FLAG SCORE GRADE
50161660 CHINESE ORIENTAL EXPRESS 07/10/2025 06F Critical 13.0 A
50154876 NIZUC 06/30/2025 NaN Not Applicable NaN NaN
50053170 KEW MOTOR INN RESTAURANT & BAR 03/12/2024 04L Critical 28.0 C
50107189 WINGSTOP 02/03/2025 04A Critical 12.0 A
rows per inspection: median 3
Each row carries one violation code and repeats the inspection's score and grade. A Kew Motor Inn inspection with mice (code 04L) scored 28, a C. The median inspection has 3 rows, one per violation, so counting rows counts violations, not inspections.
2. Inspection types
print(ins["INSPECTION TYPE"].value_counts().head(6).to_dict())
print(f"cycle inspections (the routine kind): {ins['INSPECTION TYPE'].str.startswith('Cycle').mean():.1%}")
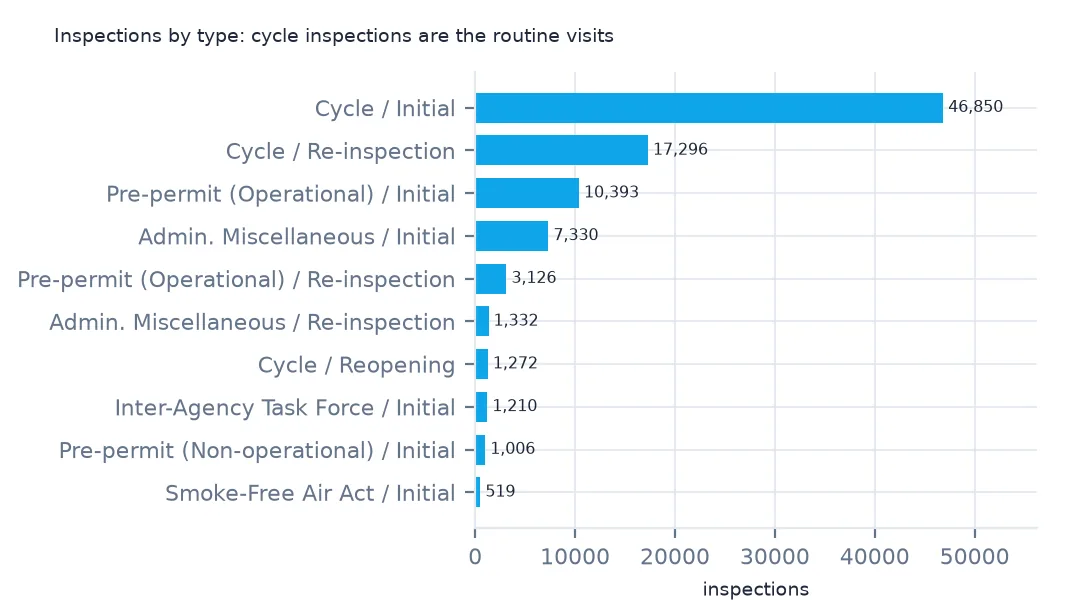
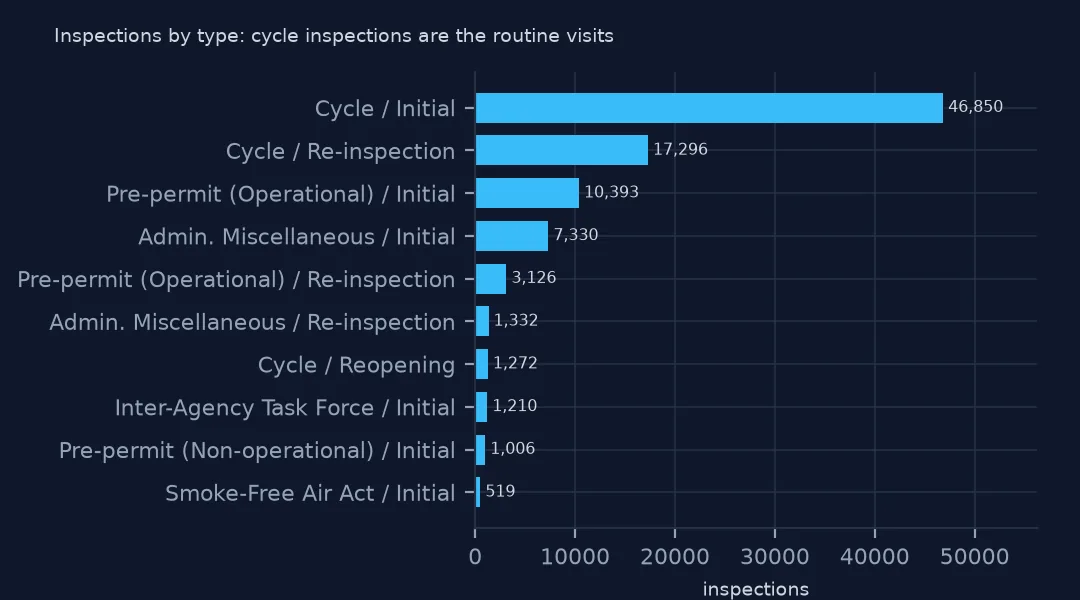
{'Cycle Inspection / Initial Inspection': 46850, 'Cycle Inspection / Re-inspection': 17296, 'Pre-permit (Operational) / Initial Inspection': 10393, 'Administrative Miscellaneous / Initial Inspection': 7330, 'Pre-permit (Operational) / Re-inspection': 3126, 'Administrative Miscellaneous / Re-inspection': 1332}
cycle inspections (the routine kind): 70.6%
Inspection types combine a programme with a stage. Cycle inspections, the routine kind, are 70.6% of the total. Their initial visits (46,850) are the comparable measure of conditions; re-inspections follow a bad initial score, and pre-permit visits check new places before they open.
3. Scores and grades
print(f"inspections with a score: {ins.SCORE.notna().mean():.1%}, median score {ins.SCORE.median():.0f}; with a grade: {ins.GRADE.notna().mean():.1%}")
print("grades on graded inspections:", ins.GRADE.value_counts().to_dict())
inspections with a score: 88.8%, median score 13; with a grade: 59.1%
grades on graded inspections: {'A': 44648, 'B': 4311, 'C': 2234, 'N': 2203, 'Z': 1259, 'P': 532}
88.8% of inspections have a score, and the median is 13, right at the boundary of an A. Only 59.1% have a grade, because grades are given only at certain inspections. A is by far the most common (44,648), and N, Z and P are not grades but placeholders for not yet graded and grade pending.
4. Placeholder rows and positions
print(f"rows dated 1900: {(insp.date.dt.year == 1900).sum():,}; rows with latitude 0: {(insp.lat == 0).sum():,}; with no latitude: {insp.lat.isna().sum():,}")rows dated 1900: 3,900; rows with latitude 0: 3,106; with no latitude: 1,690
Three kinds of rows need handling before any analysis: 3,900 rows dated 1900, which are restaurants not yet inspected; 3,106 rows with latitude 0; and 1,690 with no latitude at all. Each has its own fix page.
Cuisines and the years covered
The data used on this page
New York City Department of Health and Mental Hygiene restaurant inspection results from NYC Open Data, saved on this site on 16 October 2026.
from pathlib import Path

import geopandas as gpd
import numpy as np
import pandas as pd
import requests
from shapely import wkt

Path("data").mkdir(exist_ok=True)
# NYC Department of Health and Mental Hygiene (DOHMH) restaurant inspection results (NYC Open Data, dataset 43nn-pn8j),
# downloaded on 16 October 2026 and saved on this site (xz-compressed, unchanged), because the city replaces it daily.
# Live: https://data.cityofnewyork.us/api/views/43nn-pn8j/rows.csv?accessType=DOWNLOAD
# Also NYC 2020 Neighborhood Tabulation Areas (dataset 9nt8-h7nd), saved on 15 October 2026.
FILES = ["nyc-restaurant-inspections-2026-10-16-v2.csv.xz", "nyc-nta-2020-2026-10-15.zip"]
for name in FILES:
    if not Path(f"data/{name}").exists():
        Path(f"data/{name}").write_bytes(requests.get(f"https://data.spatialworkflow.io/{name}", timeout=600).content)
insp = pd.read_csv("data/nyc-restaurant-inspections-2026-10-16-v2.csv.xz", dtype=str)
insp["date"] = pd.to_datetime(insp["INSPECTION DATE"], format="%m/%d/%Y")
insp["SCORE"] = pd.to_numeric(insp.SCORE)
insp["lat"], insp["lon"] = pd.to_numeric(insp.Latitude), pd.to_numeric(insp.Longitude)
print(f"DOHMH inspections file: {len(insp):,} rows for {insp.CAMIS.nunique():,} restaurants")
DOHMH inspections file: 296,514 rows for 31,531 restaurants
Example 1: cuisines
r = ins.drop_duplicates("CAMIS")
print(r["CUISINE DESCRIPTION"].value_counts().head(8).to_dict())
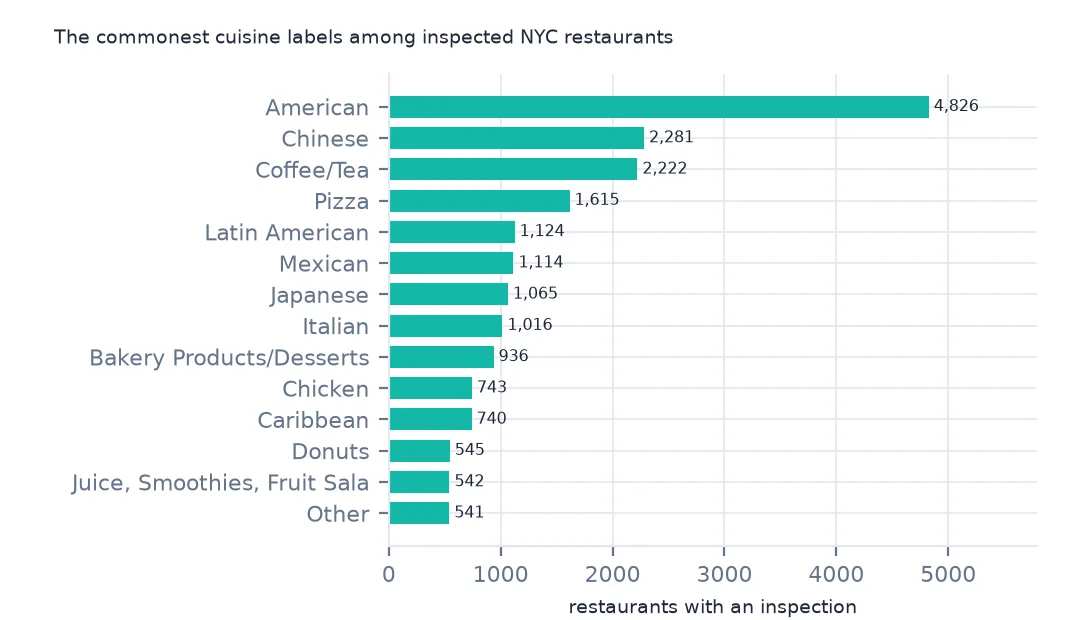
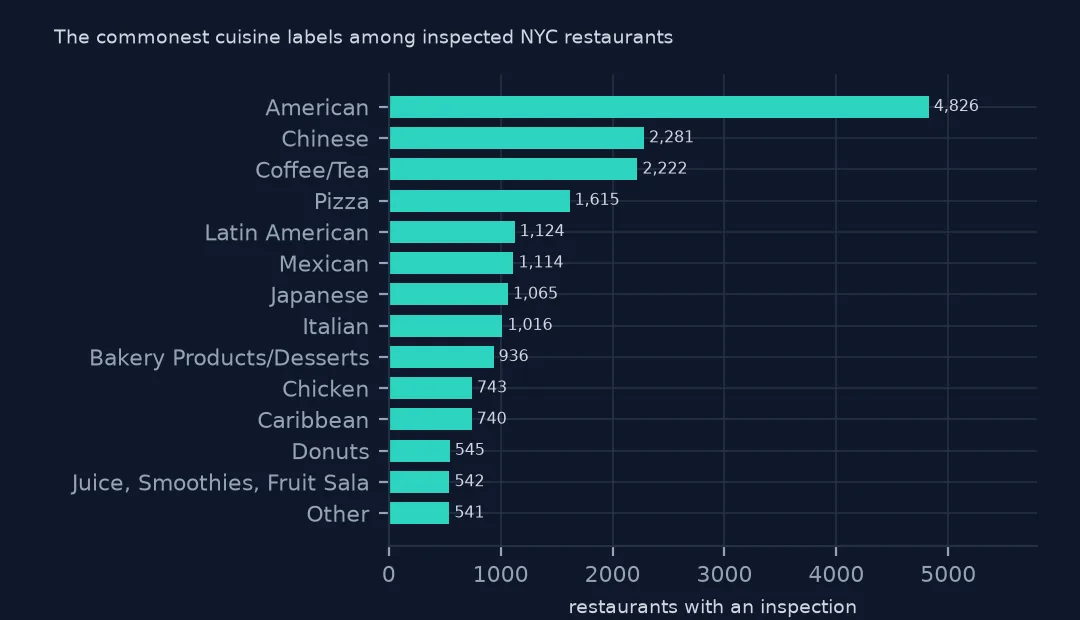
{'American': 4826, 'Chinese': 2281, 'Coffee/Tea': 2222, 'Pizza': 1615, 'Latin American': 1124, 'Mexican': 1114, 'Japanese': 1065, 'Italian': 1016}
American (4,826), Chinese (2,281) and coffee or tea (2,222) are the commonest cuisine labels, followed by pizza, Latin American and Mexican. The labels are DOHMH's own categories, chosen when the restaurant registers.
Example 2: inspections per year
print(ins.groupby(ins.date.dt.year).size().loc[2019:].to_dict()){2019: 251, 2020: 60, 2021: 82, 2022: 2579, 2023: 13429, 2024: 24601, 2025: 27385, 2026: 24390}
Inspections jump from 82 in 2021 to 13,429 in 2023 and more than twenty thousand a year after. That is the file's three-year window, not a real increase: older inspections drop out as each restaurant is inspected again. The concept page on survivorship covers what this means for trends.
Where the file comes from
Inspectors from the Department of Health and Mental Hygiene (DOHMH) visit each food service establishment on an inspection cycle, record every violation, and add up points: more points mean worse conditions. Each violation is entered separately, which is why the open data has one row per violation and repeats the restaurant, date, score and grade on each. The file is regenerated daily and covers restaurants in an active status, keeping up to three years of inspections before each one's latest. It is a current snapshot, not an archive.
First checks on a new download
- Read every column as text first. ZIP codes, BBLs and tract codes lose leading zeros as numbers.
- Borough
0marks 29 restaurants with no borough recorded. - Names change.
DBA(doing business as) is the name today, applied to the restaurant's older inspections too. - The file changes daily. Record the download date; this page uses the copy of 16 October 2026.
Internal links
- NYC restaurant letter grades explained — scores and grades
- Restaurant inspection counts too high — one row per violation
- Restaurant inspections dated 1 January 1900 — placeholder dates
- Why restaurant inspection data only shows restaurants still open — what the file leaves out
FAQ
How do I download NYC restaurant inspection data?
From NYC Open Data, dataset 43nn-pn8j, as CSV. It has one row per violation per inspection; this copy has 296,514 rows.
How many restaurants are in the NYC inspection data?
31,531 in the file of 16 October 2026, of which 27,631 have at least one inspection recorded; the rest are new places not yet inspected.