
How to Find Restaurants Closed by the Health Department
On this page
Problem statement
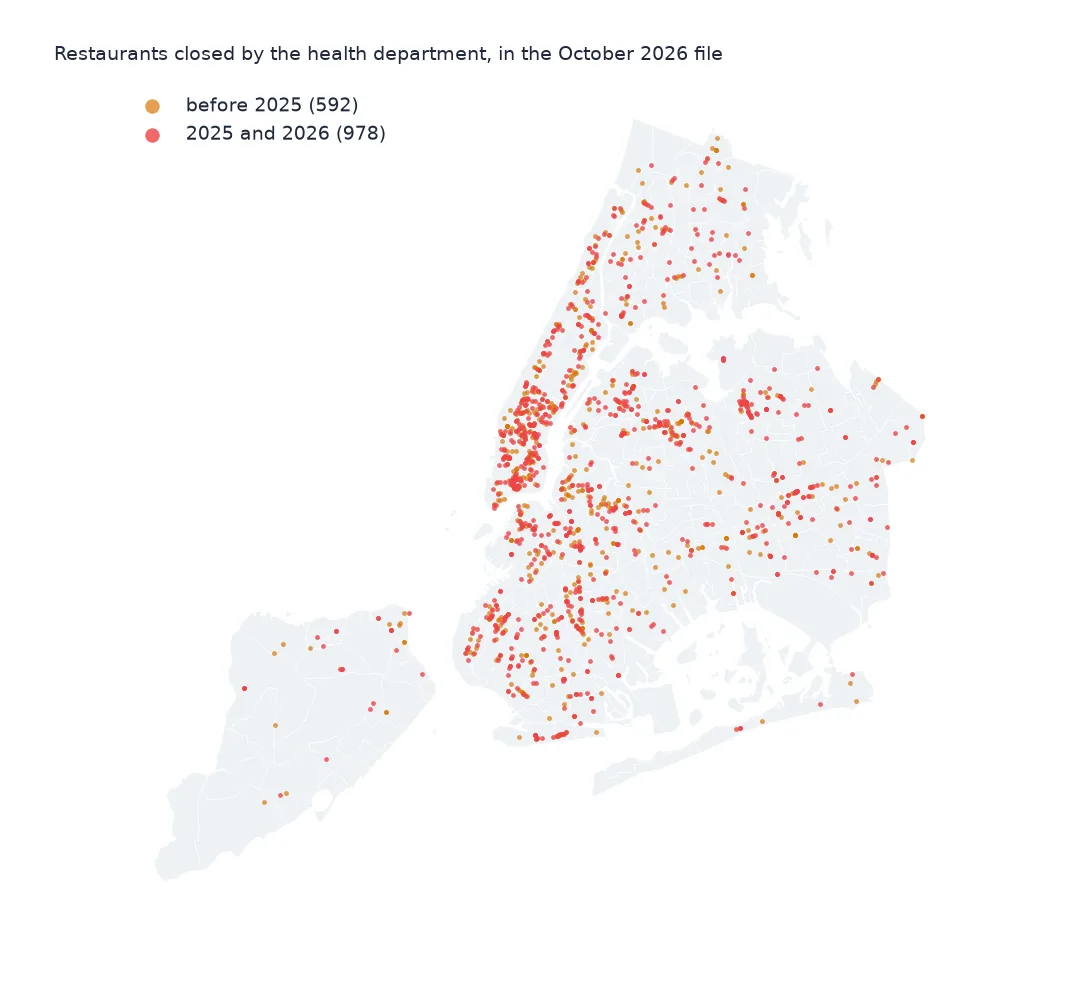
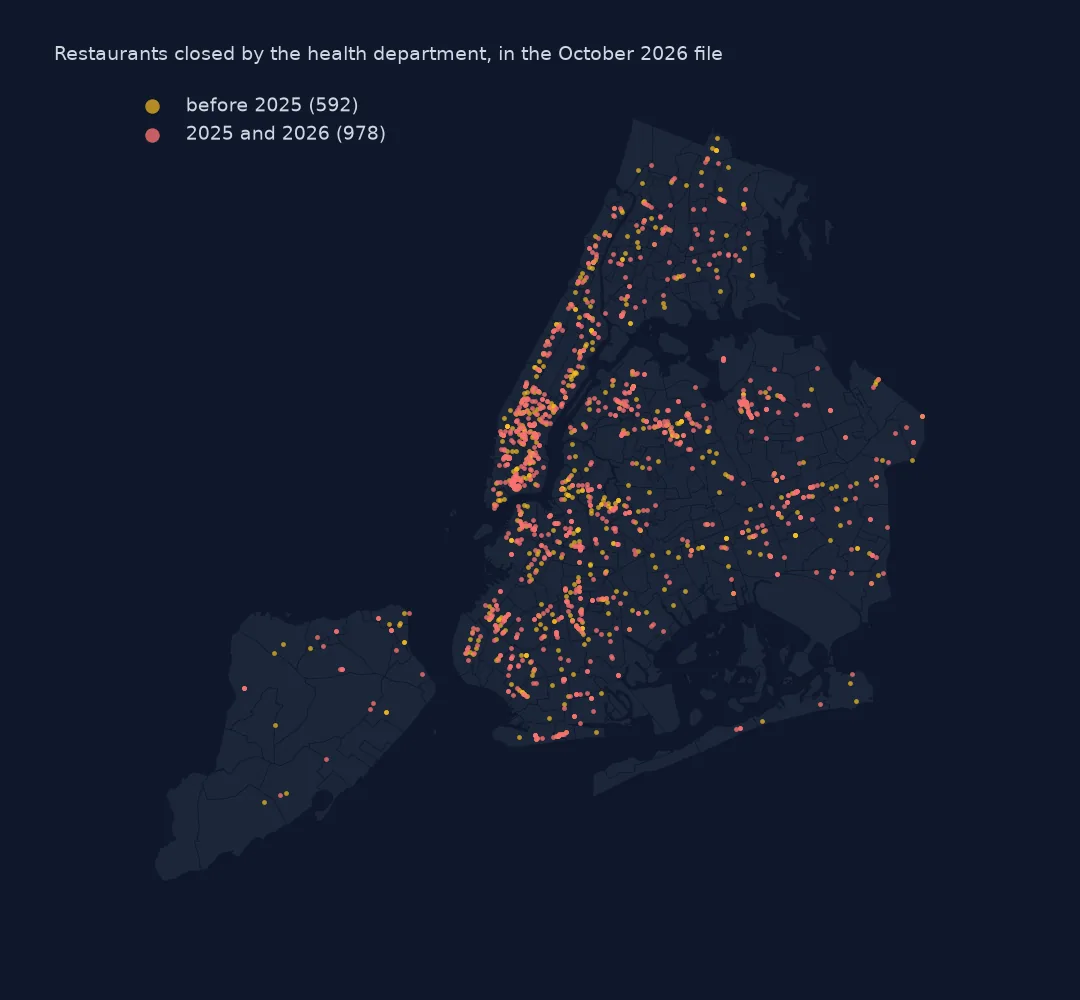
When a New York restaurant poses an immediate health hazard, such as an active rodent infestation, no hot water or sewage backing up, the health department closes it on the spot until the problem is fixed. The inspection data records every closure, reopening and re-closure in the ACTION field. This page finds the 1,590 closures in the October 2026 file, the violations behind them, how long restaurants stayed shut, and which places were closed again and again.
Quick answer
Deduplicate to one row per inspection and keep ACTION values starting with "Establishment Closed". Join those inspections back to their violation rows to see why. Pair each closure with the next "Establishment re-opened" action at the same CAMIS to measure how long it lasted.
ins = insp[insp.date.dt.year > 1900].drop_duplicates(["CAMIS", "INSPECTION DATE", "INSPECTION TYPE"])
closed = ins[ins.ACTION.str.startswith("Establishment Closed", na=False)]
print(f"closures: {len(closed):,} at {closed.CAMIS.nunique():,} restaurants since {closed.date.min():%Y}; reopened: {(ins.ACTION == 'Establishment re-opened by DOHMH.').sum():,}; re-closed: {(ins.ACTION == 'Establishment re-closed by DOHMH.').sum():,}")
closures: 1,590 at 1,308 restaurants since 2008; reopened: 1,279; re-closed: 352
The file records 1,590 closures at 1,308 restaurants, 1,279 reopenings and 352 re-closures. The oldest closure kept is from 2008, a restaurant whose old inspections survived the window.
Actions, causes and duration
1. The action field
print(ins.ACTION.value_counts().to_dict()){'Violations were cited in the following area(s).': 87235, 'No violations were recorded at the time of this inspection.': 2865, 'Establishment Closed by DOHMH. Violations were cited in the following area(s) and those requiring immediate action were addressed.': 1590, 'Establishment re-opened by DOHMH.': 1279, 'Establishment re-closed by DOHMH.': 352}
Most inspections end with violations cited (87,235); 2,865 found none. The three closure-related actions are a small but distinct group, recorded on the inspection itself.
2. What triggers a closure
cv = insp.merge(closed[["CAMIS", "INSPECTION DATE"]], on=["CAMIS", "INSPECTION DATE"])
cv = cv[cv["CRITICAL FLAG"] == "Critical"]
print(cv.groupby(["VIOLATION CODE", "VIOLATION DESCRIPTION"]).size().sort_values(ascending=False).head(5).rename(lambda d: d[:70] if isinstance(d, str) else d).to_string())
VIOLATION CODE VIOLATION DESCRIPTION
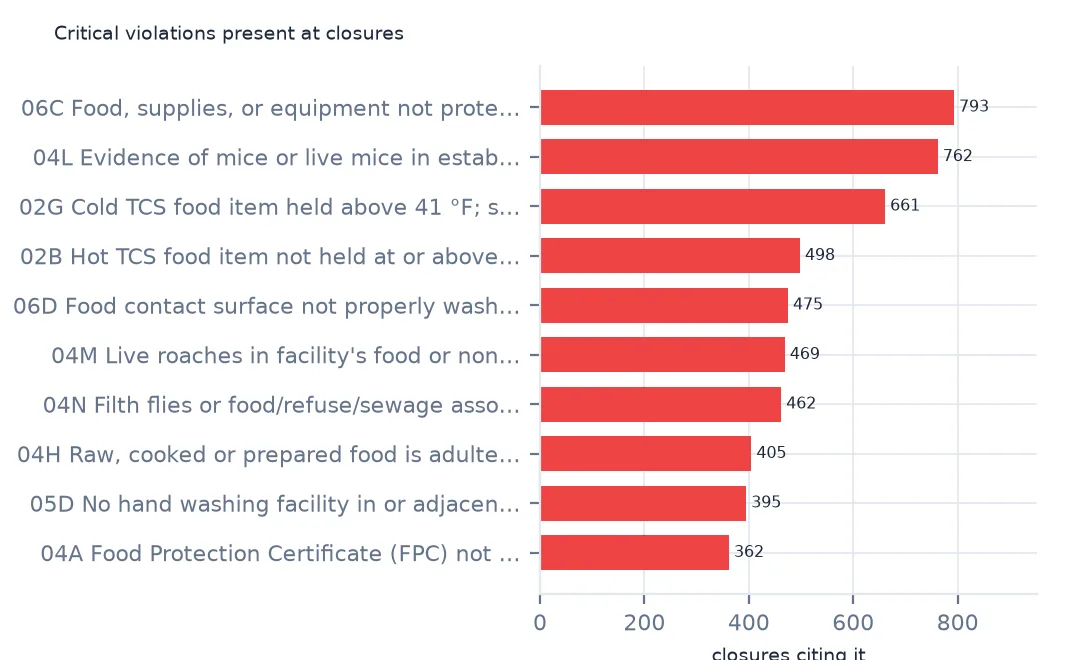
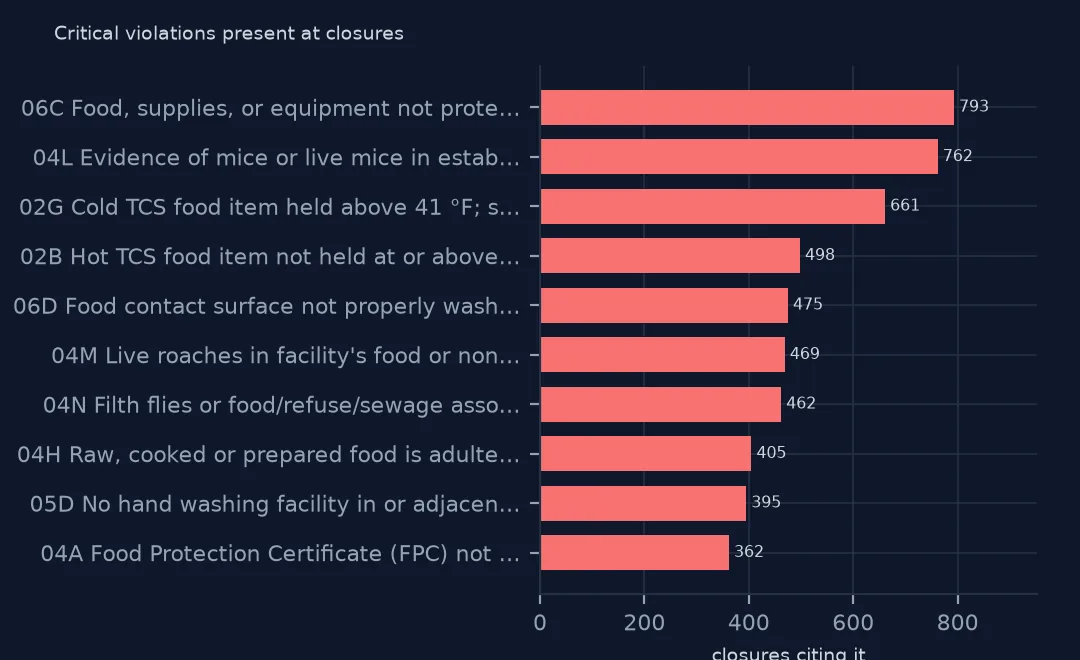
06C Food, supplies, or equipment not protected from potential source of co 793
04L Evidence of mice or live mice in establishment's food or non-food area 762
02G Cold TCS food item held above 41 °F; smoked or processed fish held abo 661
02B Hot TCS food item not held at or above 140 °F. 498
06D Food contact surface not properly washed, rinsed and sanitized after e 475
The critical violations most often present at a closure are contamination (06C, 793), mice (04L, 762) and cold-holding temperatures (02G, 661). Mice turn up at about half of all closures.
3. How long a closure lasts
re_ = ins[ins.ACTION == "Establishment re-opened by DOHMH."][["CAMIS", "date"]].rename(columns={"date": "reopen"})
pair = closed[["CAMIS", "date"]].merge(re_, on="CAMIS")
pair = pair[pair.reopen > pair.date].sort_values("reopen").drop_duplicates(["CAMIS", "date"])
days = (pair.reopen - pair.date).dt.days
print(f"closures followed by a reopening: {len(pair):,}; days closed: median {days.median():.0f}, 75th percentile {days.quantile(0.75):.0f}")
closures followed by a reopening: 1,357; days closed: median 6, 75th percentile 10
1,357 closures are followed by a reopening in the file. The median closure lasted 6 days, and three-quarters ended within 10. Closures are short, sharp interventions.
Years, boroughs and repeat closures
The data used on this page
New York City Department of Health and Mental Hygiene restaurant inspection results from NYC Open Data, saved on this site on 16 October 2026.
from pathlib import Path

import geopandas as gpd
import numpy as np
import pandas as pd
import requests
from shapely import wkt

Path("data").mkdir(exist_ok=True)
# NYC Department of Health and Mental Hygiene (DOHMH) restaurant inspection results (NYC Open Data, dataset 43nn-pn8j),
# downloaded on 16 October 2026 and saved on this site (xz-compressed, unchanged), because the city replaces it daily.
# Live: https://data.cityofnewyork.us/api/views/43nn-pn8j/rows.csv?accessType=DOWNLOAD
# Also NYC 2020 Neighborhood Tabulation Areas (dataset 9nt8-h7nd), saved on 15 October 2026.
FILES = ["nyc-restaurant-inspections-2026-10-16-v2.csv.xz", "nyc-nta-2020-2026-10-15.zip"]
for name in FILES:
    if not Path(f"data/{name}").exists():
        Path(f"data/{name}").write_bytes(requests.get(f"https://data.spatialworkflow.io/{name}", timeout=600).content)
insp = pd.read_csv("data/nyc-restaurant-inspections-2026-10-16-v2.csv.xz", dtype=str)
insp["date"] = pd.to_datetime(insp["INSPECTION DATE"], format="%m/%d/%Y")
insp["SCORE"] = pd.to_numeric(insp.SCORE)
insp["lat"], insp["lon"] = pd.to_numeric(insp.Latitude), pd.to_numeric(insp.Longitude)
print(f"DOHMH inspections file: {len(insp):,} rows for {insp.CAMIS.nunique():,} restaurants")
DOHMH inspections file: 296,514 rows for 31,531 restaurants
Example 1: closures per year and borough
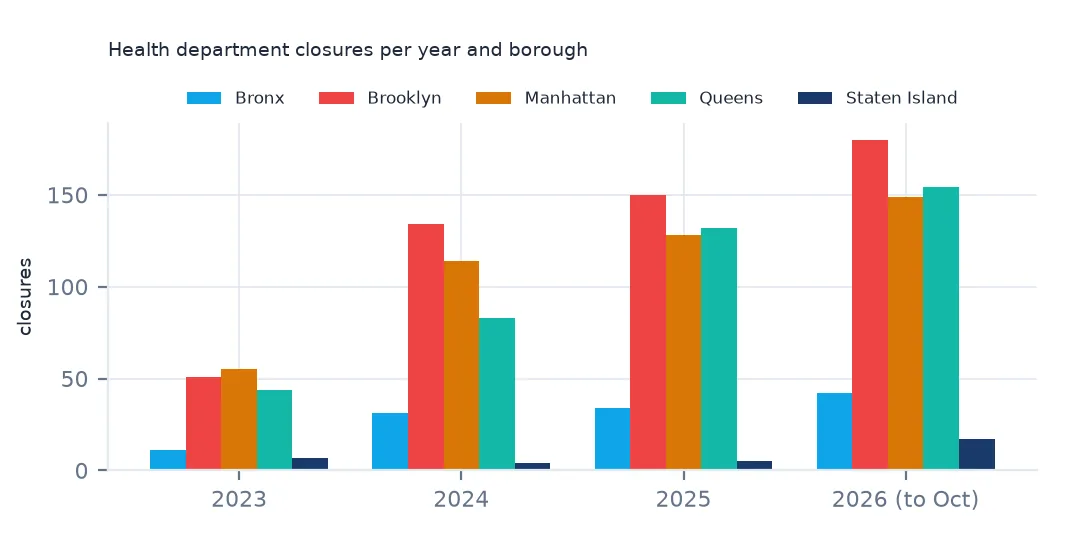
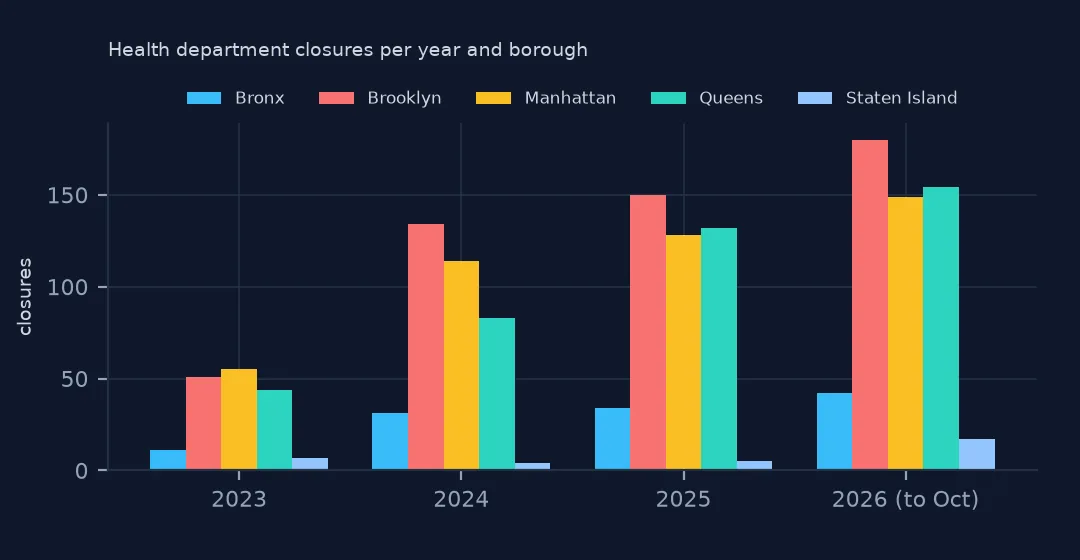
print(pd.crosstab(closed.date.dt.year, closed.BORO).loc[2023:].to_string())BORO 0 Bronx Brooklyn Manhattan Queens Staten Island
date
2023 0 11 51 55 44 7
2024 0 31 134 114 83 4
2025 3 34 150 128 132 5
2026 0 42 180 149 154 17
Brooklyn has the most closures each year (180 in 2026 so far), with Queens and Manhattan close behind. The rise from 2023 is partly the window filling and partly real: 2026 already has more closures than 2025 in Brooklyn and Queens.
Example 2: repeat closures
k = closed.groupby("CAMIS").size()
print(f"restaurants closed more than once: {(k > 1).sum():,}; most: {k.max()} ({closed[closed.CAMIS == k.idxmax()].DBA.iloc[0]})")
restaurants closed more than once: 215; most: 5 (MEEM SPICY GROCERY AND DELI)
215 restaurants were closed more than once, and one deli in the file was closed 5 times. Repeat closures are a better flag of chronic problems than any single score.
Why restaurants are closed
DOHMH closes a restaurant when conditions at the inspection are a public-health hazard that cannot be corrected at once, typically pests in food areas, no hot water, sewage problems, or food held at unsafe temperatures in quantity. The restaurant reopens after a reopening inspection shows the problem fixed, which usually takes days, not weeks. Closure data is therefore a record of acute problems found, and restaurants that close for good after one disappear from the file entirely.
Closure data caveats
- Closures of restaurants no longer operating are not in the file; counts are a floor.
- The re-closed action marks a closure at a reopening inspection, a restaurant that failed to fix the problem.
- Pair closures and reopenings by date order; a restaurant can have several of each.
- Year counts before 2023 are thin because of the three-year window.
Internal links
- How to analyse NYC restaurant inspection results — the file and its fields
- How to map mice, rats and roaches — pests by neighbourhood
- How to rank the most common health code violations — what inspectors cite
FAQ
How many NYC restaurants were closed by the health department?
The October 2026 inspection file has 1,590 closures at 1,308 restaurants still operating, plus 352 re-closures.
How long does a NYC restaurant stay closed after a health inspection?
A median of 6 days between closure and reopening, and 10 days at the 75th percentile, for closures followed by a reopening.