
NYC Restaurant Letter Grades Explained: Scores, Re-inspections and Pending Grades
On this page
Problem statement
Every New York restaurant window shows a letter grade, and it is easy to assume the grade is the score converted to a letter: A for 0–13 points, B for 14–27, C for 28 or more. The inspection data shows it is more complicated. A restaurant that scores badly at an initial inspection is not graded that day; it gets a re-inspection, and only the re-inspection's result goes on the card. The data also carries codes that are not grades at all. This page explains the scheme with the inspections in the October 2026 file.
Quick answer
A grade is the score band of the inspection that produced it, but only initial inspections scoring 0–13 and re-inspections are graded. An initial B or C score triggers a re-inspection, and the card shows that result. N means not yet graded, Z grade pending and P grade pending after a closure. Treat those three as missing, not as grades.
ins = insp[insp.date.dt.year > 1900].drop_duplicates(["CAMIS", "INSPECTION DATE", "INSPECTION TYPE"])
g = ins.dropna(subset=["GRADE"])
print(g.groupby("GRADE").SCORE.describe()[["count", "min", "50%", "max"]].to_string())
count min 50% max
GRADE
A 44646.0 0.0 10.0 27.0
B 4311.0 0.0 22.0 66.0
C 2232.0 0.0 36.0 154.0
N 2196.0 0.0 24.0 214.0
P 532.0 0.0 2.0 23.0
Z 1259.0 0.0 24.0 108.0
Graded inspections behave as the bands suggest at the median (A at 10 points, B at 22, C at 36) but not at the edges: some As have up to 27 points and some Cs none. N, P and Z cover every score from 0 to 214 because they are statuses, not grades.
Score bands, re-inspections and pending codes
1. Score bands
cyc = ins[ins["INSPECTION TYPE"].str.startswith("Cycle") & ins.SCORE.notna()]
band = pd.cut(cyc.SCORE, [-1, 13, 27, 999], labels=["0-13", "14-27", "28+"])
print(pd.crosstab(band, cyc.GRADE.fillna("(none)")).to_string())
GRADE (none) A B C N P Z
SCORE
0-13 1414 38123 9 200 14 398 240
14-27 10344 1 3610 6 246 10 458
28+ 8747 0 10 1639 205 0 237
The cross-tabulation shows the rule. Cycle inspections scoring 0–13 are almost all A (38,123). Those scoring 14–27 are mostly ungraded (10,344) or B (3,610), and those scoring 28 or more mostly ungraded (8,747) or C (1,639). Only one inspection in the 14–27 band carries an A.
2. Initial inspections and re-inspections
init = cyc[cyc["INSPECTION TYPE"].str.contains("Initial")]
print(f"initial cycle inspections scoring 14 or more: {(init.SCORE >= 14).mean():.1%}; of those given a grade on the day: {init[init.SCORE >= 14].GRADE.notna().mean():.1%}")
re_ = cyc[cyc["INSPECTION TYPE"].str.contains("Re-inspection")]
print("grades at re-inspection:", re_.GRADE.value_counts(normalize=True).round(3).to_dict())
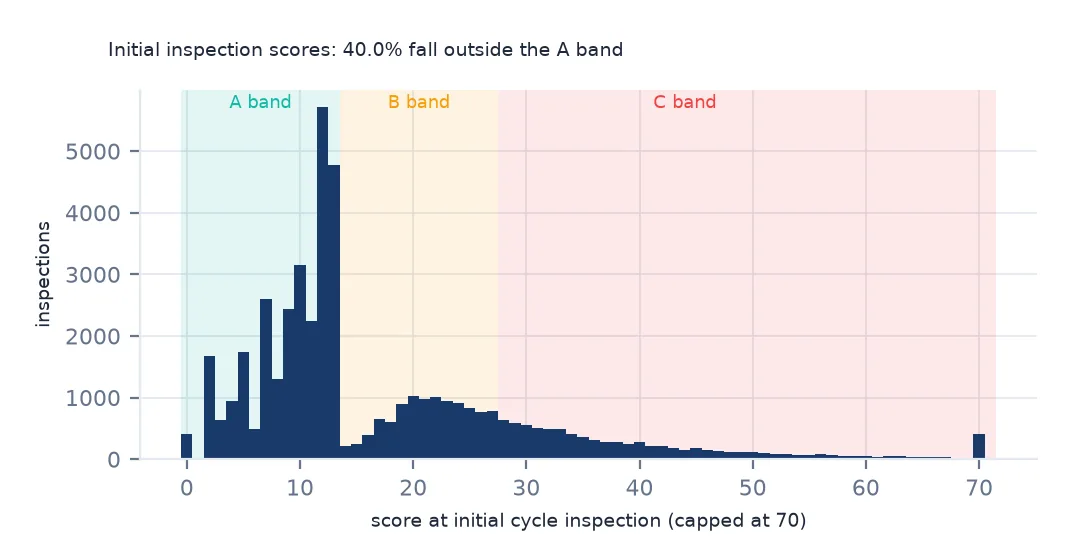
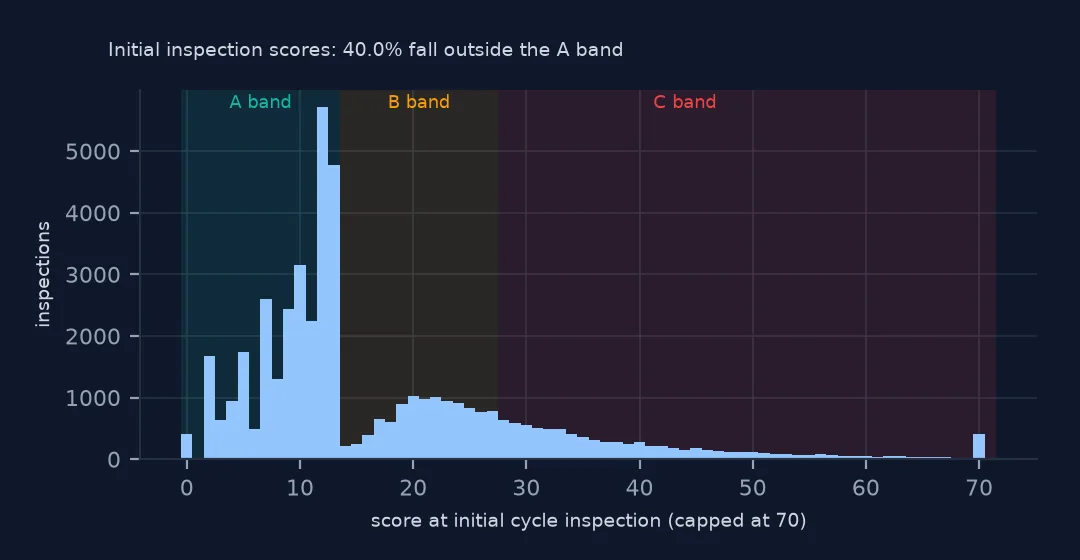
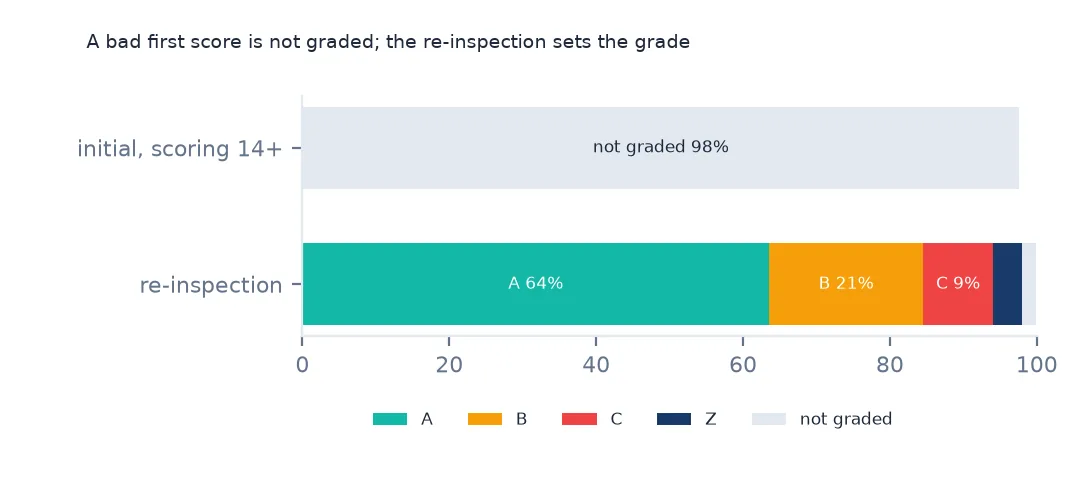
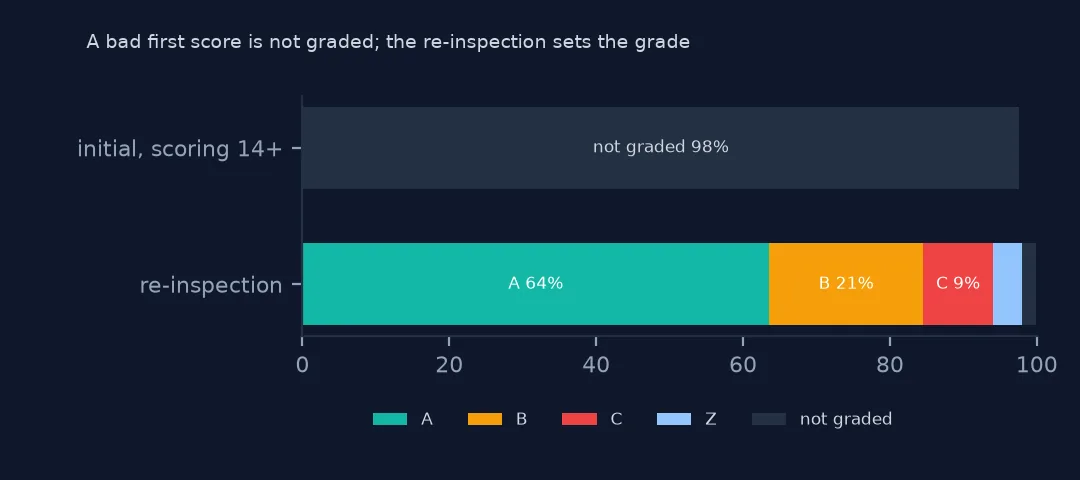
initial cycle inspections scoring 14 or more: 40.0%; of those given a grade on the day: 2.4%
grades at re-inspection: {'A': 0.648, 'B': 0.214, 'C': 0.097, 'Z': 0.041, 'N': 0.0}
40.0% of initial cycle inspections score 14 or more, but only 2.4% of those get a grade that day; the rest wait for a re-inspection. At re-inspection 64.8% earn an A, 21.4% a B and 9.7% a C. Most restaurants that fail the first visit pass the second.
3. Pending and not-yet-graded codes
print({k: int(v) for k, v in ins.GRADE.value_counts().items() if k in ("N", "Z", "P")})
print("Z by inspection type:", ins[ins.GRADE == "Z"]["INSPECTION TYPE"].value_counts().head(3).to_dict())
{'N': 2203, 'Z': 1259, 'P': 532}
Z by inspection type: {'Cycle Inspection / Re-inspection': 695, 'Cycle Inspection / Reopening Inspection': 240, 'Pre-permit (Operational) / Re-inspection': 219}
There are 2,203 N, 1,259 Z and 532 P codes. Z appears mostly at re-inspections (695), where a restaurant awarded a B or C chose to contest it, and at reopening inspections after a closure.
Restaurants' current grades
The data used on this page
New York City Department of Health and Mental Hygiene restaurant inspection results from NYC Open Data, saved on this site on 16 October 2026.
from pathlib import Path

import geopandas as gpd
import numpy as np
import pandas as pd
import requests
from shapely import wkt

Path("data").mkdir(exist_ok=True)
# NYC Department of Health and Mental Hygiene (DOHMH) restaurant inspection results (NYC Open Data, dataset 43nn-pn8j),
# downloaded on 16 October 2026 and saved on this site (xz-compressed, unchanged), because the city replaces it daily.
# Live: https://data.cityofnewyork.us/api/views/43nn-pn8j/rows.csv?accessType=DOWNLOAD
# Also NYC 2020 Neighborhood Tabulation Areas (dataset 9nt8-h7nd), saved on 15 October 2026.
FILES = ["nyc-restaurant-inspections-2026-10-16-v2.csv.xz", "nyc-nta-2020-2026-10-15.zip"]
for name in FILES:
    if not Path(f"data/{name}").exists():
        Path(f"data/{name}").write_bytes(requests.get(f"https://data.spatialworkflow.io/{name}", timeout=600).content)
insp = pd.read_csv("data/nyc-restaurant-inspections-2026-10-16-v2.csv.xz", dtype=str)
insp["date"] = pd.to_datetime(insp["INSPECTION DATE"], format="%m/%d/%Y")
insp["SCORE"] = pd.to_numeric(insp.SCORE)
insp["lat"], insp["lon"] = pd.to_numeric(insp.Latitude), pd.to_numeric(insp.Longitude)
print(f"DOHMH inspections file: {len(insp):,} rows for {insp.CAMIS.nunique():,} restaurants")
DOHMH inspections file: 296,514 rows for 31,531 restaurants
Example 1: the current grade of each restaurant
cur = ins.dropna(subset=["GRADE"]).sort_values("date").drop_duplicates("CAMIS", keep="last")
print(cur.GRADE.value_counts(normalize=True).round(3).to_dict(), f"({len(cur):,} restaurants)")
{'A': 0.789, 'N': 0.08, 'B': 0.066, 'Z': 0.046, 'C': 0.02} (27,631 restaurants)
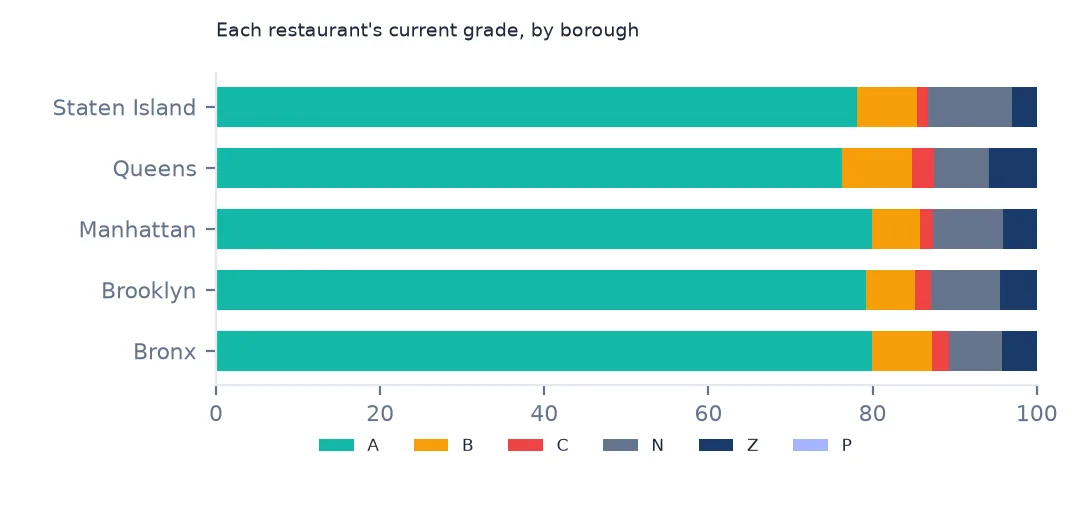
Taking each restaurant's latest graded inspection, 78.9% of 27,631 restaurants hold an A, 6.6% a B and 2.0% a C. 8.0% are N and 4.6% Z. The A share on the street is high largely because of the second chance.
Example 2: grade by borough
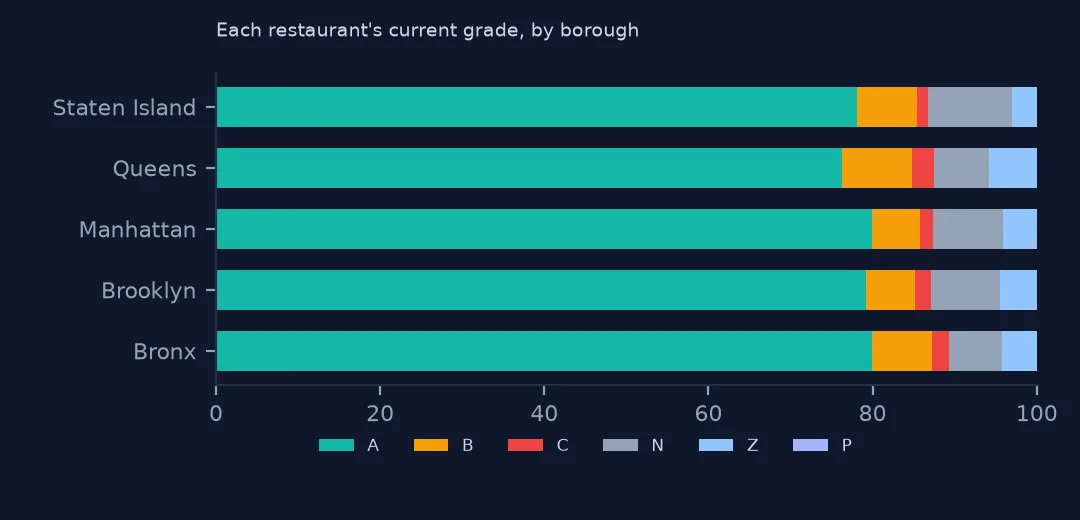
print(pd.crosstab(cur.BORO, cur.GRADE, normalize="index").round(3)[["A", "B", "C"]].to_string())GRADE A B C
BORO
0 0.897 0.069 0.000
Bronx 0.799 0.073 0.021
Brooklyn 0.792 0.060 0.019
Manhattan 0.800 0.058 0.017
Queens 0.763 0.085 0.027
Staten Island 0.781 0.073 0.013
By borough, Queens has the lowest A share (76.3%) and the highest C share (2.7%); the other boroughs sit near 79–80% A. The differences are small. The neighbourhood map shows more variation within boroughs than between them.
Why the grade is not simply the score
New York introduced letter grades in 2010 to make inspection results visible to diners and to give restaurants a second chance. A restaurant that scores 14 or more at its initial inspection is not graded on the spot; it is re-inspected some weeks later, and the re-inspection score sets the grade. A restaurant can also contest a B or C at an administrative tribunal and display "Grade Pending" until the hearing, which is the Z code. So the grade on the window measures how a restaurant performed when it knew a re-inspection was coming, not on a surprise visit.
Using grades in analysis
- Use scores of initial cycle inspections to compare restaurants or places; grades are biased toward A by the re-inspection rule.
- The A with 27 points in the data is a single exception, so check outliers before quoting a band's maximum.
- Pre-permit inspections follow different rules and are often not graded.
- The current grade is the most recent graded inspection, which may be years old.
Internal links
- How to analyse NYC restaurant inspection results — the file and its fields
- How to map restaurant inspection scores by neighbourhood — scores on a map
- Restaurant inspection counts too high — one row per violation
FAQ
What score is an A grade in New York?
0 to 13 points. 14 to 27 is a B and 28 or more a C, but an initial inspection scoring 14 or more is re-inspected before any grade is given.
What does grade Z mean in NYC restaurant data?
Grade pending: the restaurant has contested its grade or is waiting for one. The October 2026 file has 1,259 inspections with Z.