
How to Join School Neighborhood Poverty Estimates to Schools
On this page
Problem statement
Free-lunch counts are missing for whole states and distorted by universal free meals, so NCES's EDGE program publishes a second poverty measure for every school: the income-to-poverty ratio (IPR) of the neighbourhood around it, estimated from American Community Survey data. An IPR of 100 means family income at the federal poverty threshold, 200 twice it. The estimates are for 2021-22 and the schools for 2024-25, so the join on the school id leaves some schools out, and each estimate comes with a standard error that is not small. This page joins the two, explains what the numbers mean, and compares them with free-lunch eligibility.
Quick answer
Read the estimates with the school id as a string and merge on NCESSCH:
pov = pd.read_csv(Z.open("school-neighborhood-poverty-2021-22.csv"), dtype={"NCESSCH": str})
j = sch.merge(pov[["NCESSCH", "IPR_EST", "IPR_SE"]], on="NCESSCH", how="left")
print(f"schools matched to an estimate: {j.IPR_EST.notna().sum():,} of {len(j):,}")
print(j.IPR_EST.describe(percentiles=[0.1, 0.5, 0.9]).round(0).to_string())
schools matched to an estimate: 96,808 of 100,237
count 96808.0
mean 325.0
std 157.0
min 30.0
10% 170.0
50% 285.0
90% 538.0
max 990.0
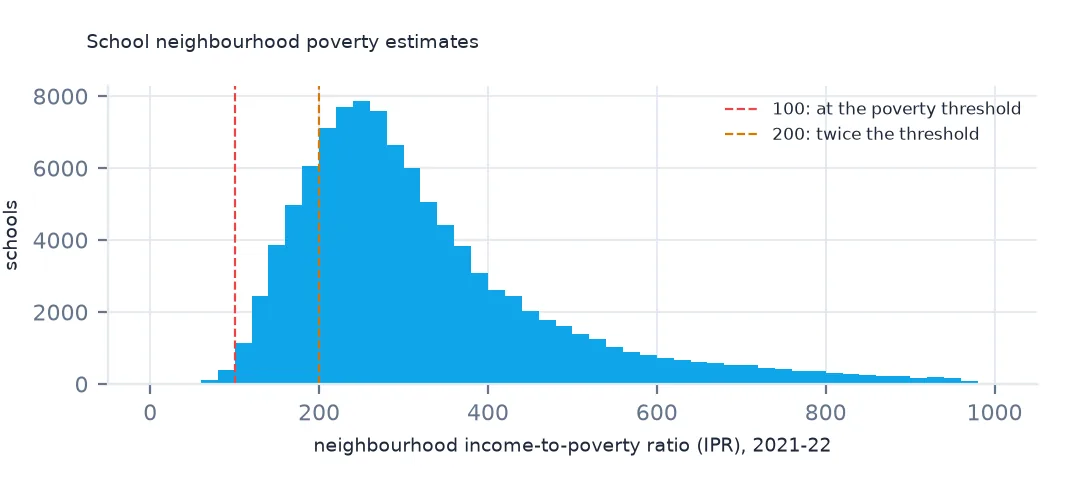
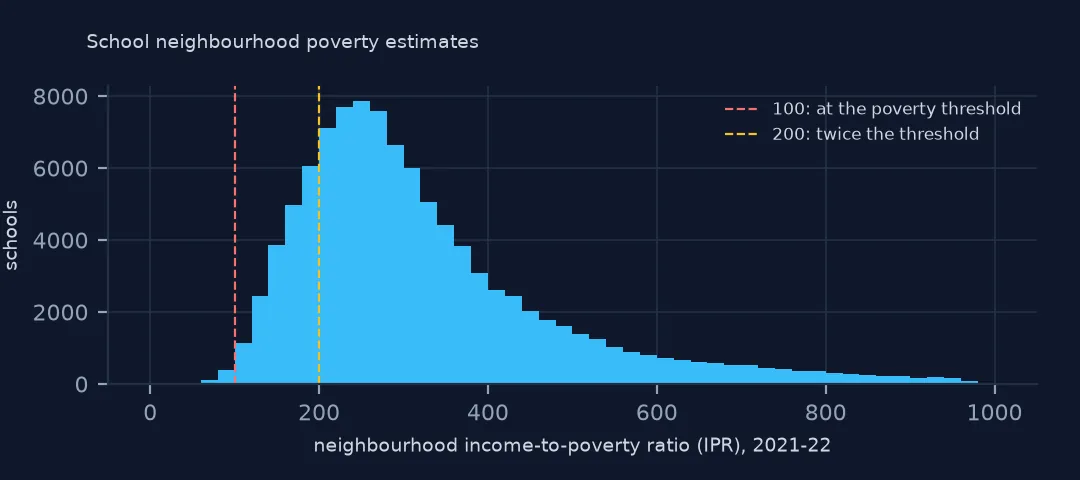
96,808 of the 100,237 operating schools get an estimate. The median school's neighbourhood has an IPR of 285, family income nearly three times the poverty threshold; a tenth of schools are below 170 and a tenth above 538.
Reading and checking the estimates
1. What IPR means
print(f"neighbourhoods below the poverty line (IPR < 100): {(pov.IPR_EST < 100).mean():.1%}; below 200: {(pov.IPR_EST < 200).mean():.1%}")
print(f"estimates at the floor (30) and ceiling (990): {(pov.IPR_EST == 30).sum()}, {(pov.IPR_EST == 990).sum()}")
print(f"median standard error: {pov.IPR_SE.median():.0f}; relative to the estimate: {(pov.IPR_SE / pov.IPR_EST).median():.1%}")
neighbourhoods below the poverty line (IPR < 100): 0.5%; below 200: 18.8%
estimates at the floor (30) and ceiling (990): 1, 1
median standard error: 74; relative to the estimate: 25.6%
Only 0.5% of school neighbourhoods have an IPR below 100, because the measure is an average over the families around a school, which rarely all sit below the line. 18.8% are below 200, the usual threshold for "low income", and that is the more useful cut. The values are bounded, with one school at the floor of 30 and one at the ceiling of 990. The median standard error is 74, a quarter of the estimate, so two schools whose IPRs differ by 50 cannot be told apart.
2. The schools that do not match
un = j[j.IPR_EST.isna()]
print(un.SY_STATUS_TEXT.value_counts().to_string())
print(f"unmatched that are new since 2021-22 (status New): {(un.SY_STATUS_TEXT == 'New').sum()}; full-virtual: {(un.VIRTUAL == 'Full Virtual').sum()}")
SY_STATUS_TEXT
Open 2484
New 867
Changed Boundary/Agency 32
Added 32
Reopened 14
unmatched that are new since 2021-22 (status New): 867; full-virtual: 199
The unmatched schools are led by ones that did not exist in 2021-22: all 867 new schools are missing, beside 2,484 listed as open. 199 are full-time virtual schools, which have no neighbourhood to estimate. Matching a newer school year to these estimates will always lose the newest schools; say how many.
3. Against free-lunch eligibility
from scipy.stats import spearmanr
b = j[(j.TOTAL >= 50) & j.TOTFRL.notna() & j.IPR_EST.notna()]
r = spearmanr(b.IPR_EST, b.TOTFRL / b.TOTAL)
print(f"schools with both: {len(b):,}; rank correlation of IPR with FRL share: {r.statistic:.2f}")
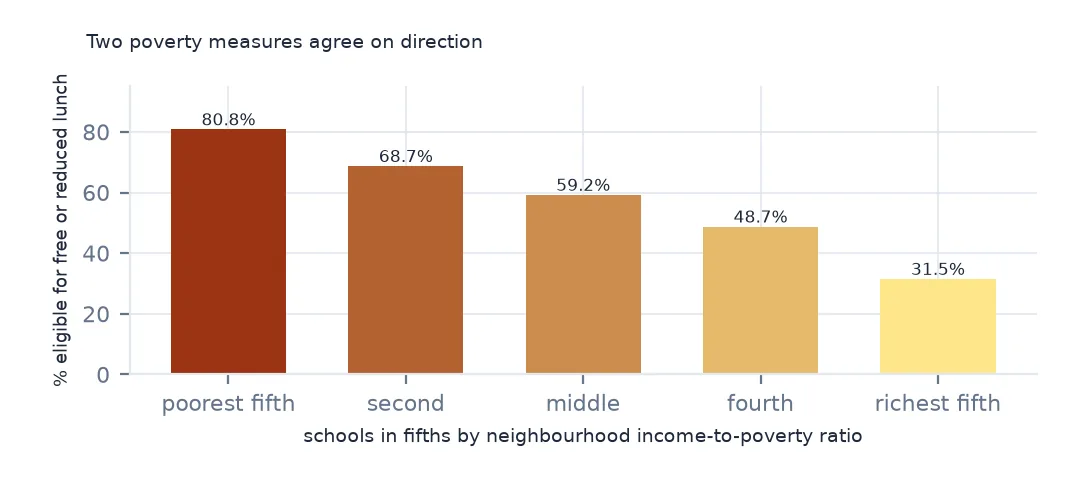
print(b.groupby(pd.qcut(b.IPR_EST, 5)).apply(lambda d: d.TOTFRL.sum() / d.TOTAL.sum()).map("{:.1%}".format).to_string())
schools with both: 75,097; rank correlation of IPR with FRL share: -0.63
IPR_EST
(29.999, 206.0] 80.8%
(206.0, 260.0] 68.7%
(260.0, 320.0] 59.2%
(320.0, 426.0] 48.7%
(426.0, 990.0] 31.5%
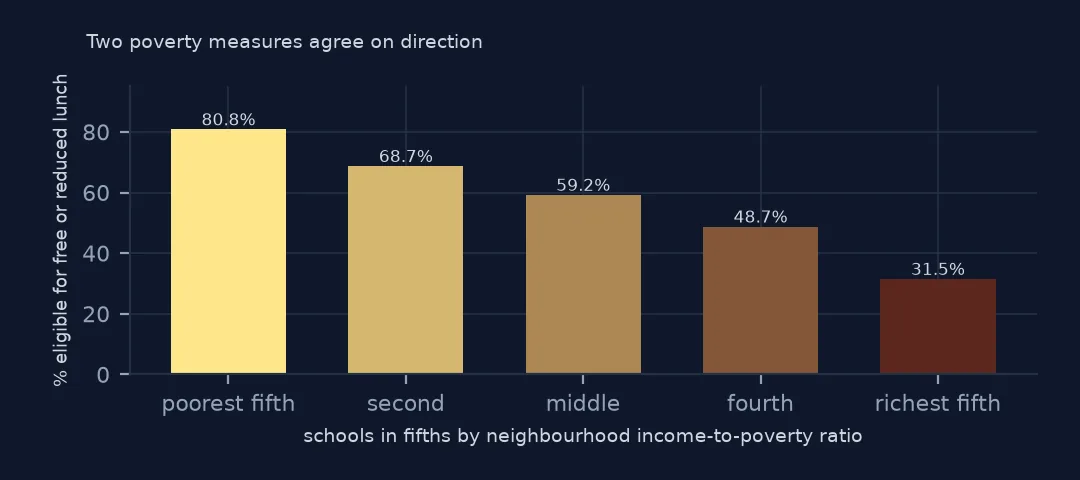
For the 75,097 schools with at least 50 students and both measures, the rank correlation between neighbourhood IPR and the free-lunch share is -0.63. Split into fifths by IPR, the poorest fifth of neighbourhoods has 80.8% of students eligible and the richest 31.5%. The two agree on direction and disagree often in detail: a school can draw from beyond its neighbourhood, and a neighbourhood can be richer than the families who choose its school.
Poverty by locale
The data used on this page
NCES's Public School Characteristics layer from the Education Demographic and Geographic Estimates (EDGE) program: the 2024-25 Common Core of Data on EDGE's school points, every record of its ArcGIS service, downloaded on 28 October 2026 and saved on this site, because the "Current" layer is replaced each school year. EDGE's School Neighborhood Poverty Estimates for 2021-22 come from the same service and the same download. Public domain. Counts are headcounts reported by state education agencies; teachers are full-time equivalents.
from pathlib import Path
import zipfile

import geopandas as gpd
import numpy as np
import pandas as pd
import requests

Path("data").mkdir(exist_ok=True)
# NCES EDGE "Public School Characteristics" for 2024-25 (the Common Core of Data on EDGE's school points), EDGE's school
# neighborhood poverty estimates for 2021-22, and the Census Bureau's 2024 counties and states. Saved 28 October 2026:
# the "Current" layers are replaced every school year.
# Live: https://services1.arcgis.com/Ua5sjt3LWTPigjyD/arcgis/rest/services/School_Characteristics_Current/FeatureServer/1
ARCHIVE = "nces-schools-2026-10-28.zip"
if not Path(f"data/{ARCHIVE}").exists():
    Path(f"data/{ARCHIVE}").write_bytes(requests.get(f"https://data.spatialworkflow.io/{ARCHIVE}", timeout=600).content)
Z = zipfile.ZipFile(f"data/{ARCHIVE}")
sch = pd.read_csv(Z.open("school-characteristics-2024-25.csv"), dtype={"NCESSCH": str, "LEAID": str, "CNTY": str, "LZIP": str, "LSTREET2": str})
for f in ["cb_2024_us_county_20m.zip", "cb_2024_us_state_20m.zip"]:
    Path(f"data/{f}").write_bytes(Z.read(f))
print(f"NCES public schools 2024-25: {len(sch):,} records")
sch["LSTATE"] = sch.LSTATE.str.strip()                                    # stored padded to three characters
NUM = ["TOTAL", "FTE", "STUTERATIO", "TOTFRL", "FRELCH", "REDLCH", "DIRECTCERT", "AM", "AS_", "BL", "HP", "HI", "TR", "WH"]
sch[NUM] = sch[NUM].where(sch[NUM] >= 0)                                  # -1 missing, -2 not applicable, -9 below quality standards
sch = sch[sch.SY_STATUS_TEXT.isin(["Open", "New", "Reopened", "Added", "Changed Boundary/Agency"])]
print(f"operating schools: {len(sch):,}; students: {sch.TOTAL.sum():,.0f}")
NCES public schools 2024-25: 101,110 records
operating schools: 100,237; students: 49,343,524
Example 1: by locale
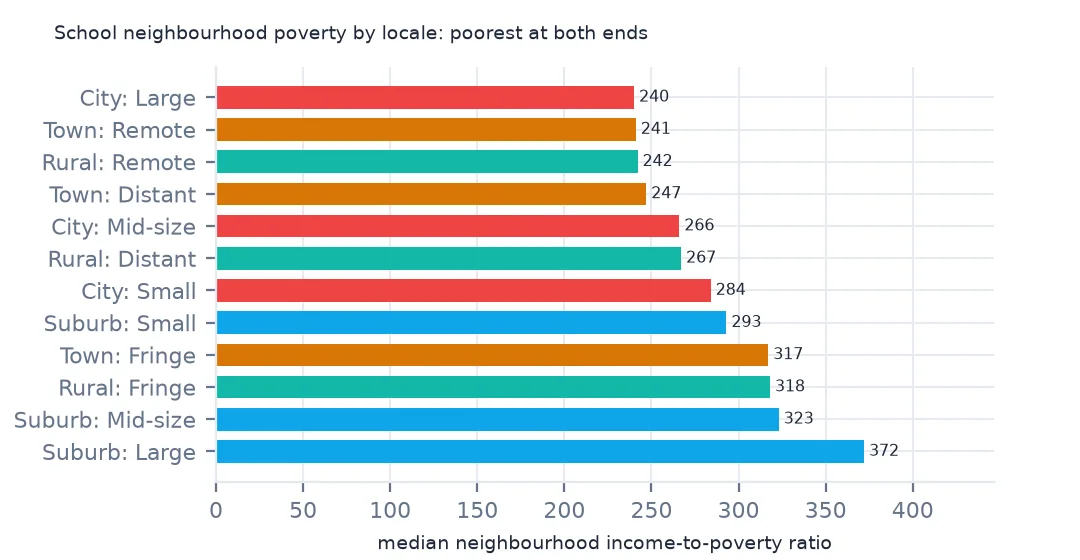
print(j.assign(locale=j.ULOCALE.str[3:]).groupby("locale").IPR_EST.median().sort_values().to_string())locale
City: Large 240.0
Town: Remote 241.0
Rural: Remote 242.0
Town: Distant 247.0
City: Mid-size 266.0
Rural: Distant 267.0
City: Small 284.0
Suburb: Small 293.0
Town: Fringe 317.0
Rural: Fringe 318.0
Suburb: Mid-size 323.0
Suburb: Large 372.0
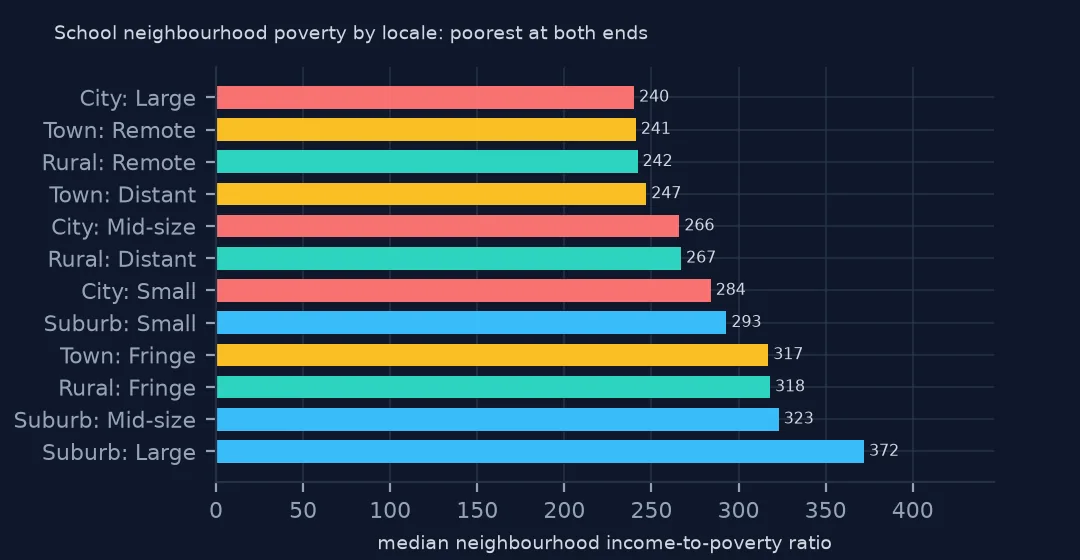
By locale, the poorest school neighbourhoods are at both ends of the settlement scale: large cities, with a median IPR of 240, remote towns at 241 and remote rural areas at 242. Large suburbs are the richest, 372. A map of school poverty that shows only cities misses half of it.
Internal links
- Free and reduced-price lunch — the count this measure stands in for
- Locale codes explained — the twelve classes in the last table
- Reading the school data — the ids the join uses
- Margins of error explained — reading an estimate with its standard error