
How to read a USGS ShakeMap and find who was shaken
On this page
Problem statement
After an earthquake, the USGS publishes a ShakeMap: a grid of estimated ground motion, including macroseismic intensity, interpolated from seismic stations, felt reports and a ground-motion model. It is the layer that turns an epicentre and a magnitude into something that can be joined to people and buildings — and it arrives as an XML file of nearly 300,000 rows with the grid geometry hidden in an attribute block.
This guide reads the ShakeMap for the M7.1 Ridgecrest earthquake of 6 July 2019, turns it into a raster, and counts the population in each intensity class using census blocks.
Quick answer
Find the ShakeMap product on the event, parse grid.xml, and reshape it into a raster:
import re
import numpy as np, requests
from rasterio.transform import from_origin

def shakemap_grid(eventid):
    ev = requests.get("https://earthquake.usgs.gov/fdsnws/event/1/query",
                      params={"eventid": eventid, "format": "geojson"}, timeout=60).json()
    sm = ev["properties"]["products"]["shakemap"][0]
    text = requests.get(sm["contents"]["download/grid.xml"]["url"], timeout=300).text
    spec = dict(re.findall(r'(\w+)="([^"]+)"',
                           re.search(r"<grid_specification([^>]*)>", text).group(1)))
    fields = [n for _, n in re.findall(r'<grid_field index="(\d+)" name="(\w+)"', text)]
    body = text.split("<grid_data>")[1].split("</grid_data>")[0]
    rows = np.fromstring(body.replace("\n", " "), sep=" ").reshape(-1, len(fields))
    nlon, nlat = int(spec["nlon"]), int(spec["nlat"])
    grids = {f: rows[:, i].reshape(nlat, nlon) for i, f in enumerate(fields)}
    dlon = (float(spec["lon_max"]) - float(spec["lon_min"])) / (nlon - 1)
    dlat = (float(spec["lat_max"]) - float(spec["lat_min"])) / (nlat - 1)
    transform = from_origin(float(spec["lon_min"]) - dlon / 2,
                            float(spec["lat_max"]) + dlat / 2, dlon, dlat)
    return grids, transform, sm["properties"]

grids, transform, props = shakemap_grid("ci38457511")        # Ridgecrest, M7.1, 6 July 2019
mmi = grids["MMI"]
print(f"ShakeMap version {props['version']}, maximum MMI {float(props['maxmmi']):.1f}")
print(f"grid {mmi.shape}, MMI {mmi.min():.1f}–{mmi.max():.1f}, "
      f"cell {abs(transform.a) * 111:.1f} km at the equator")
ShakeMap version 1, maximum MMI 8.7
grid (474, 581), MMI 1.6–8.7, cell 1.8 km at the equator
The rows run west to east and north to south, so reshaping to (nlat, nlon) gives a north-up raster directly.
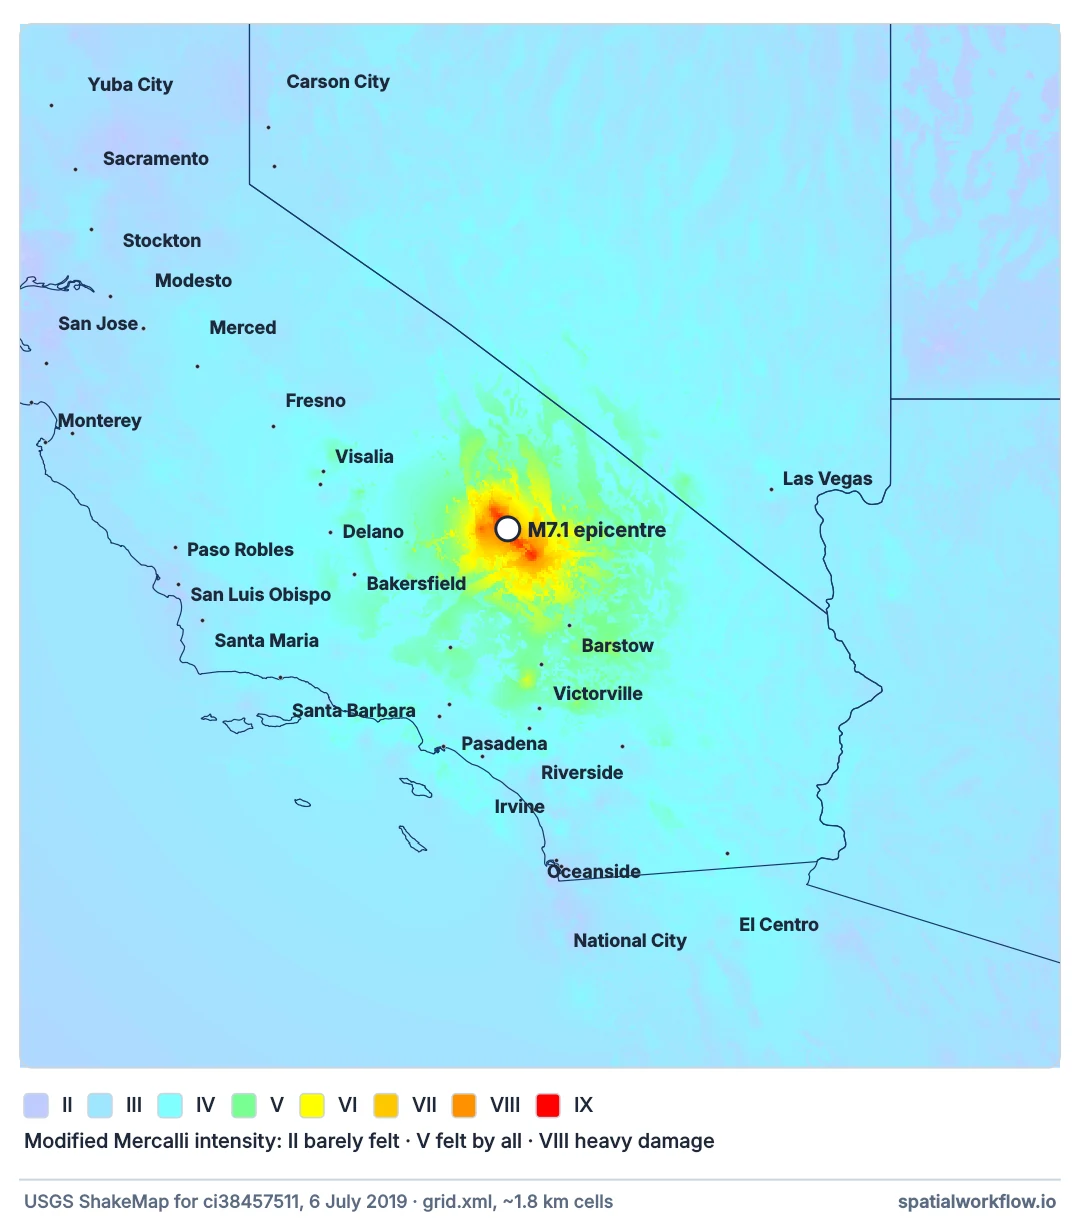
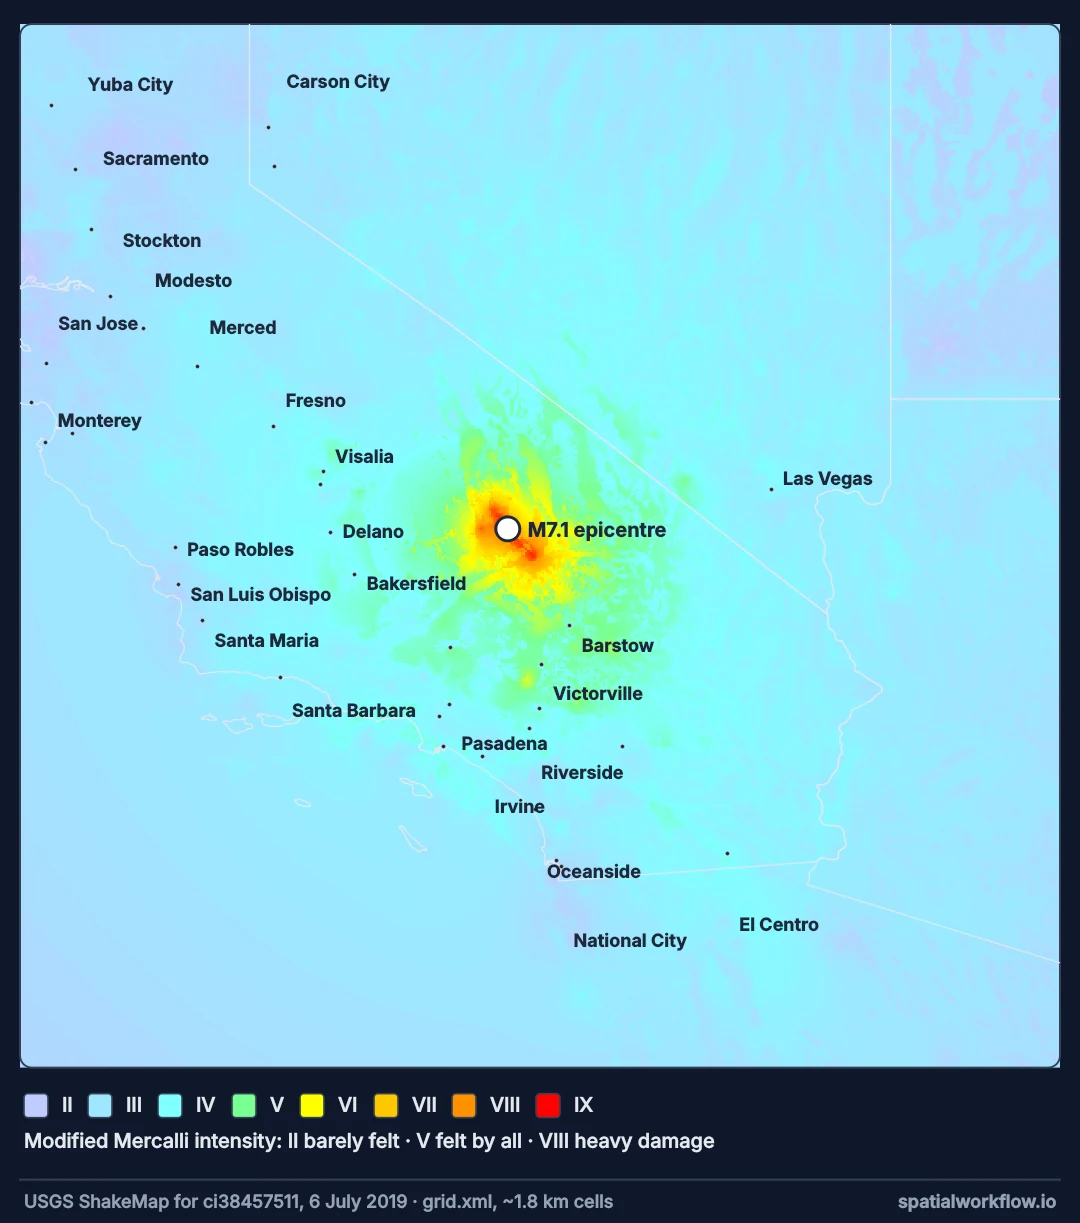
Find the product, parse the grid, sample at exposure units
1. Find the product on the event
Every event's GeoJSON has a products dictionary. ShakeMap appears there when one has been produced, sometimes in several versions and from several networks.
2. Parse the grid specification
lon_min, lat_max, nlon, nlat and the spacing give the transform. The corner coordinates are cell centres, so shift by half a cell to make a raster transform.
3. Reshape the data block
One row per cell, in the order the fields declare. MMI is the intensity layer; PGA, PGV and the spectral accelerations are the engineering ones.
4. Sample at the exposure units
Census blocks, buildings or a population grid. ShakeMap cells are about 1.9 km across, much coarser than a census block in a town and much finer than a rural one.
5. Class by intensity, not by distance
MMI classes — VI strong, VII very strong, VIII severe — map onto damage expectations. Distance from the epicentre does not, because the rupture is a line and the ground amplifies differently in different places.
6. State the version and the time
ShakeMaps are revised as data arrives. A count of exposed population is a count under one version of one map.
Population by shaking intensity
The data used on this page
The ShakeMap comes live from the USGS event service in the quick answer. Population comes from the 2020 Census: TIGER/Line block polygons for California, which carry POP20, kept for the four counties the shaking reached — Inyo, Kern, Los Angeles and San Bernardino.
import os

import geopandas as gpd

TIGER = "https://www2.census.gov/geo/tiger/TIGER2020/TABBLOCK20/tl_2020_06_tabblock20.zip"
if not os.path.exists("blocks_ca_south.parquet"):                  # California, about 380 MB, once
    blocks = gpd.read_file(TIGER, where="COUNTYFP20 IN ('027', '029', '037', '071')",
                           columns=["GEOID20", "COUNTYFP20", "POP20", "HOUSING20"])
    blocks.to_parquet("blocks_ca_south.parquet")
b = gpd.read_parquet("blocks_ca_south.parquet")
print(f"{len(b):,} blocks, {int(b.POP20.sum()):,} residents")
151,278 blocks, 13,123,914 residents
Example 1 — population by intensity class
import geopandas as gpd
from rasterio.transform import rowcol

blocks = gpd.read_parquet("blocks_ca_south.parquet").to_crs(4326)   # Kern, Inyo, San Bernardino, LA
pts = blocks.representative_point()
rows, cols = rowcol(transform, pts.x.values, pts.y.values)
rows, cols = np.array(rows), np.array(cols)
inside = (rows >= 0) & (rows < mmi.shape[0]) & (cols >= 0) & (cols < mmi.shape[1])
blocks = blocks.assign(mmi=np.where(inside, mmi[np.clip(rows, 0, mmi.shape[0] - 1),
                                                np.clip(cols, 0, mmi.shape[1] - 1)], np.nan))
bands = [(2, 3, "II–III barely felt"), (3, 4, "III–IV felt indoors"),
         (4, 5, "IV–V light"), (5, 6, "V–VI moderate"), (6, 7, "VI–VII strong"),
         (7, 12, "VII+ very strong")]
for lo, hi, name in bands:
    m = (blocks.mmi >= lo) & (blocks.mmi < hi)
    print(f"{name:20} {int(blocks.POP20[m].sum()):8,} residents in {int(m.sum()):5,} blocks")
print(f"outside the ShakeMap grid: {int(blocks.POP20[blocks.mmi.isna()].sum()):,}")
II–III barely felt 9,566 residents in 201 blocks
III–IV felt indoors 6,836,450 residents in 73,702 blocks
IV–V light 6,181,428 residents in 71,704 blocks
V–VI moderate 59,749 residents in 3,449 blocks
VI–VII strong 5,450 residents in 552 blocks
VII+ very strong 31,271 residents in 1,670 blocks
outside the ShakeMap grid: 0
Thirteen million people in four counties, and 36,721 of them in MMI VI or above. The distribution is the usual shape for a large earthquake in a sparsely populated area: almost everyone felt it, a few tens of thousands were shaken hard, and the two groups need completely different responses.
Example 2 — the shaking near the rupture
for level in (6, 7, 8):
    cells = mmi >= level
    area = cells.sum() * (abs(transform.a) * 111) * (abs(transform.e) * 111)
    print(f"MMI {level}+: {cells.sum():6,} cells, about {area:8,.0f} km²")
print(f"maximum MMI in the grid: {mmi.max():.2f}")
print(f"PGA at that cell: {grids['PGA'][np.unravel_index(mmi.argmax(), mmi.shape)]:.1f} %g")
MMI 6+: 1,769 cells, about 6,054 km²
MMI 7+: 767 cells, about 2,625 km²
MMI 8+: 285 cells, about 975 km²
maximum MMI in the grid: 8.70
PGA at that cell: 58.9 %g
Example 3 — which layer to use
peak = np.unravel_index(mmi.argmax(), mmi.shape)
for field in ("MMI", "PGA", "PGV", "PSA03", "PSA10"):
    g = grids[field]
    print(f"{field:6} at the strongest cell {g[peak]:8.2f}   "
          f"grid median {np.median(g):7.3f}   max {g.max():8.2f}")
MMI at the strongest cell 8.70 grid median 3.200 max 8.70
PGA at the strongest cell 58.92 grid median 0.307 max 73.52
PGV at the strongest cell 82.21 grid median 0.954 max 103.40
PSA03 at the strongest cell 120.60 grid median 0.682 max 140.80
PSA10 at the strongest cell 68.52 grid median 0.865 max 105.00
MMI is the one to join to people; PGA and spectral accelerations are the ones to join to structures, because building codes are written in them.
Intensity rather than distance
Why MMI and not distance
Ground motion depends on the rupture's geometry, its directivity, the path and the local soil. A ShakeMap folds all of that into a surface that can be irregular and strongly asymmetric — a site on soft sediment can shake harder than one closer to the epicentre on rock. Distance rings are a crude proxy for a field that ShakeMap already estimates properly.
Why the version matters
The first ShakeMap after an event is a model with almost no observations. Later versions incorporate station data, felt reports and, eventually, a finite-fault model, and the footprint can change substantially. An exposure figure is tied to the version it was computed from.
Why census blocks are the wrong size in both directions
A ShakeMap cell is roughly two kilometres; urban census blocks are a hundred metres, so many blocks share one cell and intensity is effectively constant across a neighbourhood. Rural blocks can be tens of kilometres across, so one block spans several cells and a single sampled value misrepresents it. Sampling at a representative point is defensible in the first case and rough in the second.
Several ShakeMaps, uncertainty and PAGER
- Several ShakeMaps can exist for one event from different networks; the preferred one is first in the list.
shape.zipholds the same intensity as polygons if you prefer vectors.- Uncertainty is published alongside as
uncertainty.xml; high uncertainty means few stations nearby. - ShakeMap Atlas provides retrospective maps for historic events.
- PAGER products give USGS's own exposure and loss estimates for comparison.
- The grid is in WGS 84; project before measuring areas.
Internal links
- Earthquake catalogues explained — the event the ShakeMap belongs to
- How to download and map an earthquake catalogue in Python — finding events
- How to count buildings and people exposed to a hazard zone — exposure methods
- Hazard, exposure and vulnerability explained — where intensity fits
- How to extract raster values at point locations — sampling a grid
- Census geographies explained — the exposure units
FAQ
What is in a ShakeMap?
Estimated ground motion on a grid: macroseismic intensity, peak ground acceleration and velocity, and spectral accelerations.
How do I read grid.xml in Python?
Parse the specification attributes for the geometry, read the data block into an array, and reshape to (nlat, nlon).
Which layer should I use for exposure?
MMI for people and general damage expectations; PGA and spectral accelerations for engineering.
How big is a ShakeMap cell?
About one arc-minute, roughly 1.9 km in latitude.
Do ShakeMaps change?
Yes. They are revised as station and felt-report data arrive; record the version.
Can I get ShakeMaps for old earthquakes?
Yes, through the ShakeMap Atlas for significant historic events.