
Ground Motion Explained: Magnitude, Intensity, PGA and PGV
On this page
Problem statement
An earthquake has one magnitude but a different shaking at every place it reaches, and the words for the two get mixed up constantly. Magnitude measures the size of the source; ground motion measures what happens at a site, as peak ground acceleration (PGA), peak ground velocity (PGV), spectral accelerations at different periods, or intensity on the Modified Mercalli scale, which describes effects on people and buildings. Each measures something different, they relate to one another only on average, and the relationship changes with distance and site.
This page uses the ShakeMap station list and grid of one earthquake, the 2019 M7.1 Ridgecrest, California, earthquake, to show how much ground motion varies for a single magnitude, how PGA and PGV relate, how intensity is derived from them, and how the shape of shaking changes from short to long periods with distance.
Quick answer
One magnitude, a thousandfold range of shaking:
print(f"magnitude: M{ev['properties']['mag']} ({ev['properties']['magType']})")
print(f"PGA at {len(st)} stations: {st.pga.min():.3f} to {st.pga.max():.1f} % of g")
print(f"PGV: {st.pgv.min():.2f} to {st.pgv.max():.1f} cm/s; intensity: {st.intensity.min():.1f} to {st.intensity.max():.1f}")
magnitude: M7.1 (mw)
PGA at 701 stations: 0.018 to 56.9 % of g
PGV: 0.09 to 74.8 cm/s; intensity: 1.8 to 8.4
One moment magnitude, 7.1, produced PGA from 0.018% to 56.9% of g at these stations, a factor of more than 3,000; PGV from 0.09 to 74.8 cm/s; and intensities from 1.8, barely felt, to 8.4, heavy damage to ordinary structures.
PGA and PGV, from motion to intensity, periods
1. PGA and PGV
Acceleration is dominated by short-period, high-frequency waves, velocity by longer periods. Their ratio grows with distance, because high frequencies are absorbed faster:
st["ratio"] = st.pgv / (st.pga / 100 * 981)                      # PGV (cm/s) over PGA (cm/s²), in seconds
print(f"correlation of log PGA and log PGV: {np.corrcoef(np.log(st.pga), np.log(st.pgv))[0, 1]:.2f}")
print(st.groupby(pd.cut(st.rrup, [0, 50, 100, 200, 400, 900]), observed=True).ratio.agg(["size", "median"]).round(3).to_string())
correlation of log PGA and log PGV: 0.90
size median
rrup
(0, 50] 10 0.119
(50, 100] 24 0.093
(100, 200] 236 0.151
(200, 400] 299 0.306
(400, 900] 132 0.451
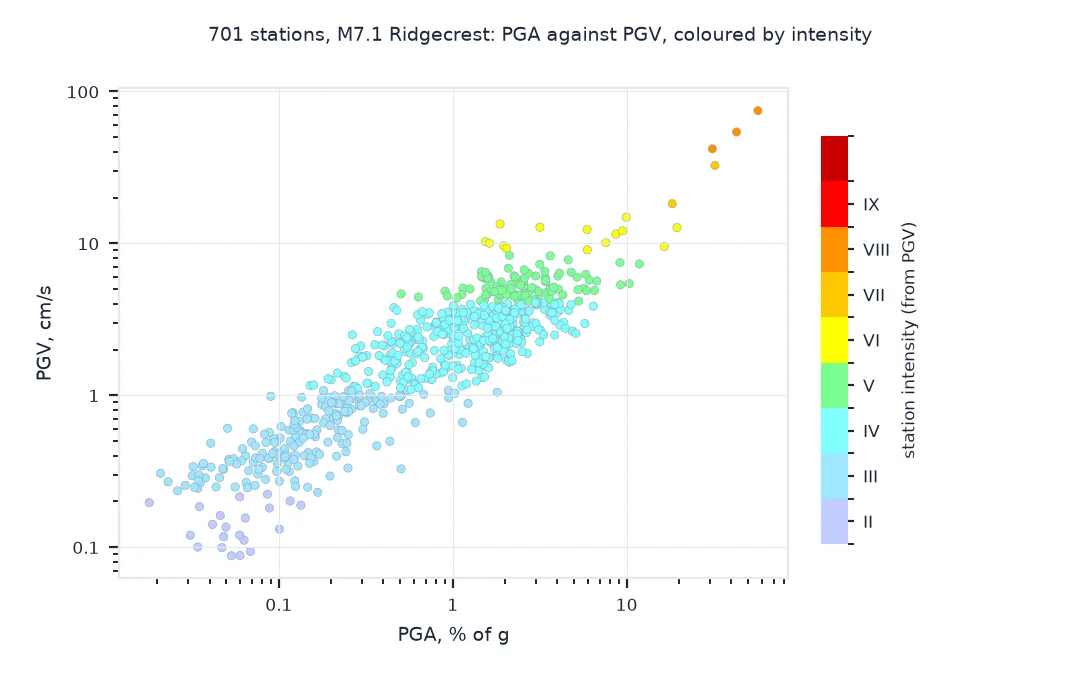
PGA and PGV are strongly correlated, 0.90 in logarithms, but not interchangeable. Their ratio, in seconds, rises with distance from about 0.1 s within 100 km to 0.31 s at 200–400 km and 0.45 s beyond 400 km: far from the rupture, velocity holds up while acceleration falls away.
2. From ground motion to intensity
ShakeMap converts PGA and PGV to intensity with empirical relations and reports both for every station. Compare them with the intensity the station is given:
for k in ("pga", "pgv"):
    d = st.intensity - st[f"mmi_{k}"]
    print(f"MMI from {k.upper()}: mean difference from the station intensity {d.mean():+.2f}, largest {d.abs().max():.2f}")
lo, hi = st[st.intensity < 5], st[st.intensity >= 5]
print(f"intensity < 5: closer to the PGA value in {(abs(lo.intensity - lo.mmi_pga) < abs(lo.intensity - lo.mmi_pgv)).mean():.0%} of {len(lo)} stations; "
      f">= 5: closer to PGV in {(abs(hi.intensity - hi.mmi_pgv) < abs(hi.intensity - hi.mmi_pga)).mean():.0%} of {len(hi)}")
MMI from PGA: mean difference from the station intensity +0.47, largest 2.07
MMI from PGV: mean difference from the station intensity -0.00, largest 0.05
intensity < 5: closer to the PGA value in 4% of 655 stations; >= 5: closer to PGV in 100% of 46
Each station's intensity equals the value converted from its PGV, to within 0.05 everywhere: this ShakeMap derives station intensity from velocity. The PGA-based conversion gives values 0.47 lower on average, and up to 2.07 lower; it is closer to the assigned intensity at only 4% of stations below intensity 5. The two conversions disagree most where acceleration is low relative to velocity, which far from the source is almost everywhere.
3. Short and long periods
Spectral acceleration is the peak response of an oscillator with a given natural period, a stand-in for a building of that height. Compare 0.3, 1 and 3 seconds with PGA across the grid:
G["dist_band"] = pd.cut(G.dist_km, [0, 25, 100, 300, 600])
ratios = G.groupby("dist_band", observed=True)[["PSA03", "PSA10", "PSA30"]].median().div(G.groupby("dist_band", observed=True).PGA.median(), axis=0)
print(ratios.round(2).rename(columns={"PSA03": "SA(0.3)/PGA", "PSA10": "SA(1.0)/PGA", "PSA30": "SA(3.0)/PGA"}).to_string())
SA(0.3)/PGA SA(1.0)/PGA SA(3.0)/PGA
dist_band
(0, 25] 1.88 0.90 0.24
(25, 100] 2.01 0.77 0.19
(100, 300] 2.15 1.65 0.49
(300, 600] 2.34 3.33 1.20
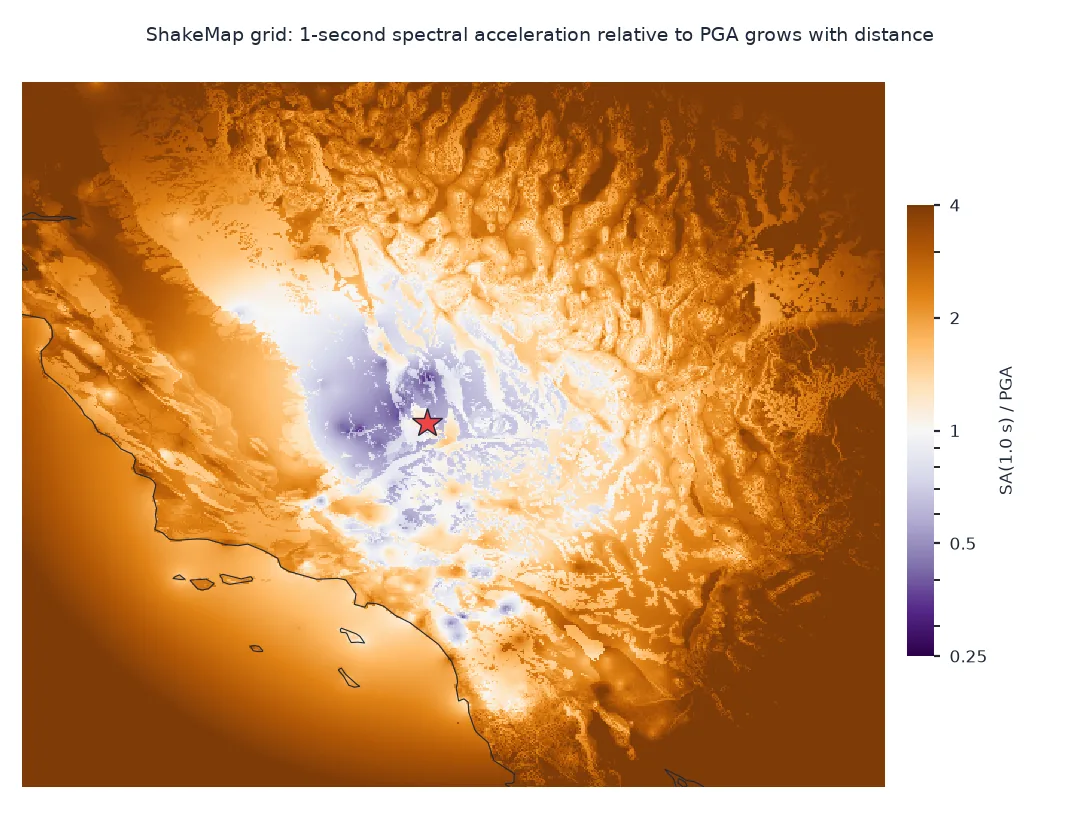
Near the rupture, the 0.3-second spectral acceleration is about twice PGA, the 1-second value slightly less than PGA and the 3-second value a quarter of it. With distance the long periods gain: at 300–600 km, SA(1.0) is 3.3 times PGA and SA(3.0) 1.2 times. Far away, a building with a natural period of a second responds to this earthquake more strongly, relative to the ground's acceleration, than one near the fault.
What the intensity numbers mean
The data used on this page
The preferred ShakeMap for the M7.1 Ridgecrest earthquake of 6 July 2019 (USGS event ci38457511): its stationlist.json, for seismic stations with PGA, PGV and intensity and no flagged amplitude, and its grid.xml. Distances on the grid are measured from the epicentre with a local projection. PGA and spectral accelerations are in percent of g, PGV in cm/s.
import io
import json
import xml.etree.ElementTree as ET
from pathlib import Path

import numpy as np
import pandas as pd
import requests
from pyproj import Transformer

Path("data").mkdir(exist_ok=True)
EV = "ci38457511"
def cached(path, url, **params):
    p = Path(path)
    if not p.exists():
        r = requests.get(url, params=params, timeout=600)
        r.raise_for_status()
        p.write_bytes(r.content)
    return p
ev = json.loads(cached(f"data/{EV}.json", "https://earthquake.usgs.gov/fdsnws/event/1/query", eventid=EV, format="geojson").read_text())
sm = ev["properties"]["products"]["shakemap"][0]
raw = json.loads(cached(f"data/{EV}_shakemap_{sm['source']}_stationlist.json", sm["contents"]["download/stationlist.json"]["url"]).read_text())
rows = []
for f in raw["features"]:
    q = f["properties"]
    if q["station_type"] != "seismic" or any(a.get("flag", "0") not in ("0", "") for ch in q["channels"] for a in ch["amplitudes"]):
        continue
    conv = {x["name"]: x["value"] for x in q.get("mmi_from_pgm", [])}
    rows.append({"pga": q["pga"], "pgv": q["pgv"], "intensity": q["intensity"], "rrup": q["distances"]["rrup"],
                 "mmi_pga": conv.get("pga"), "mmi_pgv": conv.get("pgv")})
st = pd.DataFrame(rows).apply(pd.to_numeric, errors="coerce").dropna()
st = st[(st.pga > 0) & (st.pgv > 0)].reset_index(drop=True)
root = ET.parse(cached(f"data/{EV}_shakemap_{sm['source']}_grid.xml", sm["contents"]["download/grid.xml"]["url"])).getroot()
NS = {"s": "http://earthquake.usgs.gov/eqcenter/shakemap"}
G = pd.read_csv(io.StringIO(root.find("s:grid_data", NS).text), sep=r"\s+", header=None, names=[f.attrib["name"] for f in root.findall("s:grid_field", NS)])
lon0, lat0 = ev["geometry"]["coordinates"][:2]
tr = Transformer.from_crs(4326, f"+proj=aeqd +lat_0={lat0} +lon_0={lon0}", always_xy=True)
x, y = tr.transform(G.LON.values, G.LAT.values)
G["dist_km"] = np.hypot(x, y) / 1000
print(f"{len(st)} stations with PGA, PGV and intensity; grid {len(G):,} points to {G.dist_km.max():.0f} km")
701 stations with PGA, PGV and intensity; grid 275,394 points to 656 km
701 seismic stations have a PGA, a PGV and an intensity with no flagged amplitude. The grid's 275,394 points reach 656 km from the epicentre.
Example 1: what the intensity numbers mean
Count stations by intensity and give the median PGA and PGV in each, in the units ShakeMap uses:
st["mmi"] = st.intensity.round().astype(int)
print(st.groupby("mmi").agg(stations=("pga", "size"), median_pga=("pga", "median"), median_pgv=("pgv", "median")).round(2).to_string())
stations median_pga median_pgv
mmi
2 32 0.06 0.19
3 185 0.15 0.56
4 381 1.33 2.45
5 84 2.50 5.24
6 15 5.94 11.51
7 1 32.19 32.57
8 3 42.87 54.12
Most stations recorded intensity 3 or 4, light shaking felt indoors; only 19 recorded 6 or more. Median PGA and PGV rise steeply with intensity: 0.15% of g and 0.56 cm/s at intensity 3, 5.94% of g and 11.5 cm/s at 6, and 42.9% of g and 54 cm/s at 8, at three stations within 16 km of the rupture.
Magnitude belongs to the earthquake, motion to the site
Magnitude is a property of the earthquake: moment magnitude is computed from the seismic moment, the rigidity of the rock times the fault area times the average slip. Ground motion is a property of a place during that earthquake, and depends on distance, the path through the crust, the local soil and rock, and the direction of rupture. That is why one M7.1 produced accelerations from a few hundredths of a percent of g to more than half of g: a factor of more than a thousand.
The measures differ in which part of the shaking they capture. PGA follows the highest frequencies and matters most for short, stiff structures and for equipment; PGV follows intermediate periods and correlates better with damage to ordinary buildings, and in this ShakeMap every station's intensity is the value derived from its PGV; spectral accelerations describe the response of oscillators of particular periods, and building codes design to them. Intensity is different in kind: a description of effects, assigned from observations or estimated from ground motion with empirical relations whose scatter, as the station list reports it for PGA and PGV, is 0.63 to 0.66 intensity units. As distance grows, high frequencies die out first, so far from an earthquake the shaking is slower, longer and relatively richer in long periods, which is why distant tall buildings can sway when people on the ground feel little.
Units, components and intensity scales
- Units: ShakeMap gives PGA and spectral acceleration in percent of g and PGV in cm/s; hazard models use g. See the PGA units fix.
- Component definitions: PGA can be the larger horizontal component, the geometric mean or an orientation-independent measure; values differ by 10–20%.
- Magnitude scales: local, body-wave and surface-wave magnitudes saturate for large earthquakes; moment magnitude does not.
- Intensity scales: Modified Mercalli in the US, EMS-98 in Europe, JMA in Japan; they are not interchangeable.
Internal links
- How to fit ground-motion attenuation to ShakeMap stations in Python — how shaking falls with distance
- How to map "Did You Feel It?" earthquake intensity reports in Python — intensity from people
- Seismic hazard explained — ground motion in hazard models
FAQ
What is the difference between magnitude and intensity?
Magnitude measures the size of the earthquake at its source and is one number; intensity describes the shaking and its effects at a particular place and varies from place to place.
What is PGA?
Peak ground acceleration: the largest acceleration of the ground recorded at a site during an earthquake, usually given in g or percent of g.
Is PGA or PGV better for damage?
PGV correlates better with damage to typical buildings at moderate to strong shaking; PGA matters more for weak shaking and stiff structures.
Why do distant tall buildings sway in an earthquake?
High-frequency shaking is absorbed faster with distance, so far away the remaining motion is dominated by long periods, close to the natural periods of tall buildings.