
How to Compare ShakeMap Station Data with the Grid in Python
On this page
Problem statement
A ShakeMap looks like a continuous picture of shaking, but it is built from points: seismic stations that recorded the earthquake, intensity reports converted into ground motion, and a ground-motion model that fills the gaps. Each ShakeMap publishes those points in stationlist.json, with every station's peak ground acceleration (PGA), velocity, intensity, distances and site conditions. Reading it shows where the map is anchored by measurements and where it is a model, which matters for anyone using the grid at a particular site.
This page reads the station list of the preferred ShakeMap for the 2019 M7.1 Ridgecrest earthquake, flattens it into a table, compares each station's recorded PGA with the grid value at the same place, and measures how much of the map lies far from any instrument.
Quick answer
Load stationlist.json as GeoJSON features and pull out the properties you need:
print(S.station_type.value_counts().to_dict())
seis = S[S.station_type == "seismic"].dropna(subset=["pga"])
top = seis.loc[seis.pga.idxmax()]
print(f"seismic stations with PGA: {len(seis)}; networks {seis.network.value_counts().head(5).to_dict()}")
print(f"largest PGA {top.pga:.1f} %g at {top.network}.{top.code} ({top["name"]}), {top.rrup:.1f} km from the rupture")
{'macroseismic': 4177, 'seismic': 943}
seismic stations with PGA: 854; networks {'CI': 316, 'NC': 210, 'CE': 148, 'NP': 123, 'AZ': 12}
largest PGA 56.9 %g at CI.CCC (Christmas Canyon China Lake), 5.5 km from the rupture
Of the 5,120 entries, 4,177 are Did You Feel It? intensity boxes and 943 are seismic stations, 854 of them with a PGA. Most belong to the Southern California Seismic Network (CI, 316), the Northern California network (NC, 210), the California Geological Survey's strong-motion network (CE, 148) and the USGS National Strong Motion Project (NP, 123). The strongest recording, 56.9% of g, was at Christmas Canyon near China Lake, 5.5 km from the rupture. Note top["name"] rather than top.name: on a pandas row, .name is the row's index label.
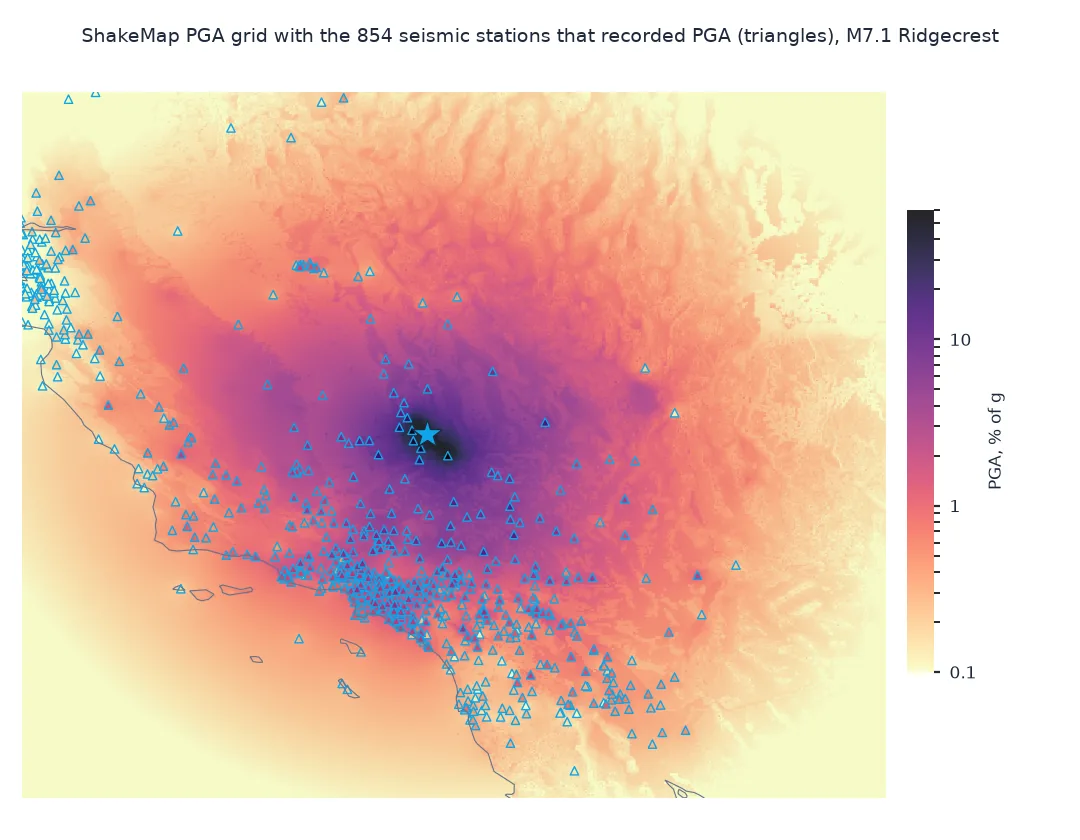
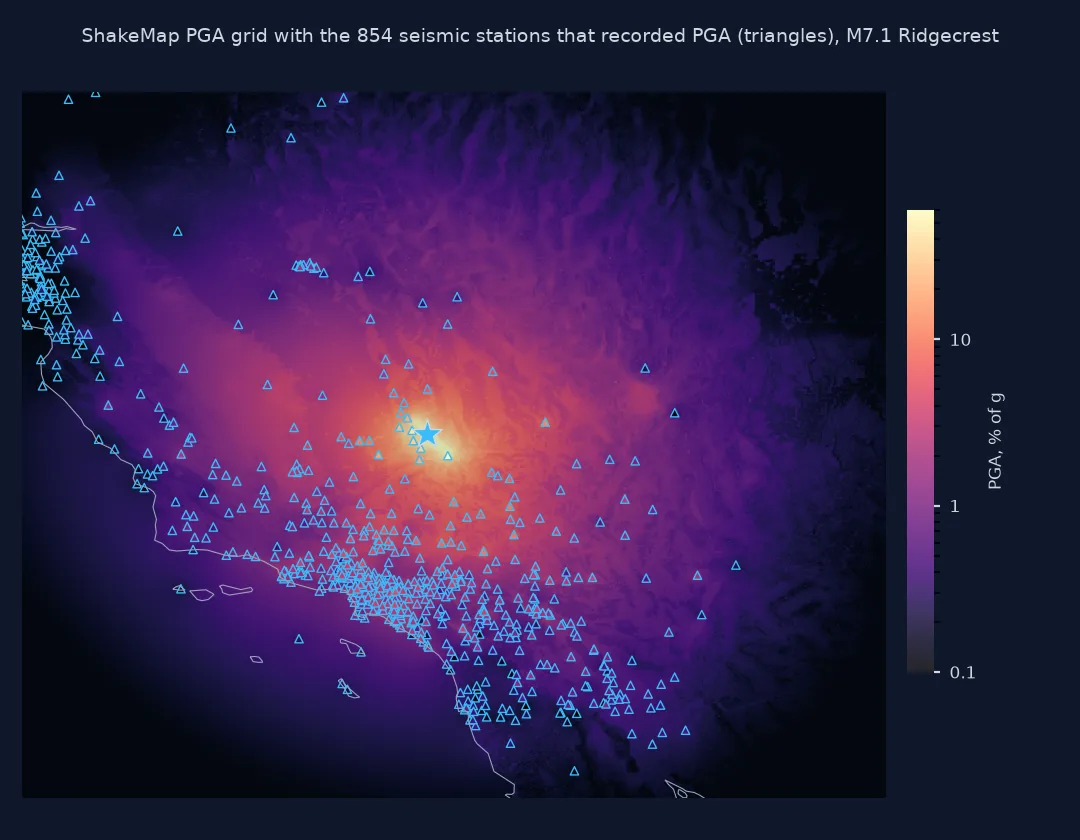
Flatten features, station against grid, gaps without stations
1. Flatten the features
Each feature has nested properties: per-channel amplitudes, distances in several metrics, and model predictions. Keep the station-level values and the distances:
print(seis[["network", "code", "pga", "pgv", "intensity", "rrup", "vs30"]].describe().loc[["count", "min", "50%", "max"]].round(2).to_string())
flagged = sum(any(a.get("flag", "0") not in ("0", "") for ch in f["properties"]["channels"] for a in ch["amplitudes"])
              for f in raw["features"] if f["properties"]["station_type"] == "seismic")
print(f"seismic stations with at least one flagged amplitude: {flagged}")
pga pgv intensity rrup vs30
count 854.00 727.00 846.0 854.00 854.00
min 0.00 0.08 1.0 5.49 141.02
50% 0.58 2.03 3.7 234.84 405.41
max 56.91 74.78 8.4 858.90 860.63
seismic stations with at least one flagged amplitude: 235
Recorded PGA runs from nearly zero at the farthest stations, 859 km away, to 56.91% of g, with a median of 0.58%. Fewer stations have a PGV, 727, than a PGA. Site conditions range from soft soil, a Vs30 of 141 m/s, to rock at 861 m/s. A quarter of the seismic stations, 235, have at least one amplitude that ShakeMap flagged and did not use.
2. Station against grid
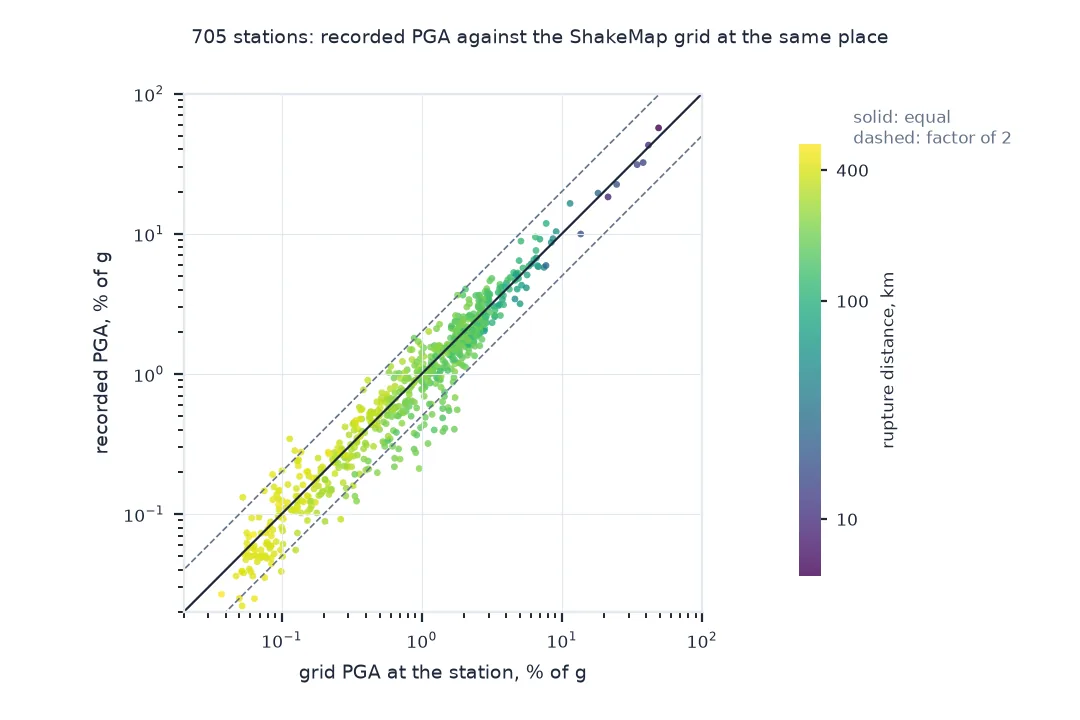
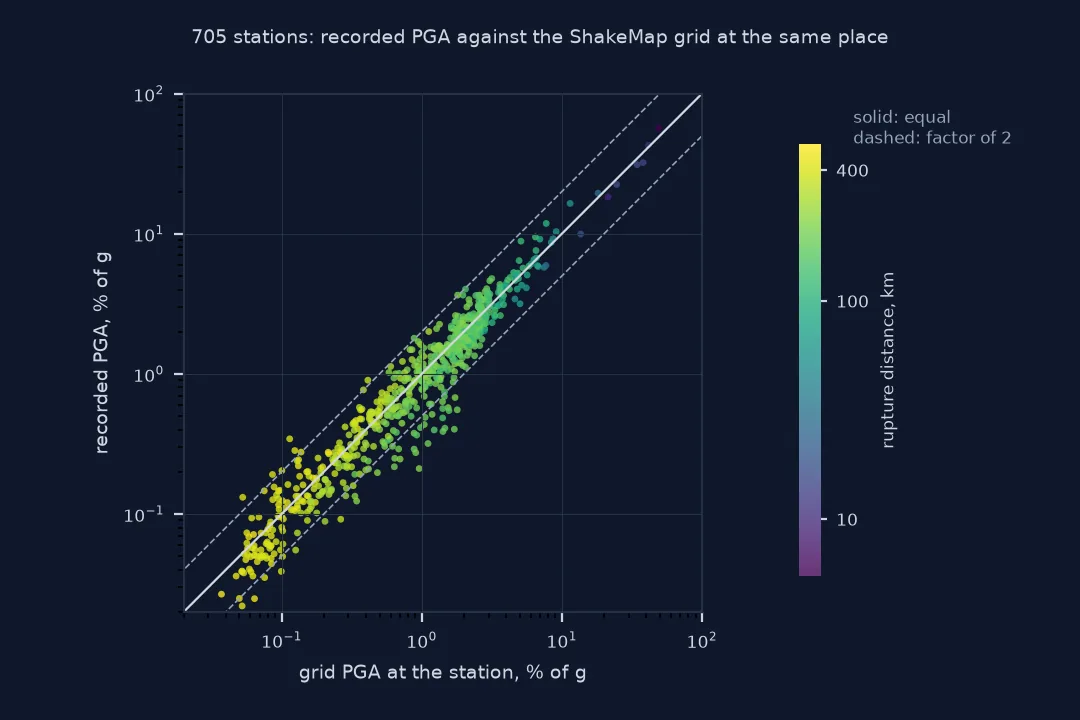
ShakeMap conditions its grid on the stations, so at a station the grid should be close to the recording. Sample the grid's PGA at each station:
tree = cKDTree(G[["LON", "LAT"]].values)
d, i = tree.query(seis[["lon", "lat"]].values)
on = seis[d < 0.02].assign(grid=G.PGA.values[i[d < 0.02]])
on["ratio"] = np.log(on.pga / on.grid)
print(f"stations inside the grid: {len(on)} of {len(seis)}")
print(on.groupby(pd.cut(on.rrup, [0, 25, 50, 100, 200, 400]), observed=True).ratio.agg(["size", "mean", "std"]).round(2).to_string())
print(f"stations within a factor of 1.5 of the grid: {(on.ratio.abs() < np.log(1.5)).mean():.0%}; within a factor of 2: {(on.ratio.abs() < np.log(2)).mean():.0%}")
stations inside the grid: 705 of 854
size mean std
rrup
(0, 25] 7 -0.09 0.15
(25, 50] 4 -0.15 0.16
(50, 100] 25 -0.06 0.20
(100, 200] 245 -0.12 0.33
(200, 400] 327 -0.09 0.36
stations within a factor of 1.5 of the grid: 81%; within a factor of 2: 93%
705 stations fall inside the grid. On average the recorded PGA is slightly below the grid value at the station, by 6% to 14% depending on distance (a mean log ratio of -0.06 to -0.15), with a spread that grows from 0.15 near the rupture to 0.36 far away. 81% of stations are within a factor of 1.5 of the grid and 93% within a factor of 2: the grid is pulled close to the recordings, but not onto them, because each recording carries its own uncertainty.
3. Where the grid has no station
Measure each grid point's distance to the nearest seismic station, for the part of the map with strong shaking:
strong = G[G.MMI >= 6]
sd, _ = cKDTree(seis[["lon", "lat"]].values * [np.cos(np.radians(35.8)), 1]).query(strong[["LON", "LAT"]].values * [np.cos(np.radians(35.8)), 1])
km = sd * 111.32
print(f"grid points at MMI 6+: {len(strong):,}")
for r in (5, 10, 20, 40):
    print(f"within {r:>2} km of a seismic station: {(km <= r).mean():.0%}")
grid points at MMI 6+: 1,769
within 5 km of a seismic station: 12%
within 10 km of a seismic station: 34%
within 20 km of a seismic station: 71%
within 40 km of a seismic station: 99%
Of the 1,769 grid points with strong shaking, intensity 6 or more, only 12% are within 5 km of a seismic station and 34% within 10 km. 29% are more than 20 km from any station: there, the map's values come mainly from the ground-motion model and the intensity reports.
The strongest Ridgecrest recordings
The data used on this page
The preferred ShakeMap for the M7.1 Ridgecrest earthquake of 6 July 2019 (USGS event ci38457511): its stationlist.json and grid.xml, located through the event's entry in the USGS FDSN event service. PGA in both files is in percent of g.
import io
import json
import xml.etree.ElementTree as ET
from pathlib import Path

import numpy as np
import pandas as pd
import requests
from scipy.spatial import cKDTree

Path("data").mkdir(exist_ok=True)
EV = "ci38457511"
p = Path(f"data/{EV}.json")
if not p.exists():
    r = requests.get("https://earthquake.usgs.gov/fdsnws/event/1/query", params={"eventid": EV, "format": "geojson"}, timeout=120)
    r.raise_for_status()
    p.write_text(r.text)
ev = json.loads(p.read_text())
def product_file(kind, name):
    pr = ev["properties"]["products"][kind][0]
    out = Path(f"data/{EV}_{kind}_{pr['source']}_{Path(name).name}")
    if not out.exists():
        r = requests.get(pr["contents"][name]["url"], timeout=600)
        r.raise_for_status()
        out.write_bytes(r.content)
    return out, pr
st_path, shakemap = product_file("shakemap", "download/stationlist.json")
raw = json.loads(st_path.read_text())
S = pd.DataFrame([{**{k: f["properties"].get(k) for k in ("code", "name", "network", "station_type", "pga", "pgv", "intensity", "vs30")},
                   "rrup": f["properties"]["distances"]["rrup"], "lon": f["geometry"]["coordinates"][0], "lat": f["geometry"]["coordinates"][1]}
                  for f in raw["features"]])
S[["pga", "pgv", "intensity", "vs30"]] = S[["pga", "pgv", "intensity", "vs30"]].apply(pd.to_numeric, errors="coerce")
grid_path, _ = product_file("shakemap", "download/grid.xml")
root = ET.parse(grid_path).getroot()
NS = {"s": "http://earthquake.usgs.gov/eqcenter/shakemap"}
G = pd.read_csv(io.StringIO(root.find("s:grid_data", NS).text), sep=r"\s+", header=None,
                names=[f.attrib["name"] for f in root.findall("s:grid_field", NS)])
print(f"ShakeMap '{shakemap['source']}' version {shakemap['properties']['version']}: {len(S):,} stations, {len(G):,} grid points")
ShakeMap 'atlas' version 1: 5,120 stations, 275,394 grid points
The preferred ShakeMap, from the ShakeMap Atlas, lists 5,120 stations alongside its 275,394 grid points.
Example 1: the strongest recordings
List the five largest recorded PGAs with their distances and the grid value at each:
cols = ["network", "code", "name", "rrup", "pga", "grid", "vs30"]
print(on.nlargest(5, "pga")[cols].round(1).to_string(index=False))
network code name rrup pga grid vs30
CI CCC Christmas Canyon China Lake 5.5 56.9 49.0 474.4
CI TOW2 Tower 2 9.7 42.9 41.5 326.1
CI Q0072 Lakeland Street, Ridgecrest CA 14.4 32.2 38.0 259.8
CI SRT Snort 15.6 31.1 34.4 265.1
CI WNM Nine Mile Canyon 17.0 22.5 24.6 293.2
The five strongest recordings are all within 17 km of the rupture, from 56.9% of g at Christmas Canyon down to 22.5% at Nine Mile Canyon. Their grid values differ by up to 7.9 percentage points: the grid is 49.0% where Christmas Canyon recorded 56.9%, and 38.0% where Lakeland Street in Ridgecrest recorded 32.2%. All five sites are soil or soft rock, with Vs30 from 260 to 474 m/s.
Three sources combined into one map
ShakeMap combines three sources. Recorded ground motions at seismic stations are the most direct; intensity reports from Did You Feel It? are converted into ground motion where stations are sparse; and a ground-motion prediction equation, adjusted by the event's own data, supplies values everywhere else. Since version 4, ShakeMap does this by conditioning: it treats the model's prediction and the observations as a multivariate normal field and computes the expected value at every grid point given the observations, with an uncertainty that shrinks near stations and grows away from them.
That is why the grid matches the stations closely where they are and why the comparison is not an independent check. What it does show is how much of the map is anchored: near a dense network, the grid is close to a measurement; tens of kilometres from the nearest station, it is the model, and site effects, rupture directivity and basin effects that the model does not capture can make the real shaking quite different.
Units, flagged amplitudes and macroseismic stations
- Units: PGA in ShakeMap files is in percent of g; 25 means 0.25 g. See the PGA units fix.
- Flagged amplitudes: ShakeMap marks channels it rejected, for example clipped or outlying records; a non-zero flag in a channel means that amplitude was not used.
- Macroseismic stations: the DYFI entries in the station list are intensity observations at box centres, not instruments.
- Versions: an event can have several ShakeMaps from different sources; the first in the event's product list is the preferred one.
Internal links
- How to read a USGS ShakeMap and find who was shaken — the grid itself
- How to fit ground-motion attenuation to ShakeMap stations in Python — the same stations against distance
- How to map "Did You Feel It?" earthquake intensity reports in Python — the other input
FAQ
What is in a ShakeMap station list?
Every observation used to make the map: seismic stations with their peak ground acceleration, velocity, spectral accelerations and intensity, Did You Feel It? intensity boxes, and each station's distances and model predictions.
How do I read stationlist.json in Python?
Load it with json, loop over features, and take each feature's properties and geometry; nested values such as distances are dictionaries inside the properties.
Why does the ShakeMap grid match the stations?
Because the grid is conditioned on them: at a station the estimate is pulled close to the recording.
How reliable is a ShakeMap far from stations?
Less: there it is mostly the ground-motion model, whose uncertainty for PGA, as listed in each station's predictions, is a standard deviation of about 0.62 in natural-log units at most stations of this map: one standard deviation is a factor of 1.9.