
Street Tree Censuses Explained: What a Tree Record Holds and Who Made It
On this page
Problem statement
A street tree census record looks like simple facts — a species, a size, a health rating — but each field is the outcome of a measurement protocol and of a person applying it. Diameter is measured at a fixed height and rounded; health is a judgement of the crown; problems are ticked from a checklist; and the people doing it ranged from city foresters to first-time volunteers. Two censuses ten years apart used different protocols, so their fields do not mean quite the same things.
This page explains what a record in New York's 2015 street tree census holds, field by field, with the distributions behind each, who made the records and when, and how the 2005 census differs.
Quick answer
List the fields of a living-tree record with how many distinct values each takes and how often it is filled:
alive = trees[trees.status == "Alive"]
fields = {"species": "spc_common", "trunk diameter (in)": "tree_dbh", "health": "health", "curb location": "curb_loc",
          "steward signs": "steward", "tree guard": "guards", "sidewalk": "sidewalk", "problems": "problems"}
print(pd.DataFrame({k: [alive[v].nunique(), alive[v].notna().mean()] for k, v in fields.items()},
                   index=["distinct values", "filled"]).T.round(3).to_string())
distinct values filled
species 132.0 1.000
trunk diameter (in) 145.0 1.000
health 3.0 1.000
curb location 2.0 1.000
steward signs 3.0 0.252
tree guard 3.0 0.122
sidewalk 2.0 1.000
problems 231.0 0.346
Species, diameter, health, curb location and sidewalk are filled for every living tree. Steward signs, tree guards and problems look mostly empty — 25.2%, 12.2% and 34.6% filled — but they are not: the file says "None" for trees without them, and pandas reads that word as missing by default. Step 3 shows the word in the file.
The fields and the people
1. Diameter at breast height
print(f"DBH in whole inches: {(alive.tree_dbh == alive.tree_dbh.round()).mean():.1%}; median {alive.tree_dbh.median():.0f} in")
print((alive.tree_dbh // 6 * 6).clip(upper=48).value_counts().sort_index().rename(lambda b: f"{b:.0f}-{b + 5:.0f}").to_string())
DBH in whole inches: 100.0%; median 10 in
tree_dbh
0-5 191807
6-11 192051
12-17 124330
18-23 73072
24-29 42522
30-35 20193
36-41 6328
42-47 1305
48-53 565
Diameter at breast height (DBH) is the trunk's diameter at a standard height above the ground, recorded in whole inches for every tree. The distribution is a young urban forest's: 191,807 trees under 6 inches, fewer in each larger class, and only 565 of 48 inches or more.
2. Health is a judgement
print(pd.crosstab(alive.spc_common.where(alive.spc_common.isin(alive.spc_common.value_counts().index[:6]), "other"),
                  alive.health, normalize="index").round(3).to_string())
health Fair Good Poor
spc_common
Callery pear 0.149 0.816 0.035
London planetree 0.132 0.843 0.025
Norway maple 0.268 0.621 0.111
honeylocust 0.133 0.848 0.019
littleleaf linden 0.149 0.793 0.058
other 0.147 0.808 0.045
pin oak 0.120 0.857 0.023
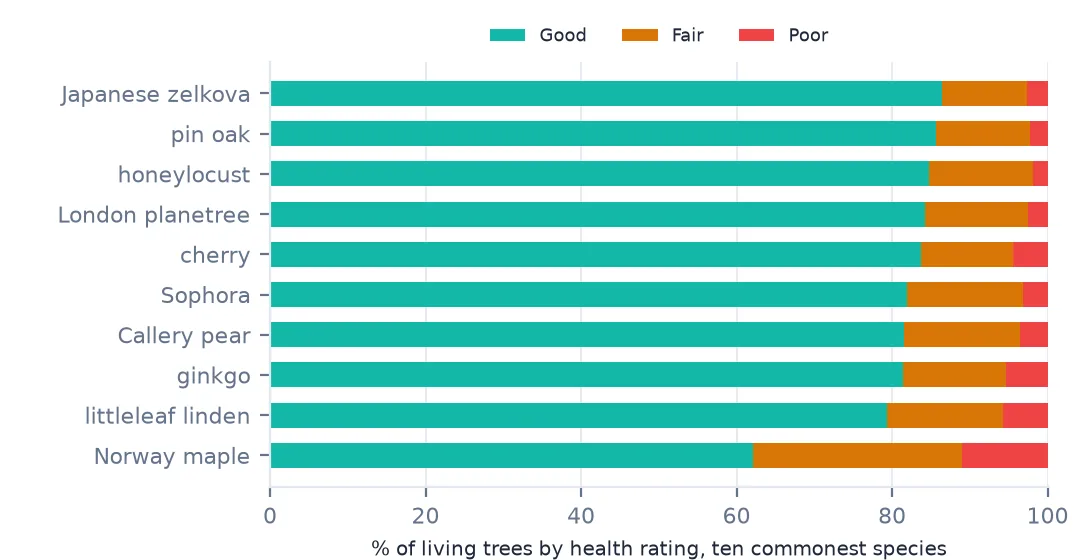
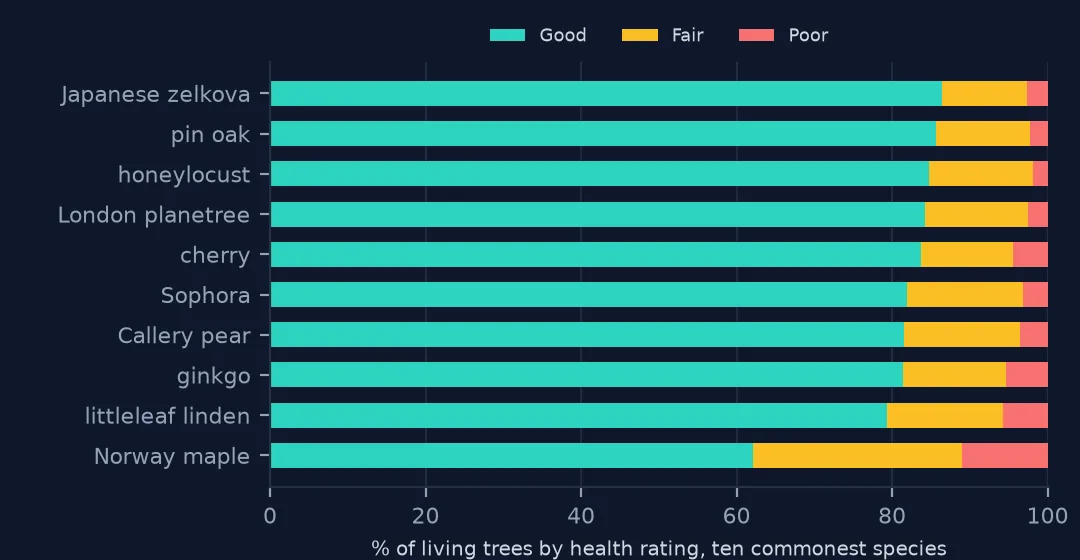
Health is Good, Fair or Poor, judged from the crown, and it varies by species far more than by anything else in the file: 26.8% of Norway maples were Fair and 11.1% Poor, against 12.0% and 2.3% for pin oaks. The Norway maple is the city's most troubled common tree.
3. Problems as a list in one field
probs = alive.problems.fillna("").str.split(",").explode().str.strip()
print(probs[probs.ne("") & probs.ne("None")].value_counts().head(8).to_string())
flags = [c for c in alive.columns if c.startswith(("root_", "trunk_", "trnk_", "brch_"))]
print(f"{len(flags)} yes/no flag columns: {flags}")
literal = pd.read_csv(f, usecols=["status", "steward", "guards", "problems"], keep_default_na=False)
literal = literal[literal.status == "Alive"]
print("the word 'None' in the file, read as text:", {c: f"{(literal[c] == 'None').mean():.1%}" for c in ["steward", "guards", "problems"]})
problems
Stones 139999
BranchLights 62365
TrunkOther 32573
RootOther 30322
BranchOther 24355
WiresRope 13274
MetalGrates 3536
TrunkLights 1031
9 yes/no flag columns: ['root_stone', 'root_grate', 'root_other', 'trunk_wire', 'trnk_light', 'trnk_other', 'brch_light', 'brch_shoe', 'brch_other']
the word 'None' in the file, read as text: {'steward': '74.8%', 'guards': '87.8%', 'problems': '65.4%'}
The problems field is a comma-separated list of the checklist items that applied; the same information is spread over nine yes/no columns. Stones in the tree pit is by far the most common problem, ticked for 139,999 trees, then lights wrapped in the branches. And the "missing" values are words: 74.8% of living trees have "None" for steward signs, 87.8% for guards and 65.4% for problems. Read these columns with keep_default_na=False, or fill the gaps back with "None".
4. Who made the record
print(trees.user_type.value_counts().to_string())
print(pd.to_datetime(trees.created_at).dt.to_period("Q").value_counts().sort_index().to_string())
user_type
TreesCount Staff 296284
Volunteer 217518
NYC Parks Staff 169986
created_at
2015Q2 39430
2015Q3 213650
2015Q4 256445
2016Q1 9472
2016Q2 55576
2016Q3 109189
2016Q4 26
Freq: Q-DEC
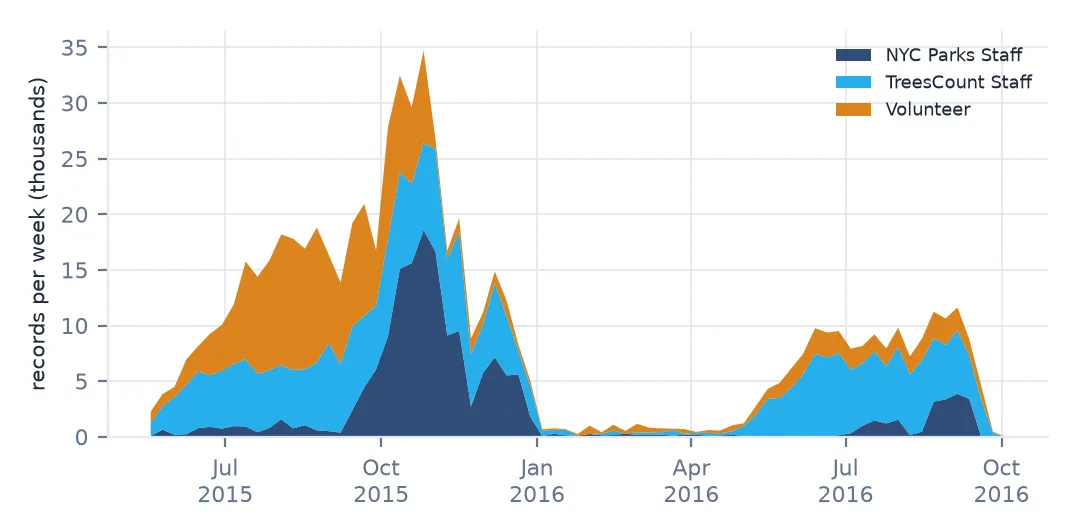
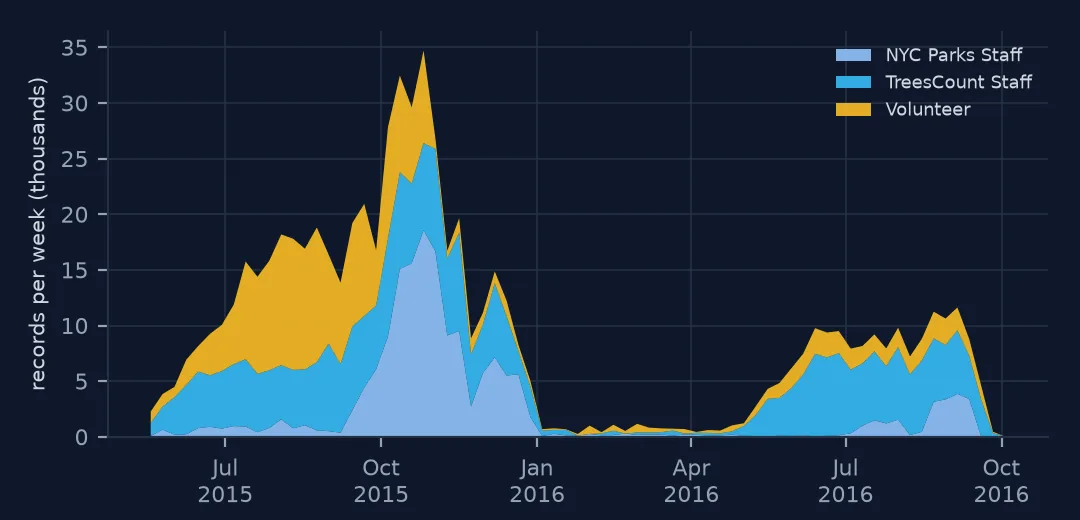
TreesCount census staff made 296,284 records, volunteers 217,518 and Parks Department staff 169,986. The survey ran from May 2015 to late 2016 with a gap in winter, when trees without leaves are hard to identify and their crowns impossible to rate.
The 2005 census and the dead
The data used on this page
New York City Department of Parks and Recreation, TreesCount! 2015 Street Tree Census on NYC Open Data: one row for every street tree, stump and dead tree mapped by staff and volunteers in 2015–2016, with species, trunk diameter, health and site conditions. The 2005 census, for comparison of what was recorded, is NYC Open Data dataset 29bw-z7pj.
from pathlib import Path

import numpy as np
import pandas as pd
import requests

Path("data").mkdir(exist_ok=True)
SOCRATA = "https://data.cityofnewyork.us/api/views/{}/rows.csv?accessType=DOWNLOAD"
f = Path("data/nyc-street-tree-census-2015.csv")
if not f.exists():
    # TreesCount! 2015, the finished census (220 MB), NYC Open Data dataset uvpi-gqnh
    f.write_bytes(requests.get(SOCRATA.format("uvpi-gqnh"), timeout=1800).content)
f05 = Path("data/nyc-street-tree-census-2005.csv")
if not f05.exists():
    # the 2005 census (204 MB), NYC Open Data dataset 29bw-z7pj
    f05.write_bytes(requests.get(SOCRATA.format("29bw-z7pj"), timeout=1800).content)
trees = pd.read_csv(f, low_memory=False)
print(f"{len(trees):,} trees, {trees.status.eq('Alive').sum():,} alive")
683,788 trees, 652,173 alive
Example 1: the 2005 census recorded different things
old = pd.read_csv(f05, usecols=["status", "boroname"])
cols05 = pd.read_csv(f05, nrows=0).columns
print("2005 health classes:", old.status.value_counts().to_dict())
print("2015 health classes:", trees.health.value_counts().to_dict())
print("2005 borough names:", old.boroname.value_counts().to_dict())
print("columns only in 2005:", len(set(cols05) - set(trees.columns)), "only in 2015:", len(set(trees.columns) - set(cols05)))
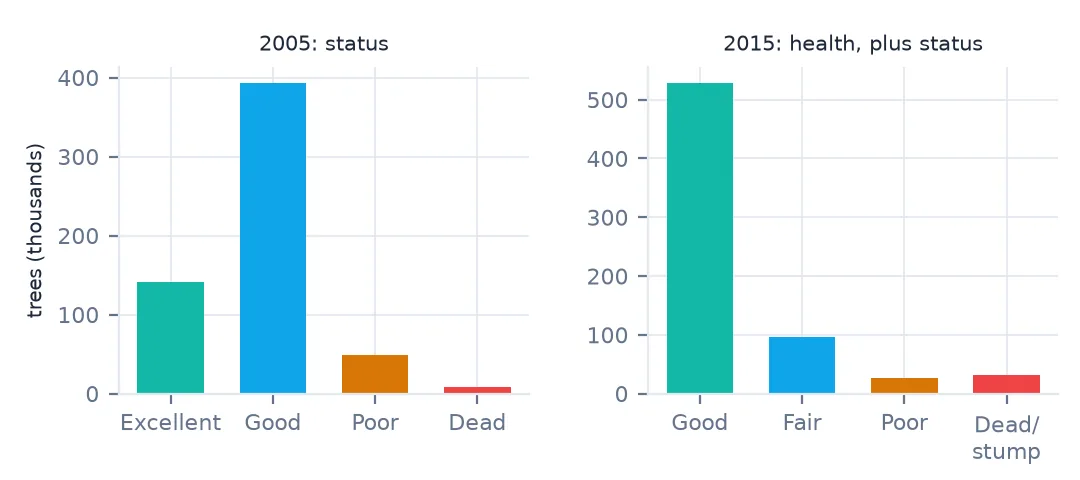
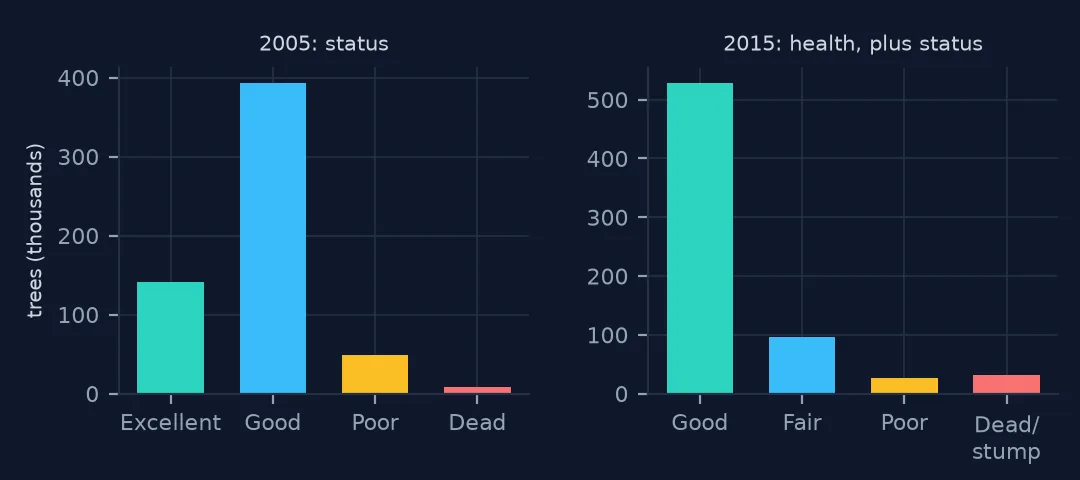
2005 health classes: {'Good': 393464, 'Excellent': 141657, 'Poor': 49131, 'Dead': 8120}
2015 health classes: {'Good': 528850, 'Fair': 96504, 'Poor': 26818}
2005 borough names: {'Queens': 240008, 'Brooklyn': 142852, 5: 84468, 'Bronx': 59925, 'Manhattan': 49886, '5': 15233}
columns only in 2005: 33 only in 2015: 24
The 2005 census rated health as Excellent, Good or Poor and counted dead trees in the same field; 2015 uses Good, Fair and Poor and keeps dead trees separate. "Good" therefore means different things in the two files. The 2005 borough field has a trap of its own: Staten Island appears as 5, and read without low_memory=False pandas parses it as the integer 5 in some chunks (84,468 rows) and the string '5' in others (15,233). 33 columns are only in 2005 and 24 only in 2015.
Example 2: an inventory, not a forest
print(f"stumps: {(trees.status == 'Stump').sum():,}, dead trees: {(trees.status == 'Dead').sum():,}")
print(f"trees per block id: median {trees.groupby('block_id').size().median():.0f}, max {trees.groupby('block_id').size().max()}")
stumps: 17,654, dead trees: 13,961
trees per block id: median 5, max 450
Stumps and dead trees are part of the inventory because they are sites to replant. A city block holds a median of 5 trees; the largest block_id holds 450.
A record is a measurement and a judgement
Every field in a tree record has a source of error. Diameter is the most objective, but it is rounded to an inch and taken with a tape on a crooked trunk; health is a three-point judgement of a crown; the problem checklist depends on what the recorder noticed and was trained to see. The census controls this with a protocol and training, and records who did each survey so that analysts can check.
Two consequences follow for analysis. Fields that need judgement should be compared within the same recorder group or adjusted for it (measurer bias). And two censuses can only be compared on fields measured the same way: totals and species once names are reconciled, size classes with care, health not at all (comparing 2005 and 2015).
Pitfalls in tree records
- "None" is a value, not a gap. pandas makes it NaN unless told otherwise.
- Mixed-type columns parse differently by chunk; use
low_memory=Falseor explicit dtypes. - Health classes differ between censuses. 2005's "Good" is not 2015's.
- Problems appear twice: as a list and as nine flags.
- Records carry their recorder. Use
user_typewhen a field involves judgement.
Internal links
- How to analyse New York's street tree census — loading the file
- Volunteers and staff recorded trees differently — the user_type field tested
- How to compare two street tree censuses — 2005 against 2015
- How to relate street tree health to sidewalk damage — the condition fields together
FAQ
What does DBH mean in a tree census?
Diameter at breast height: the trunk's diameter at a standard height above the ground, in whole inches in New York's census. The median living street tree measured 10 inches in 2015.
Why do the steward and guards columns look empty in pandas?
Because the file records "None" for trees without them, and pandas reads "None" as missing by default. Read with keep_default_na=False to keep it as text.