
Street Trees 425 Inches Across: Impossible Diameters in Tree Census Data
On this page
Problem statement
Sort New York's street tree census by trunk diameter and the top of the list is impossible: a swamp white oak 425 inches across, a tulip tree of 389, a Callery pear — a small ornamental — of 298. The largest trees in the city's parks are a fraction of that. At the other end, 222 living trees have a diameter of zero. These are entry errors — a digit typed twice, a circumference recorded as a diameter, a missing value stored as 0 — and with 652,173 trees they are a small share, but they sit exactly where averages, maxima and biomass estimates are most sensitive.
This page finds them with species-specific limits, checks who recorded them, looks at rounding, and measures what they do to summary statistics.
Quick answer
Flag a diameter as suspect if it is zero, over 60 inches, or far beyond the upper quartile for its own species (more than five interquartile ranges above it):
alive = trees[trees.status == "Alive"].copy()
by_sp = alive.groupby("spc_common").tree_dbh
q = by_sp.transform(lambda s: s.quantile(0.75)); iqr = by_sp.transform(lambda s: s.quantile(0.75) - s.quantile(0.25))
alive["suspect"] = (alive.tree_dbh > q + 5 * iqr) | (alive.tree_dbh > 60) | (alive.tree_dbh == 0)
print(f"trees with a suspect diameter: {alive.suspect.sum():,} ({alive.suspect.mean():.2%})")
print(alive.nlargest(5, "tree_dbh")[["spc_common", "tree_dbh", "user_type", "borough"]].to_string(index=False))
trees with a suspect diameter: 1,403 (0.22%)
spc_common tree_dbh user_type borough
swamp white oak 425 NYC Parks Staff Brooklyn
tulip-poplar 389 NYC Parks Staff Queens
London planetree 318 NYC Parks Staff Brooklyn
pin oak 318 TreesCount Staff Manhattan
Callery pear 298 TreesCount Staff Staten Island
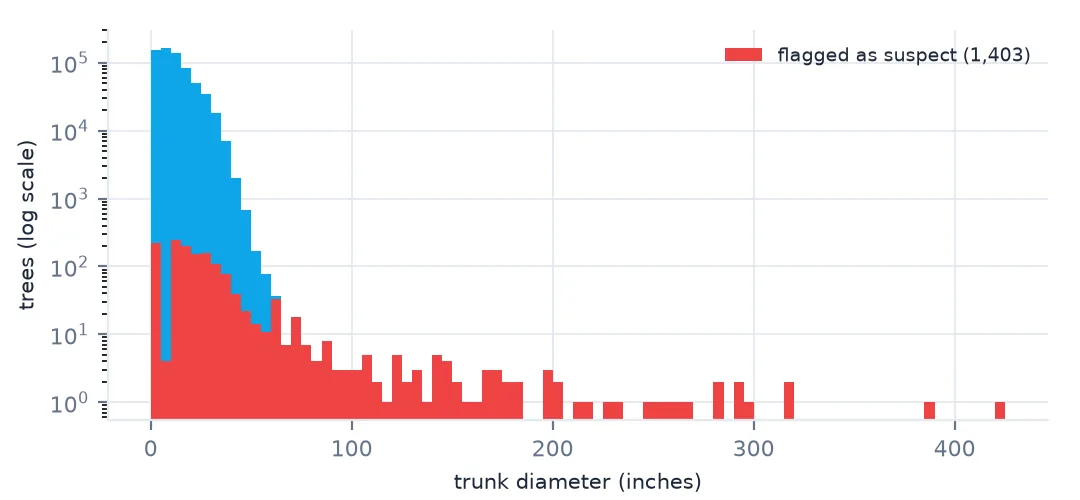
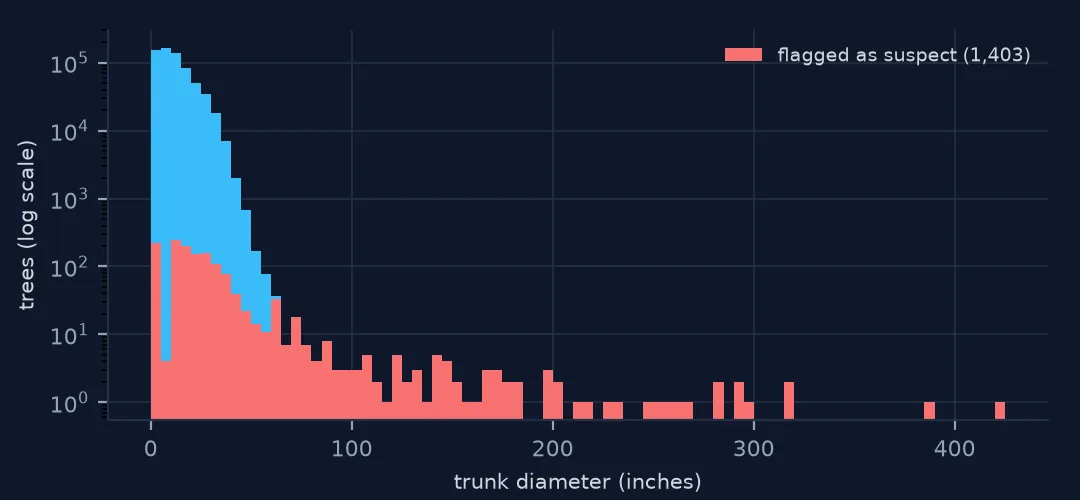
1,403 living trees, 0.22%, have a suspect diameter. The five largest are all over 24 feet across. Parks staff and census staff recorded the top five, not volunteers — the errors are not a volunteer problem.
Finding diameters that cannot be right
1. Look at both ends
print(alive.tree_dbh.describe(percentiles=[0.001, 0.5, 0.999]).round(1).to_string())
print(f"diameter 0: {(alive.tree_dbh == 0).sum():,}; over 60 inches: {(alive.tree_dbh > 60).sum():,}")
count 652173.0
mean 11.7
std 8.6
min 0.0
0.1% 1.0
50% 10.0
99.9% 47.0
max 425.0
diameter 0: 222; over 60 inches: 150
99.9% of living trees are 47 inches or less; above that the values jump to hundreds. 150 trees exceed 60 inches, a size almost no street tree reaches, and 222 are recorded as 0 although they are alive.
2. What is impossible depends on the species
lim = alive.groupby("spc_common").tree_dbh.agg(["median", lambda s: s.quantile(0.99), "max", "size"]).rename(columns={"<lambda_0>": "p99"})
print(lim[lim["size"] > 15000].round(0).to_string())
median p99 max size
spc_common
Callery pear 8.0 21.0 298 58931
Japanese zelkova 6.0 23.0 210 29258
London planetree 22.0 41.0 318 87014
Norway maple 14.0 30.0 204 34189
Sophora 8.0 25.0 141 19338
cherry 5.0 18.0 291 29279
ginkgo 8.0 25.0 106 21024
green ash 13.0 30.0 159 16251
honeylocust 10.0 23.0 169 64263
littleleaf linden 9.0 29.0 266 29742
pin oak 17.0 40.0 318 53185
red maple 10.0 31.0 154 17246
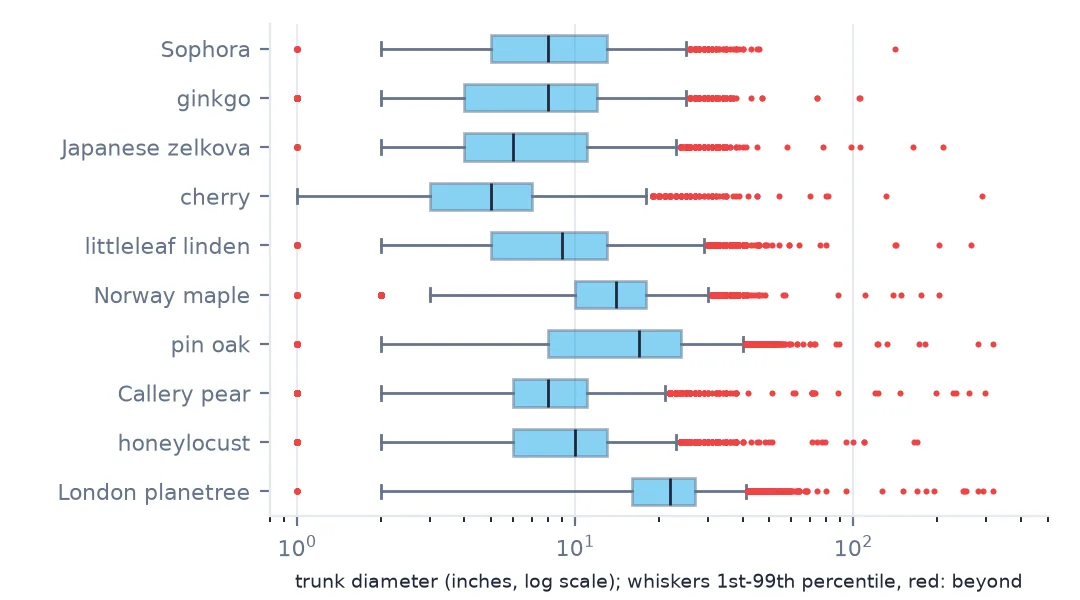
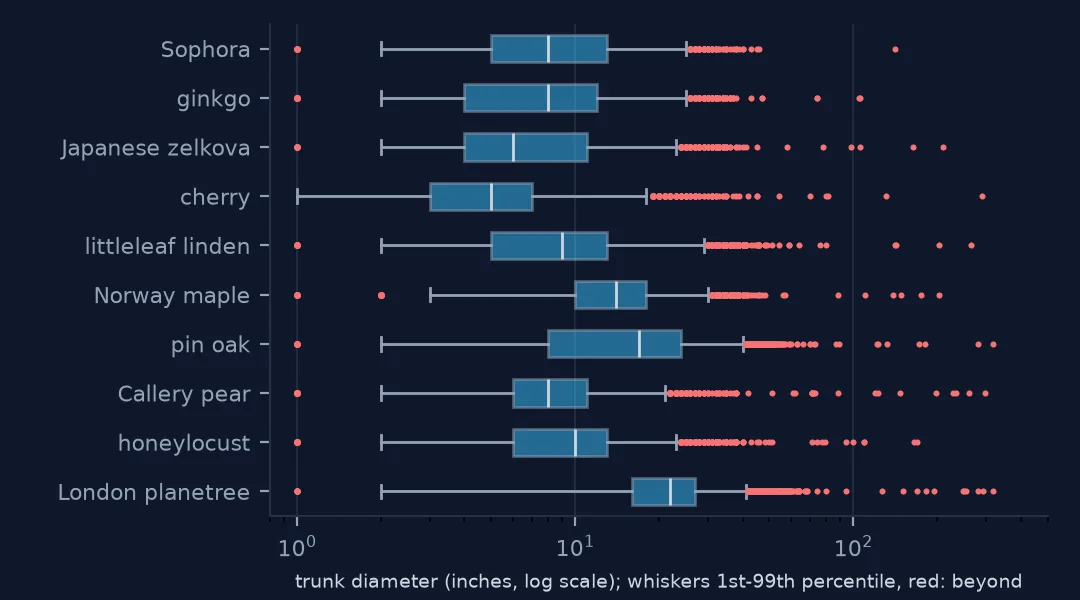
A single cut-off would be wrong for most species. London planetrees and pin oaks grow large, with 99th percentiles of 41 and 40 inches; cherries and Callery pears stay small, at 18 and 21. A cherry of 291 inches is impossible by a factor of fifteen; a planetree of 60 might be real. The per-species rule scales the limit to each species' own spread.
3. Who recorded the extremes
print(pd.crosstab(alive.user_type, alive.suspect, normalize="index").round(4).to_string())suspect False True
user_type
NYC Parks Staff 0.9978 0.0022
TreesCount Staff 0.9981 0.0019
Volunteer 0.9975 0.0025
Suspect diameters are equally rare across recorders: 0.22% of Parks staff records, 0.19% of census staff records and 0.25% of volunteer records. Typing errors happen to everyone.
4. Diameters cluster on round numbers
last = alive.tree_dbh[alive.tree_dbh.between(5, 40)] % 5
print("share ending in 0 or 5, inches 5-40:", f"{(last == 0).mean():.1%}", "(20% expected)")
print(alive[alive.tree_dbh.between(5, 40)].groupby("user_type").tree_dbh.apply(lambda s: (s % 5 == 0).mean()).round(3).to_dict())
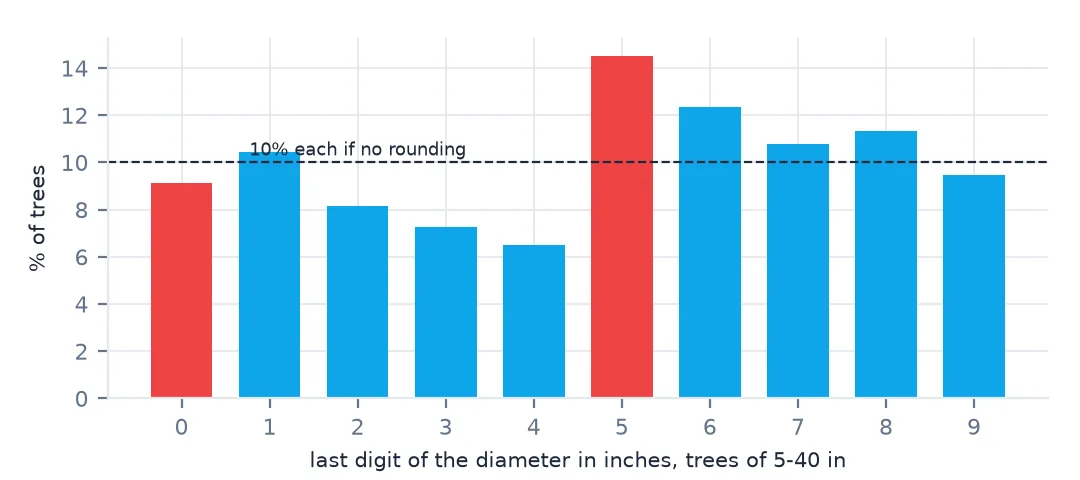
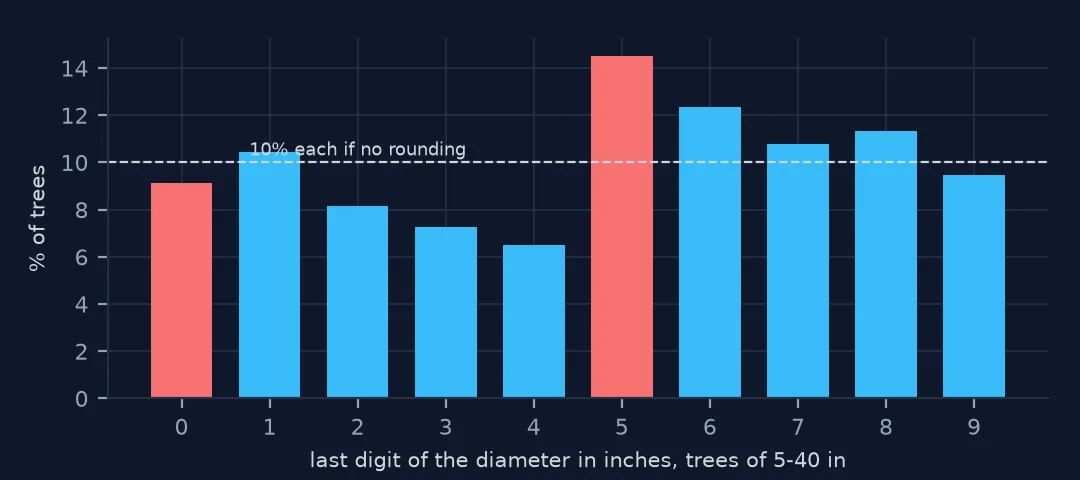
share ending in 0 or 5, inches 5-40: 23.7% (20% expected)
{'NYC Parks Staff': 0.238, 'TreesCount Staff': 0.235, 'Volunteer': 0.238}
Between 5 and 40 inches, 23.7% of diameters end in 0 or 5 against the 20% expected if every inch were equally likely — a mild preference for round numbers, the same for all three recorder groups. It matters little for analysis but shows that diameters were sometimes estimated rather than measured with a tape.
What the errors cost
The data used on this page
New York City Department of Parks and Recreation, TreesCount! 2015 Street Tree Census on NYC Open Data: one row for every street tree, stump and dead tree mapped by staff and volunteers in 2015–2016, with species, trunk diameter, health and site conditions.
from pathlib import Path

import numpy as np
import pandas as pd
import requests

Path("data").mkdir(exist_ok=True)
SOCRATA = "https://data.cityofnewyork.us/api/views/{}/rows.csv?accessType=DOWNLOAD"
f = Path("data/nyc-street-tree-census-2015.csv")
if not f.exists():
    # TreesCount! 2015, the finished census (220 MB), NYC Open Data dataset uvpi-gqnh
    f.write_bytes(requests.get(SOCRATA.format("uvpi-gqnh"), timeout=1800).content)
trees = pd.read_csv(f, low_memory=False)
print(f"{len(trees):,} trees, {trees.status.eq('Alive').sum():,} alive")
683,788 trees, 652,173 alive
Example 1: what the outliers do to statistics
clean = alive[~alive.suspect]
print(f"mean DBH {alive.tree_dbh.mean():.2f} in raw, {clean.tree_dbh.mean():.2f} clean; median {alive.tree_dbh.median():.0f} both")
basal = lambda d: (np.pi * (d * 0.0254 / 2) ** 2).sum()
print(f"basal area, m2: raw {basal(alive.tree_dbh):,.0f}, clean {basal(clean.tree_dbh):,.0f} ({basal(clean.tree_dbh) / basal(alive.tree_dbh) - 1:+.1%})")
mean DBH 11.71 in raw, 11.67 clean; median 10 both
basal area, m2: raw 69,946, clean 68,075 (-2.7%)
Removing the suspect values moves the mean diameter only from 11.71 to 11.67 inches, and the median not at all. Basal area — the cross-sectional area of all trunks, which grows with the square of diameter and feeds biomass and canopy estimates — falls by 2.7%: a handful of trees recorded at hundreds of inches each count as much as several hundred normal ones.
Example 2: the stumps carry their own column
st = trees[trees.status == "Stump"]
print(f"stumps: tree_dbh is {st.tree_dbh.eq(0).mean():.0%} zero; stump_diam median {st.stump_diam.median():.0f} in")
stumps: tree_dbh is 100% zero; stump_diam median 14 in
Stumps carry their size in a separate column: their tree_dbh is always zero and stump_diam holds a median 14 inches. Mixing the two columns, or including stumps in a living-tree summary, produces a different kind of impossible value.
Why diameters go wrong and how to catch them
Field data are typed by people in a hurry, often on a phone, and diameter is the field most exposed: a number, with no list to pick from, entered after a measurement. Doubling a digit, entering circumference instead of diameter (larger by a factor of about three), or leaving zero for unknown all produce values that are plausible as numbers and impossible as trees. Range checks at entry would catch most of them; once in the file, they need a rule.
The rule should reflect biology rather than statistics alone. A global percentile cut-off removes the genuinely big planetrees and keeps impossible cherries; a species-relative limit catches values that are extreme for that kind of tree. The flag should be kept as a column rather than the rows deleted, so that an analysis of large trees can inspect them, and so that the count of suspect values — here 0.22% — can be reported alongside the results.
Pitfalls with diameter data
- Use species-specific limits. One threshold is wrong for both small and large species.
- Zero means unknown for a living tree, not a seedling.
- Squared quantities amplify errors. Basal area and biomass move most.
- Stumps use
stump_diam. Theirtree_dbhis zero. - Flag, don't delete, and report how many were flagged.
Internal links
- Volunteers and staff recorded trees differently — the wider measurer effect
- Street tree censuses explained — how DBH is measured
- How to analyse New York's street tree census — the data
FAQ
What is the largest street tree in New York's tree census?
The file's largest value, a 425-inch swamp white oak, is an entry error. 99.9% of living street trees measured 47 inches or less in 2015.
How should I clean tree diameter outliers?
Flag zeros, values above a hard ceiling, and values far beyond the species' own upper quartile; in New York's 2015 census that flags 1,403 trees, 0.22%.