
Neighbourhood Codes That Match No Boundary: 2010 NTAs Against 2020 Files
On this page
Problem statement
New York's street tree census gives every tree a neighbourhood code, nta, and the city publishes neighbourhood boundaries with a code column. Merge the two and nothing matches — or, worse, a few names match and quietly attach trees to the wrong area. The census was coded with the 2010 Neighborhood Tabulation Areas; the boundaries published today are the 2020 ones, with a new code format, different splits and partly reused names. The 2010 boundary file is not even published any more.
This is a general problem with any dataset coded to a boundary vintage. This page diagnoses it for the tree census, joins trees to 2020 neighbourhoods by location instead, and builds a crosswalk between the two sets of codes from the trees themselves.
Quick answer
Do not join on the code. Compare the code sets, then place each tree in a 2020 neighbourhood with a point-in-polygon join:
import geopandas as gpd
from shapely import wkt

ntas = pd.read_csv("data/nyc-nta-2020-2026-10-15.zip").rename(columns=str.lower)
ntas = gpd.GeoDataFrame(ntas, geometry=ntas.the_geom.map(wkt.loads), crs=4326).to_crs(2263)
codes_tree = set(trees.nta.dropna()); codes_2020 = set(ntas.nta2020)
print(f"NTA codes in the tree file: {len(codes_tree)}; in the 2020 boundaries: {len(codes_2020)}; shared: {len(codes_tree & codes_2020)}")
pts = gpd.GeoDataFrame(trees[["tree_id", "nta", "nta_name"]], geometry=gpd.points_from_xy(trees.x_sp, trees.y_sp), crs=2263)
j = gpd.sjoin(pts, ntas[["nta2020", "ntaname", "geometry"]], predicate="within", how="left")
j = j[~j.index.duplicated()]
print(f"trees placed in a 2020 NTA by location: {j.nta2020.notna().mean():.3%}")
NTA codes in the tree file: 188; in the 2020 boundaries: 262; shared: 0
trees placed in a 2020 NTA by location: 99.987%
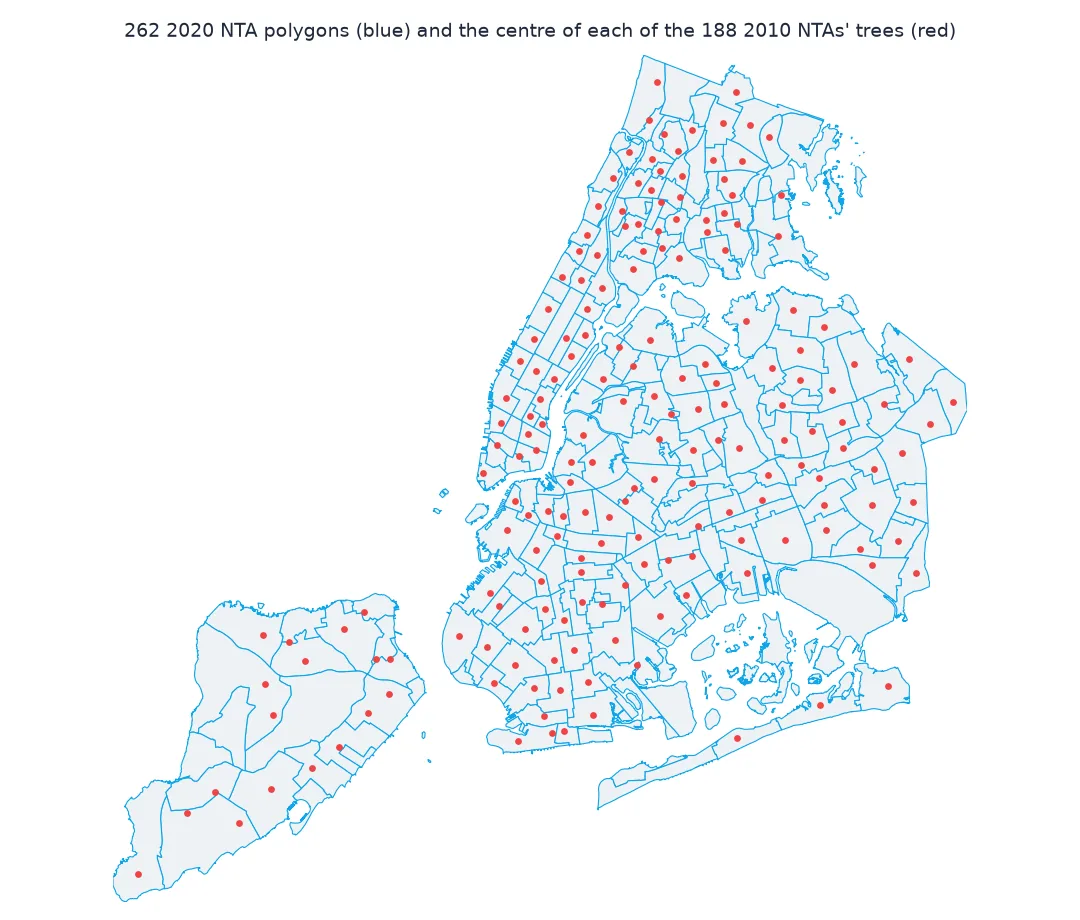
The tree file uses 188 codes and the 2020 boundaries 262, and not a single code is shared. Joined by location instead, 99.987% of trees fall inside a 2020 neighbourhood; the remainder sit just outside the shoreline polygons.
Codes, names, locations and a crosswalk
1. Same format, different codes
print(sorted(codes_tree)[:6], "...", sorted(codes_2020)[:6])
print("names in both files:", len(set(trees.nta_name.dropna()) & set(ntas.ntaname)))
['BK09', 'BK17', 'BK19', 'BK21', 'BK23', 'BK25'] ... ['BK0101', 'BK0102', 'BK0103', 'BK0104', 'BK0201', 'BK0202']
names in both files: 79
The 2010 codes are a borough prefix and two digits (BK09); the 2020 codes add community-district digits (BK0101). They look like the same scheme and are not. 79 neighbourhood names appear in both files, which is the dangerous part: a name match looks like success.
2. Join by location
xt = pd.crosstab(j.nta, j.nta2020)
one_to_one = (xt.gt(0).sum(axis=1) == 1)
print(f"2010 NTAs whose trees all fall in one 2020 NTA: {one_to_one.sum()} of {len(xt)}")
share = xt.max(axis=1) / xt.sum(axis=1)
print(f"share of each 2010 NTA's trees in its largest 2020 NTA: median {share.median():.1%}, lowest {share.min():.1%}")
2010 NTAs whose trees all fall in one 2020 NTA: 28 of 188
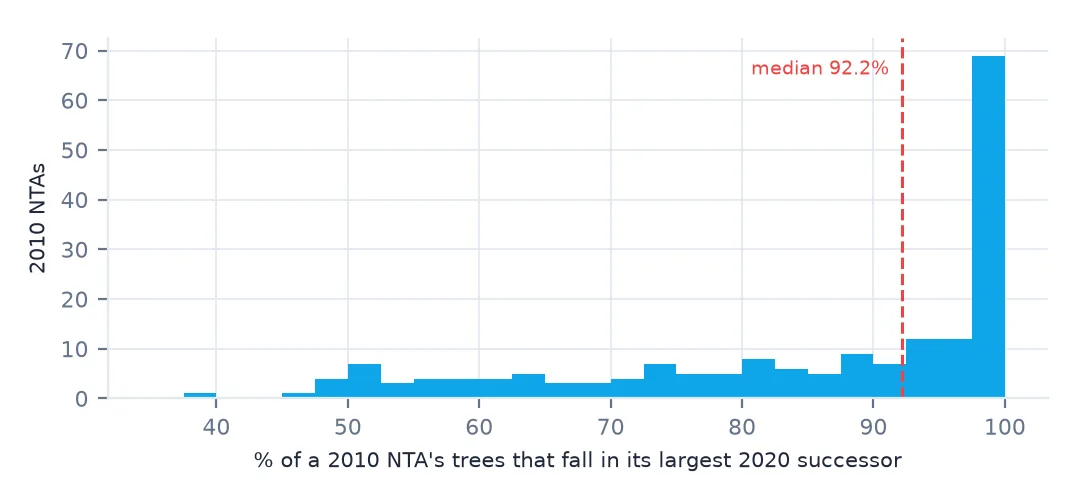
share of each 2010 NTA's trees in its largest 2020 NTA: median 92.2%, lowest 38.6%
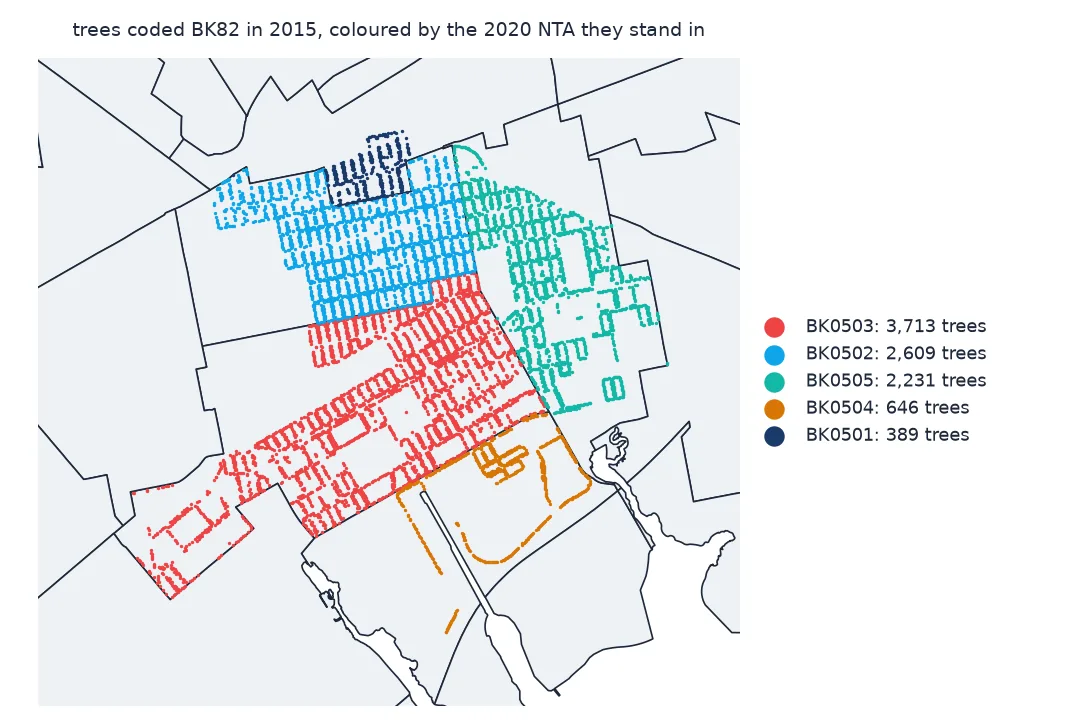
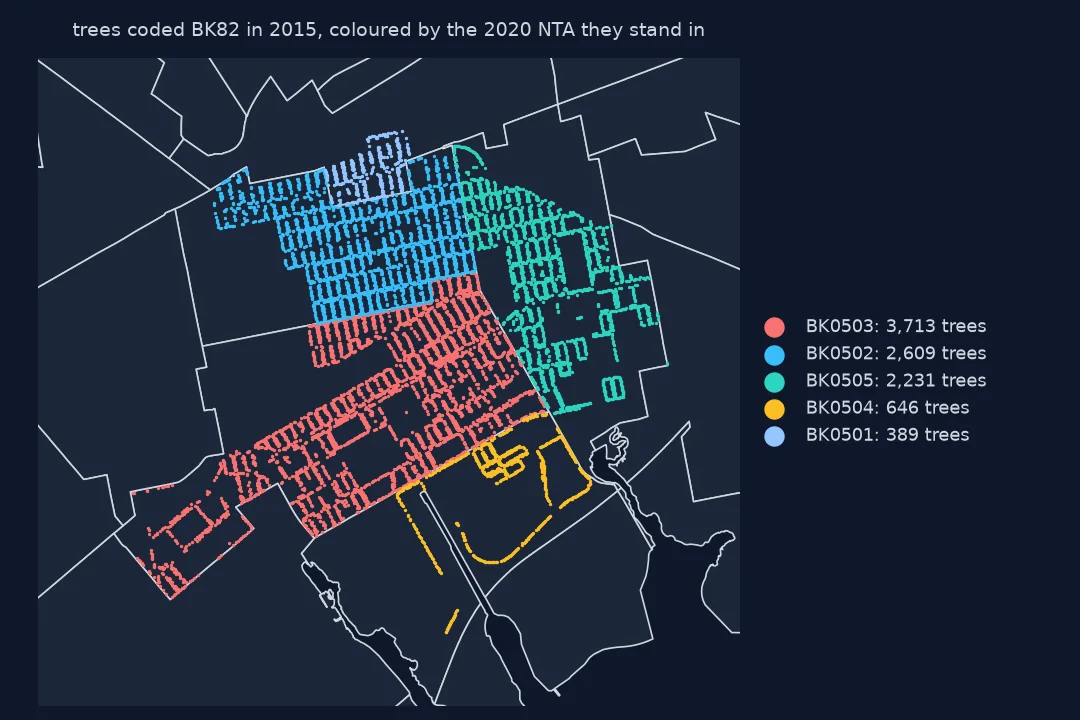
Only 28 of the 188 old neighbourhoods map entirely into a single new one. For a median 2010 neighbourhood, 92.2% of its trees fall in its largest 2020 successor; for the most divided, only 38.6% do. Boundaries moved, split and merged.
3. Build a crosswalk from the points
cw = (xt.stack().rename("trees").reset_index().query("trees > 0"))
cw["weight"] = cw.trees / cw.groupby("nta").trees.transform("sum")
print(cw.sort_values("trees", ascending=False).head(4).to_string(index=False))
print(f"{len(cw):,} pairs of 2010 and 2020 codes")
nta nta2020 trees weight
SI54 SI0302 10734 1.000000
SI01 SI0304 8259 0.636826
QN17 QN0602 7665 0.995325
QN55 QN1001 7281 0.994536
529 pairs of 2010 and 2020 codes
Counting trees in each pair of old and new codes gives a crosswalk with 529 pairs, weighted by trees: SI54 maps wholly to SI0302, while SI01 splits, 64% to SI0304 and the rest elsewhere. Weights from trees suit tree data; for people, weight a crosswalk by population.
4. Parks and other non-residential areas
print(ntas.ntatype.value_counts().to_dict(), "(0 = residential)")
print(j.merge(ntas[["nta2020", "ntatype"]], on="nta2020").ntatype.value_counts().to_dict())
{0: 197, 9: 40, 7: 14, 6: 8, 8: 2, 5: 1} (0 = residential)
{0: 675005, 9: 7101, 7: 1044, 6: 385, 8: 167}
The 2020 file also includes non-residential areas — parks, cemeteries, airports and similar — which the 2010 scheme folded into neighbouring areas. 7,101 trees fall in type-9 areas and smaller numbers in the others; an analysis of residential streets should drop them explicitly.
What the naive join does
The data used on this page
New York City Department of Parks and Recreation, TreesCount! 2015 Street Tree Census on NYC Open Data: one row for every street tree, stump and dead tree mapped by staff and volunteers in 2015–2016, with species, trunk diameter, health and site conditions. Neighbourhoods are the city's 2020 Neighborhood Tabulation Areas, in a copy saved on this site on 15 October 2026.
from pathlib import Path

import numpy as np
import pandas as pd
import requests

Path("data").mkdir(exist_ok=True)
SOCRATA = "https://data.cityofnewyork.us/api/views/{}/rows.csv?accessType=DOWNLOAD"
f = Path("data/nyc-street-tree-census-2015.csv")
if not f.exists():
    # TreesCount! 2015, the finished census (220 MB), NYC Open Data dataset uvpi-gqnh
    f.write_bytes(requests.get(SOCRATA.format("uvpi-gqnh"), timeout=1800).content)
# NYC's centreline and 2020 neighbourhood files are edited continually; these are the copies of 15 October 2026
# (live: NYC Open Data datasets inkn-q76z and 9nt8-h7nd).
for name in ["nyc-centerline-2026-10-15.zip", "nyc-nta-2020-2026-10-15.zip"]:
    if not Path(f"data/{name}").exists():
        Path(f"data/{name}").write_bytes(requests.get(f"https://data.spatialworkflow.io/{name}", timeout=600).content)
trees = pd.read_csv(f, low_memory=False)
print(f"{len(trees):,} trees, {trees.status.eq('Alive').sum():,} alive")
683,788 trees, 652,173 alive
Example 1: the wrong join, done naively
naive = trees[["nta"]].merge(ntas[["nta2020", "ntaname"]], left_on="nta", right_on="nta2020", how="left")
print(f"trees matched by code: {naive.nta2020.notna().mean():.1%} — no error, every 2020 column is simply NaN")
named = j[j.nta_name.isin(set(ntas.ntaname))]
print(f"trees whose 2010 NTA name also exists in 2020: {len(named):,}; standing inside the 2020 NTA of that name: "
      f"{(named.nta_name == named.ntaname).mean():.1%}")
trees matched by code: 0.0% — no error, every 2020 column is simply NaN
trees whose 2010 NTA name also exists in 2020: 290,222; standing inside the 2020 NTA of that name: 88.7%
A merge on the code matches 0.0% of trees and raises no error: every 2020 column is simply NaN. Matching on names instead finds 290,222 trees whose 2010 neighbourhood name also exists in 2020 — and only 88.7% of those stand inside the 2020 area with that name; the rest would be attached to the wrong neighbourhood by a join that looked successful.
Example 2: counts by 2020 NTA
cnt = j.groupby(["nta2020", "ntaname"]).size().sort_values(ascending=False)
print(cnt.head(5).to_string())
nta2020 ntaname
SI0304 Annadale-Huguenot-Prince's Bay-Woodrow 17147
SI0302 Great Kills-Eltingville 15444
SI0303 Arden Heights-Rossville 8773
QN1102 Bayside 8205
QN1101 Auburndale 8046
Counted by location, the 2020 neighbourhoods with the most street trees are on Staten Island's south shore — Annadale–Huguenot–Prince's Bay–Woodrow with 17,147 and Great Kills–Eltingville with 15,444 — followed by Bayside and Auburndale in Queens.
Codes belong to a vintage
A geographic code is a label for a polygon that existed at a certain time. When the polygons are redrawn, the labels either change, as here, or worse, stay the same while the shapes move. Joining attributes by code is only safe when both sides use the same vintage, and the code alone rarely says which vintage it is.
The fix is to rely on geometry rather than labels whenever geometry is available. Points can be placed in any vintage of polygons with a spatial join; data that exist only as area totals need a crosswalk, built by overlaying the two vintages and weighting by whatever the data count — trees, people, households. The tree census makes the crosswalk easy because every tree is a point; the same approach with population-weighted blocks is what the Census Bureau's own relationship files do for tracts (comparing census years across changed boundaries).
Pitfalls with area codes
- A code without a vintage is ambiguous. Check the documentation's year.
- A failed merge is silent. Count matches after every join.
- Name matches are the worst kind: they succeed for most rows and are wrong for some.
- Join points by location to any boundary vintage you need.
- Drop non-residential areas explicitly in 2020 NTAs; they did not exist as areas in 2010.
Internal links
- How to calculate street trees per kilometre of street — joining trees to 2020 NTAs by location
- How to compare census years across changed boundaries — the same problem for census tracts
- How to analyse New York's street tree census — the file
FAQ
Why don't NYC tree census NTA codes match the NTA boundary file?
The 2015 tree census uses 2010 Neighborhood Tabulation Area codes; the boundaries currently published are the 2020 NTAs, with a different code format. None of the 188 codes in the tree file appears in the 2020 file.
How do I assign trees to 2020 NTAs?
Join the tree points to the 2020 polygons by location; that places 99.987% of trees.