
How to Find Gaps in Street Tree Planting with Nearest-Neighbour Distances
On this page
Problem statement
Where could a city plant more street trees? Every gap along a planted street is a candidate, and a tree census with coordinates makes the gaps measurable. The obvious tool, nearest-neighbour distance, describes how closely trees stand but not where the empty stretches are, because trees along streets are not scattered in a plane: they stand in lines on both sides of a road. Finding gaps means putting each tree back on its street and measuring along it.
This page measures the spacing of New York's 652,173 street trees, snaps them to the street centreline, orders them along each block, and counts the gaps big enough for another tree.
Quick answer
Project the trees to metres and query a KD-tree for each tree's nearest neighbour:
import geopandas as gpd
from scipy.spatial import cKDTree
from shapely import wkt

alive = trees[trees.status == "Alive"]
pts = gpd.GeoDataFrame(alive[["tree_id", "borough", "nta_name", "tree_dbh"]],
                       geometry=gpd.points_from_xy(alive.x_sp, alive.y_sp), crs=2263).to_crs(32118)
xy = np.c_[pts.geometry.x, pts.geometry.y]
d, _ = cKDTree(xy).query(xy, k=2)
pts["nn_m"] = d[:, 1]
print(f"distance to the nearest other street tree: median {pts.nn_m.median():.1f} m, "
      f"90th percentile {pts.nn_m.quantile(0.9):.1f} m")
print(pts.groupby("borough").nn_m.median().round(1).to_string())
distance to the nearest other street tree: median 9.0 m, 90th percentile 14.5 m
borough
Bronx 9.3
Brooklyn 9.3
Manhattan 8.4
Queens 9.2
Staten Island 7.6
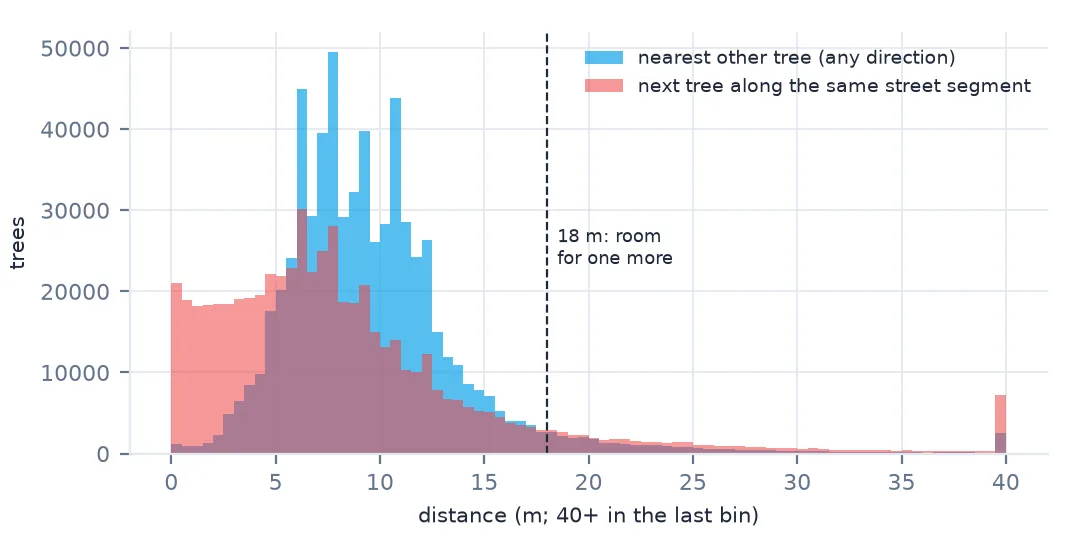
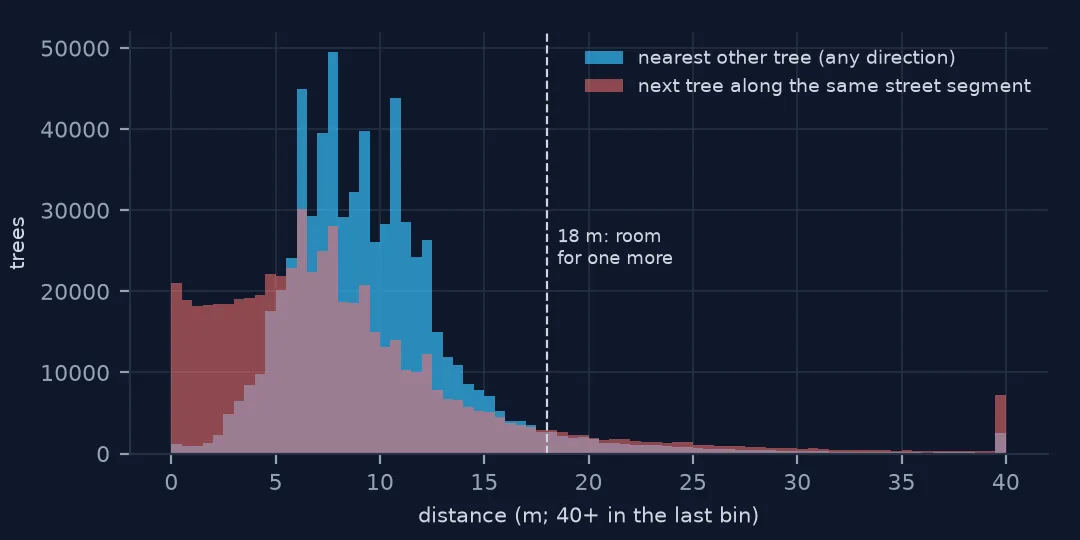
A median street tree stands 9.0 m from its nearest neighbour, and nine in ten within 14.5 m. Staten Island's trees are closest together (7.6 m), the Bronx and Brooklyn's farthest apart (9.3 m). This is spacing where trees exist; gaps need the steps below.
From points to positions along streets
1. Points on lines, not in a plane
area = pts.geometry.union_all().convex_hull.area
expected = 0.5 / np.sqrt(len(pts) / area)
print(f"Clark-Evans ratio over the city: {pts.nn_m.mean() / expected:.2f} (1 = random, under 1 = clustered)")
Clark-Evans ratio over the city: 0.46 (1 = random, under 1 = clustered)
The Clark–Evans ratio — observed mean nearest-neighbour distance over the distance expected for random points — is 0.46: strongly clustered. That is the test telling us something we know: trees lie on lines. In-plane point statistics answer the wrong question for street trees.
2. Snap each tree to its street
cl = pd.read_csv("data/nyc-centerline-2026-10-15.zip", usecols=["the_geom", "PHYSICALID", "RW_TYPE", "STATUS", "NONPED"], low_memory=False)
cl = gpd.GeoDataFrame(cl, geometry=cl.the_geom.map(wkt.loads), crs=4326).to_crs(32118)
streets = cl[(cl.RW_TYPE == 1) & (cl.STATUS == 2) & cl.NONPED.isna()][["PHYSICALID", "geometry"]].reset_index(drop=True)
snap = gpd.sjoin_nearest(pts, streets, distance_col="to_street_m", max_distance=40)
snap = snap[~snap.index.duplicated()]
print(f"trees within 40 m of a street centreline: {len(snap):,} of {len(pts):,}; distance median {snap.to_street_m.median():.1f} m")
trees within 40 m of a street centreline: 650,346 of 652,173; distance median 6.0 m
sjoin_nearest assigns each tree to the closest street segment within 40 m; 650,346 of the 652,173 trees have one, typically 6.0 m from the centreline — the width of a traffic lane and a sidewalk.
3. Order trees along each segment
geom = streets.geometry.reindex(snap.index_right.values).values
snap["along_m"] = [g.project(p) for g, p in zip(geom, snap.geometry.values)]
snap = snap.sort_values(["index_right", "along_m"])
snap["gap_m"] = snap.groupby("index_right").along_m.diff()
print(snap.gap_m.describe(percentiles=[0.25, 0.5, 0.75, 0.9]).round(1).to_string())
count 581452.0
mean 8.7
std 8.8
min 0.0
25% 3.8
50% 7.0
75% 10.7
90% 16.7
max 351.3
project gives each tree's distance along its segment, so trees can be sorted along the street. Consecutive trees on a segment — counting both sides together — are a median 7.0 m apart, with a quarter under 3.8 m (often the two sides of the street at the same point) and a tenth beyond 16.7 m.
4. Count the plantable gaps
SPACING = 9.0                                              # metres between trees, a typical planting standard
gaps = snap[snap.gap_m > 2 * SPACING]
spots = np.floor(gaps.gap_m / SPACING) - 1
print(f"gaps over {2 * SPACING:.0f} m between consecutive trees on a segment: {len(gaps):,}; room for about {spots.sum():,.0f} more trees")
empty = streets.index.difference(snap.index_right.unique())
print(f"street segments with no tree at all: {len(empty):,} ({streets.loc[empty].length.sum() / 1000:,.0f} km)")
gaps over 18 m between consecutive trees on a segment: 49,557; room for about 92,885 more trees
street segments with no tree at all: 27,651 (1,786 km)
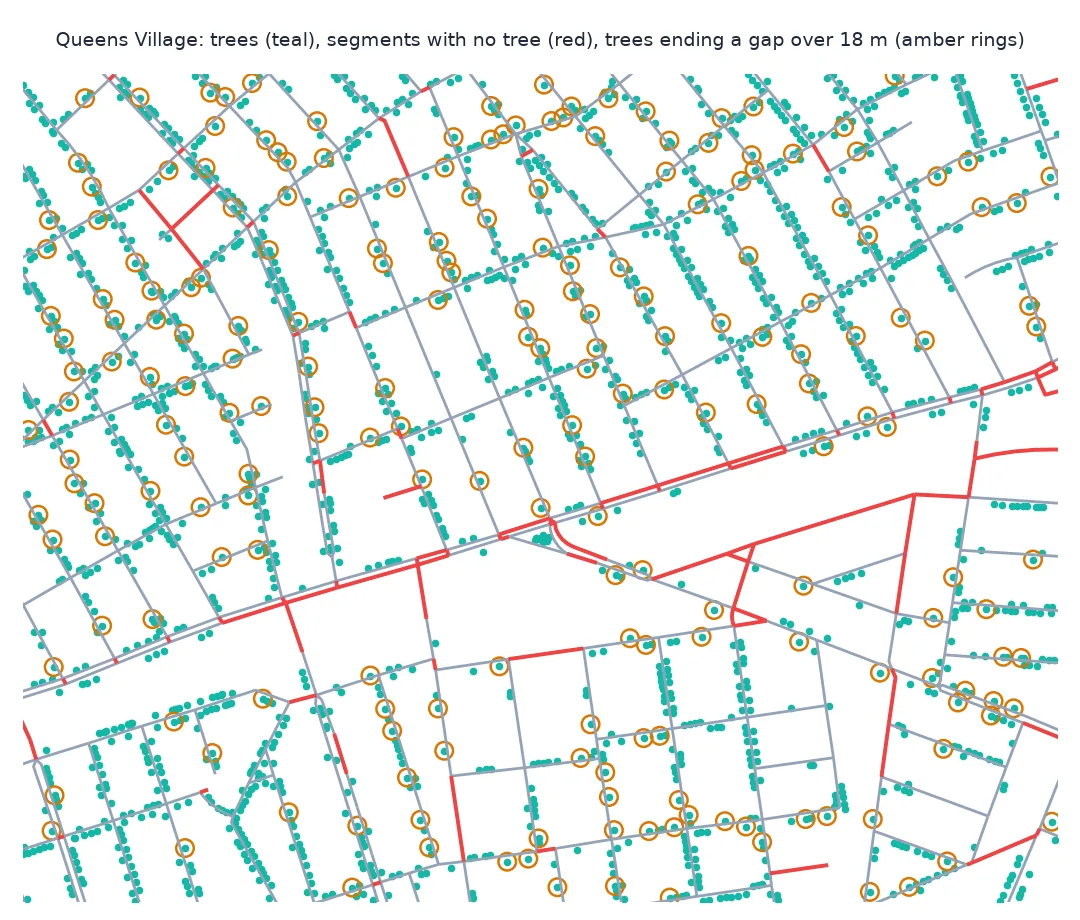
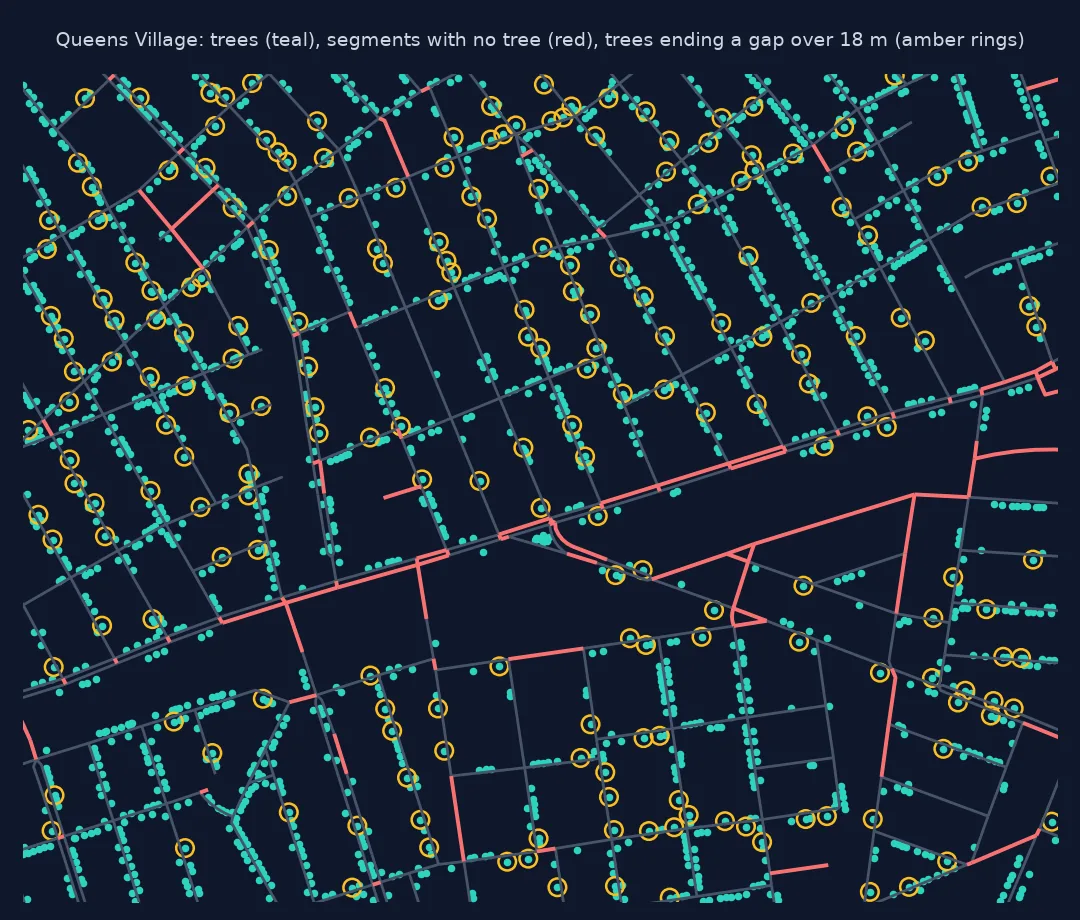
Taking 9 m as the spacing between trees, any gap over 18 m along a segment has room for at least one more. There are 49,557 such gaps, with room for about 92,885 trees. Another 27,651 street segments, 1,786 km of street, have no street tree at all — not all of them plantable, since some are industrial or lack sidewalks.
Where the room is
The data used on this page
New York City Department of Parks and Recreation, TreesCount! 2015 Street Tree Census on NYC Open Data: one row for every street tree, stump and dead tree mapped by staff and volunteers in 2015–2016, with species, trunk diameter, health and site conditions. Streets are NYC's street centerline (CSCL), in a copy saved on this site on 15 October 2026.
from pathlib import Path

import numpy as np
import pandas as pd
import requests

Path("data").mkdir(exist_ok=True)
SOCRATA = "https://data.cityofnewyork.us/api/views/{}/rows.csv?accessType=DOWNLOAD"
f = Path("data/nyc-street-tree-census-2015.csv")
if not f.exists():
    # TreesCount! 2015, the finished census (220 MB), NYC Open Data dataset uvpi-gqnh
    f.write_bytes(requests.get(SOCRATA.format("uvpi-gqnh"), timeout=1800).content)
# NYC's centreline and 2020 neighbourhood files are edited continually; these are the copies of 15 October 2026
# (live: NYC Open Data datasets inkn-q76z and 9nt8-h7nd).
for name in ["nyc-centerline-2026-10-15.zip", "nyc-nta-2020-2026-10-15.zip"]:
    if not Path(f"data/{name}").exists():
        Path(f"data/{name}").write_bytes(requests.get(f"https://data.spatialworkflow.io/{name}", timeout=600).content)
trees = pd.read_csv(f, low_memory=False)
print(f"{len(trees):,} trees, {trees.status.eq('Alive').sum():,} alive")
683,788 trees, 652,173 alive
Example 1: neighbourhoods with the most room
by = snap.groupby("nta_name").agg(trees=("tree_id", "size"), median_gap=("gap_m", "median"))
by["room"] = spots.groupby(gaps.nta_name).sum().reindex(by.index).fillna(0)
by = by[by.trees >= 1000]
print(by.sort_values("room", ascending=False).head(5).round(1).to_string())
trees median_gap room
nta_name
South Ozone Park 6914 7.6 1838.0
Queens Village 6394 8.0 1520.0
St. Albans 6815 7.7 1514.0
New Springville-Bloomfield-Travis 8142 6.9 1314.0
Bayside-Bayside Hills 9379 7.3 1296.0
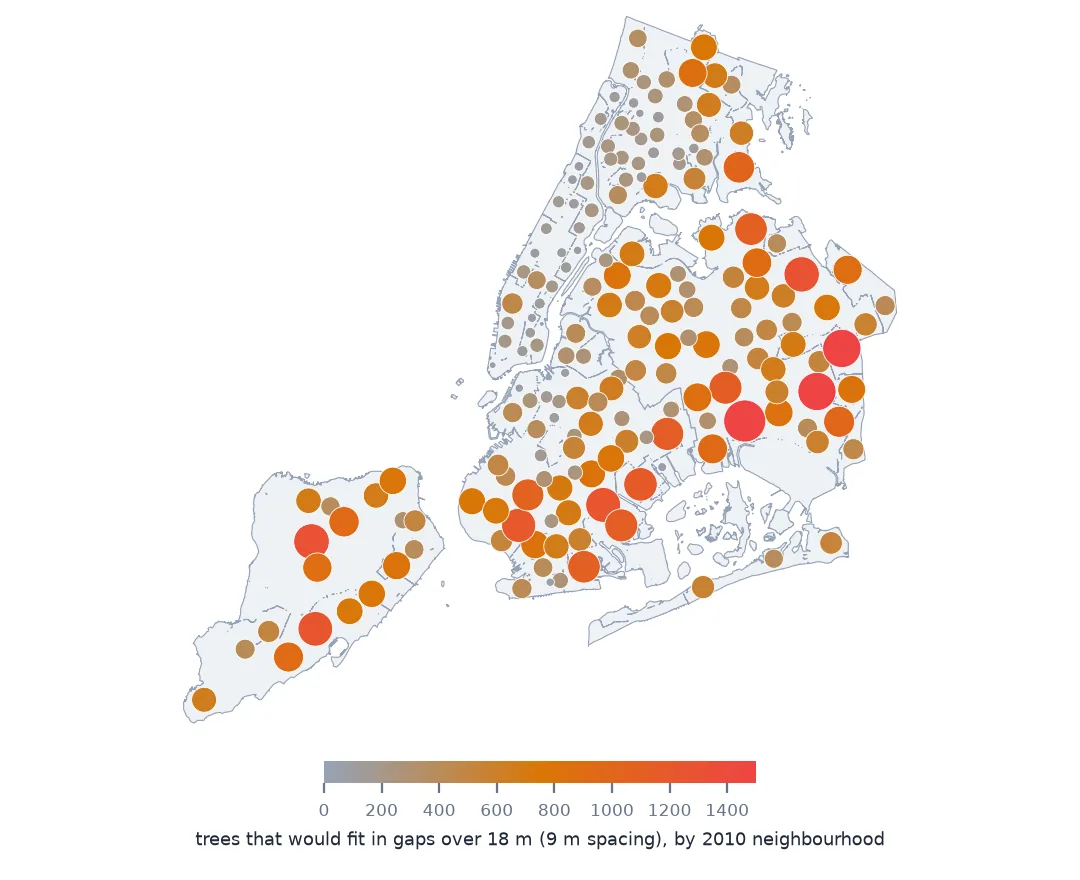
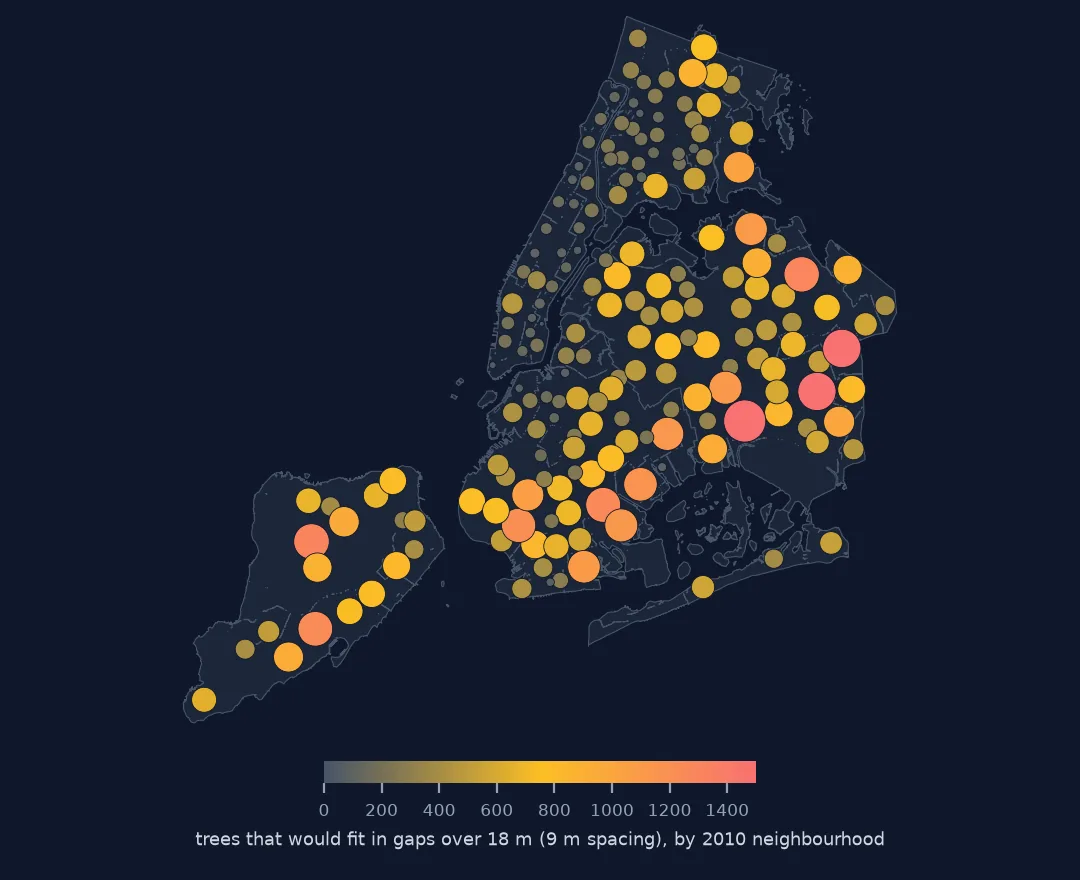
The neighbourhoods with the most room are in southeast Queens and Staten Island — South Ozone Park, Queens Village, St. Albans — residential streets with houses and long frontages, where the gaps between existing trees would hold another 1,296 to 1,838 each among the top five.
Example 2: big trees stand further apart
size = pd.cut(snap.tree_dbh, [0, 6, 12, 24, 500], labels=["under 6 in", "6-12 in", "12-24 in", "24+ in"])
print(snap.groupby(size, observed=True).nn_m.median().round(1).to_string())
tree_dbh
under 6 in 8.5
6-12 in 8.4
12-24 in 9.8
24+ in 10.3
Trees over 24 inches stand 10.3 m from their nearest neighbour against 8.5 m for trees under 6 inches: large trees need room.
Measuring along the network
Distance in a plane and distance along a line are different quantities, and street trees belong to the second. A nearest-neighbour distance mixes the tree across the road with the tree along the block; a Clark–Evans test compares the pattern with randomness in a plane where trees could never stand. Snapping each tree to its street segment and projecting it onto the segment turns the problem into one dimension, where a gap is simply the difference between consecutive positions.
The method has simplifications worth stating. The centreline stands for both sides of the street at once, so a gap here is a stretch where neither side has a tree; a version per side would offset the centreline by the sidewalk position. Driveways, hydrants, bus stops and utility lines also limit where trees can go, so the room counted here is an upper bound on plantable sites, to be checked against the city's own planting rules.
Pitfalls in spacing analysis
- Clark–Evans assumes a plane. Street trees always look clustered.
- Snap with a distance limit, or a tree in a courtyard joins the nearest street.
- Both sides share one centreline. Split by side for kerbside planning.
- A gap is not a planting site until driveways, hydrants and utilities are checked.
- Segment ends hide gaps across intersections; join segments into blocks for a stricter count.
Internal links
- How to calculate street trees per kilometre of street — the same question by neighbourhood
- How to analyse New York's street tree census — the trees
- Spatial clustering explained — what clustered and random mean for points
FAQ
How far apart are New York's street trees?
The median living street tree in 2015 was 9.0 m from its nearest neighbour; along a street segment, consecutive trees on either side were a median 7.0 m apart.
How many more street trees would fit in New York?
Gaps over 18 m along planted segments had room for about 92,885 more trees at 9 m spacing, before checking driveways and utilities; 1,786 km of street had no tree at all.