
How to Calculate Street Trees per Kilometre of Street
On this page
Problem statement
"How many street trees does this neighbourhood have?" is the wrong question for comparing places, because neighbourhoods differ in size and in how much street they contain. Street trees can only grow along streets, so the natural denominator is the length of street: trees per kilometre. Getting it needs a street network clipped to the same areas as the trees, in metres, with only real streets in it — not highways, ramps, paths or the outline of the shore.
This page computes trees per kilometre of street for New York's 2020 neighbourhoods from the 2015 tree census and the city's street centreline, and compares it with the simpler trees per square kilometre.
Quick answer
Keep street segments of the centreline, clip them to neighbourhood polygons with overlay, sum their lengths in a metric CRS, count trees per neighbourhood with a spatial join, and divide:
import geopandas as gpd
from shapely import wkt

cl = pd.read_csv("data/nyc-centerline-2026-10-15.zip", usecols=["the_geom", "RW_TYPE", "STATUS", "NONPED"], low_memory=False)
cl = gpd.GeoDataFrame(cl, geometry=cl.the_geom.map(wkt.loads), crs=4326).to_crs(32118)
streets = cl[(cl.RW_TYPE == 1) & (cl.STATUS == 2) & (cl.NONPED.isna())]
ntas = pd.read_csv("data/nyc-nta-2020-2026-10-15.zip").rename(columns=str.lower)
ntas = gpd.GeoDataFrame(ntas, geometry=ntas.the_geom.map(wkt.loads), crs=4326).to_crs(32118)
ntas = ntas[ntas.ntatype == 0][["nta2020", "ntaname", "boroname", "geometry"]]
seg = gpd.overlay(streets[["geometry"]], ntas, how="intersection", keep_geom_type=True)
km = seg.assign(km=seg.length / 1000).groupby("nta2020").km.sum()
alive = trees[trees.status == "Alive"]
pts = gpd.GeoDataFrame(alive, geometry=gpd.points_from_xy(alive.x_sp, alive.y_sp), crs=2263).to_crs(32118)
n = gpd.sjoin(pts[["geometry"]], ntas, predicate="within").groupby("nta2020").size()
dens = ntas.set_index("nta2020").assign(street_km=km, trees=n)
dens["per_km"] = dens.trees / dens.street_km
print(f"{dens.trees.sum():,.0f} trees on {dens.street_km.sum():,.0f} km of street in {len(dens)} residential neighbourhoods")
print(f"trees per km of street: city {dens.trees.sum() / dens.street_km.sum():.0f}, neighbourhood median {dens.per_km.median():.0f}")
print(dens.sort_values("per_km")[["ntaname", "boroname", "street_km", "trees", "per_km"]].iloc[[0, 1, -2, -1]].round(0).to_string())
643,943 trees on 9,767 km of street in 197 residential neighbourhoods
trees per km of street: city 66, neighbourhood median 66
ntaname boroname street_km trees per_km
nta2020
MN0502 Midtown-Times Square Manhattan 40.0 1033 26.0
MN0501 Midtown South-Flatiron-Union Square Manhattan 24.0 702 29.0
MN0803 Upper East Side-Yorkville Manhattan 19.0 2133 111.0
MN0702 Upper West Side (Central) Manhattan 37.0 4297 116.0
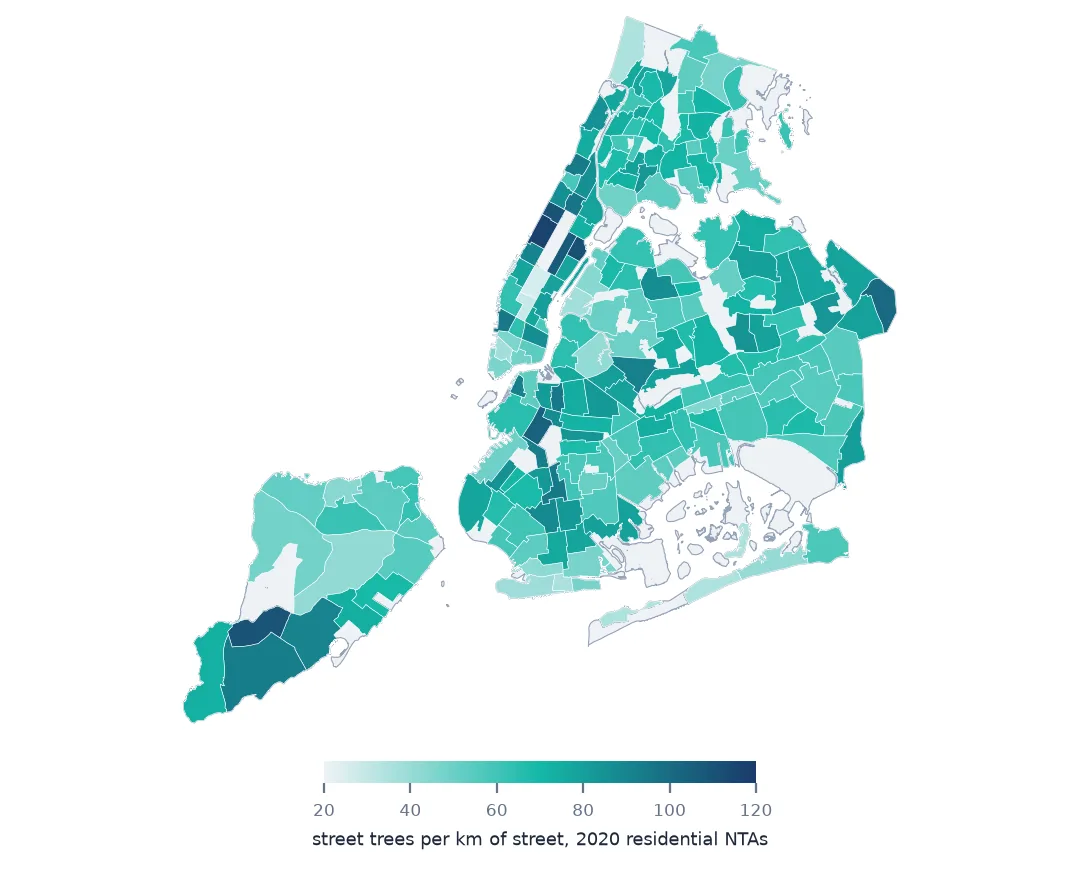
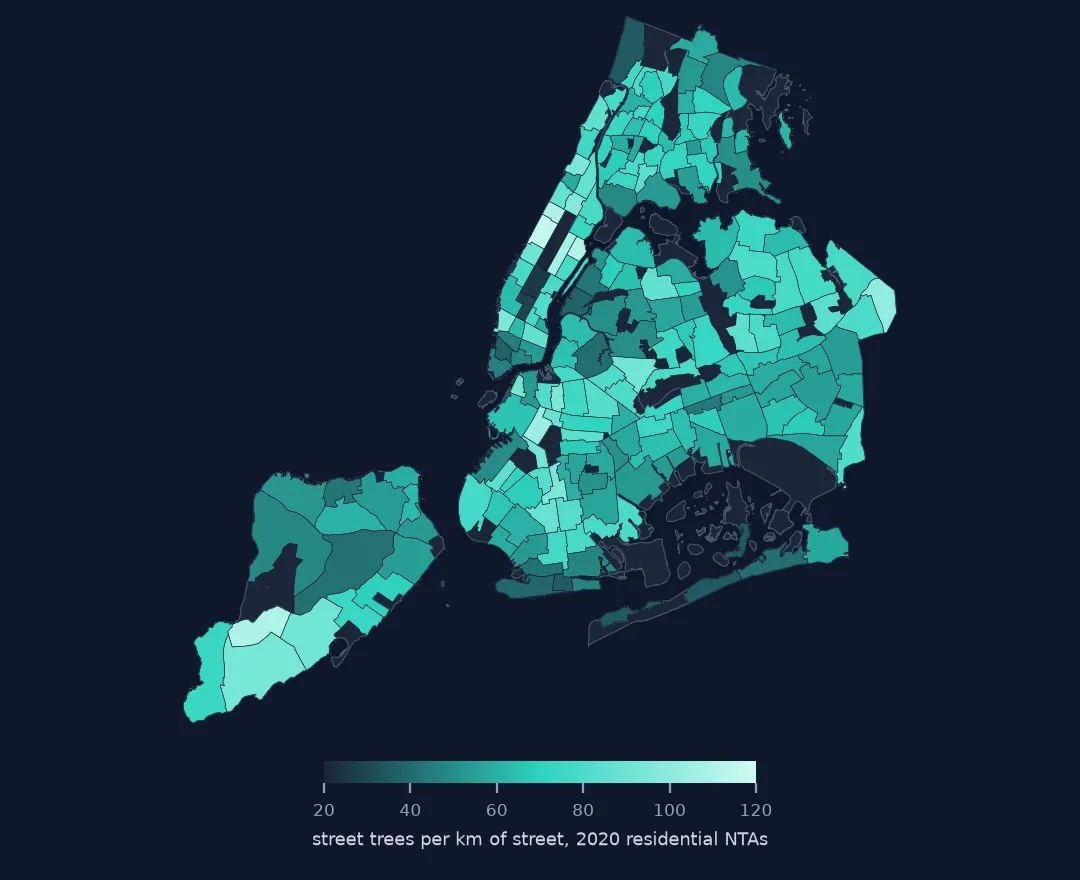
643,943 trees stand along 9,767 km of street in the city's 197 residential neighbourhoods: 66 per kilometre, and the median neighbourhood has the same. The extremes are both in Manhattan. Midtown–Times Square has 26 trees per km and Midtown South–Flatiron 29; the Upper West Side and Upper East Side–Yorkville have 116 and 111, more than four times as many on similar streets.
Streets, metres and polygons
1. Which centreline segments are streets
print("segments by roadway type (1 = street):", cl.RW_TYPE.value_counts().head(6).to_dict())
print("non-pedestrian flag:", cl.NONPED.value_counts(dropna=False).to_dict())
print(f"kept: {len(streets):,} of {len(cl):,} segments, {streets.length.sum() / 1000:,.0f} km")
segments by roadway type (1 = street): {1: 99359, 6: 5989, 2: 4127, 10: 3836, 9: 3570, 3: 3367}
non-pedestrian flag: {nan: 108161, 'V': 10161, 'D': 3991}
kept: 96,545 of 122,313 segments, 10,033 km
The centreline contains every kind of roadway: 99,359 segments are type 1, streets, and the rest are highways, bridges, ramps, paths and other types where nobody plants street trees. 10,161 segments are flagged V and 3,991 D in the non-pedestrian column. Keeping streets that exist and allow pedestrians leaves 96,545 segments and 10,033 km.
2. Measure in metres
print(streets.crs.name, "| units:", streets.crs.axis_info[0].unit_name)
print(f"segment length: median {streets.length.median():.0f} m")
NAD83 / New York Long Island | units: metre
segment length: median 81 m
Everything is reprojected to EPSG:32118, the New York Long Island state plane in metres, so lengths are lengths: a median segment, roughly one block, is 81 m.
3. Clip streets to neighbourhoods
print(f"{len(ntas)} residential neighbourhoods (ntatype 0); street km after clipping {seg.length.sum() / 1000:,.0f}")
print(f"trees not inside any of them: {len(pts) - n.sum():,}")
197 residential neighbourhoods (ntatype 0); street km after clipping 9,767
trees not inside any of them: 8,230
Non-residential areas — parks, airports, cemeteries — are left out, which removes their streets and the 8,230 trees that stand in them or fall outside every residential polygon. overlay cuts segments that cross a boundary, so each kilometre counts in exactly one neighbourhood.
4. Per kilometre or per square kilometre
dens["per_km2"] = dens.trees / (dens.geometry.area / 1e6)
print(f"rank correlation of trees per street km and per square km: {dens.per_km.corr(dens.per_km2, method='spearman'):.2f}")
print(dens.sort_values("per_km2").iloc[[-1]][["ntaname", "per_km", "per_km2"]].round(0).to_string())
rank correlation of trees per street km and per square km: 0.86
ntaname per_km per_km2
nta2020
MN0802 Upper East Side-Carnegie Hill 107.0 2189.0
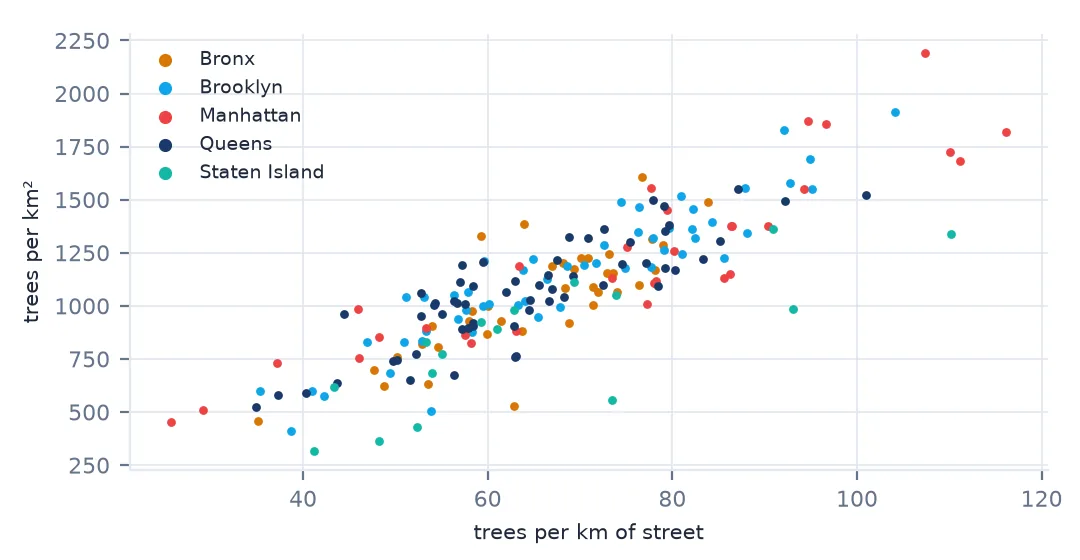
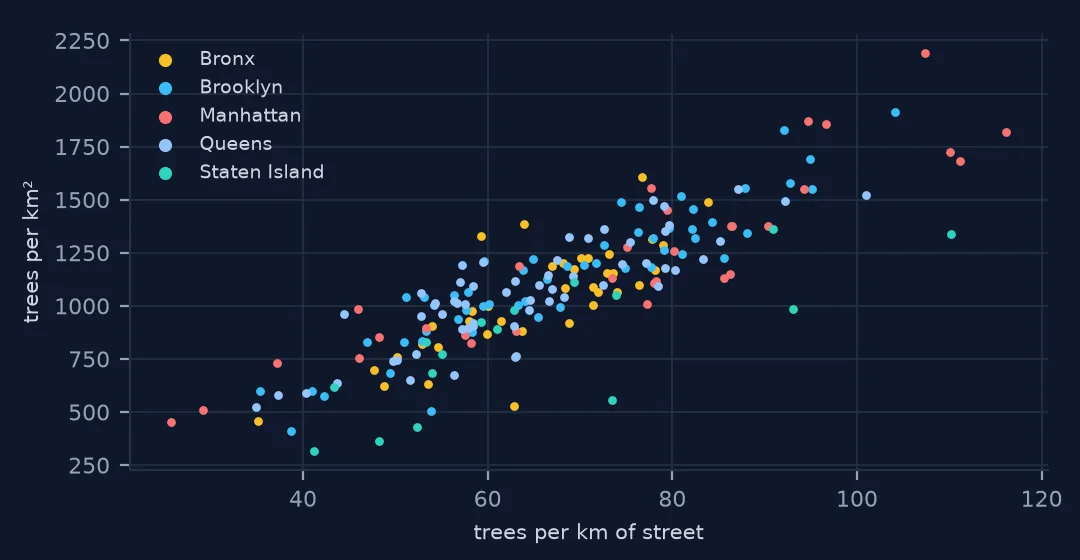
Trees per square kilometre ranks neighbourhoods similarly (0.86), but rewards dense street grids: Carnegie Hill has 107 trees per km of street and 2,189 per square kilometre, because its blocks are short and its streets close together. Per kilometre of street is the fairer measure of how well streets are planted; per area is closer to how much canopy a resident lives under.
Boroughs and room for more
The data used on this page
New York City Department of Parks and Recreation, TreesCount! 2015 Street Tree Census on NYC Open Data: one row for every street tree, stump and dead tree mapped by staff and volunteers in 2015–2016, with species, trunk diameter, health and site conditions. Streets are NYC's street centerline (CSCL) and neighbourhoods the 2020 Neighborhood Tabulation Areas, both in copies saved on this site on 15 October 2026 because the city edits them continually.
from pathlib import Path

import numpy as np
import pandas as pd
import requests

Path("data").mkdir(exist_ok=True)
SOCRATA = "https://data.cityofnewyork.us/api/views/{}/rows.csv?accessType=DOWNLOAD"
f = Path("data/nyc-street-tree-census-2015.csv")
if not f.exists():
    # TreesCount! 2015, the finished census (220 MB), NYC Open Data dataset uvpi-gqnh
    f.write_bytes(requests.get(SOCRATA.format("uvpi-gqnh"), timeout=1800).content)
# NYC's centreline and 2020 neighbourhood files are edited continually; these are the copies of 15 October 2026
# (live: NYC Open Data datasets inkn-q76z and 9nt8-h7nd).
for name in ["nyc-centerline-2026-10-15.zip", "nyc-nta-2020-2026-10-15.zip"]:
    if not Path(f"data/{name}").exists():
        Path(f"data/{name}").write_bytes(requests.get(f"https://data.spatialworkflow.io/{name}", timeout=600).content)
trees = pd.read_csv(f, low_memory=False)
print(f"{len(trees):,} trees, {trees.status.eq('Alive').sum():,} alive")
683,788 trees, 652,173 alive
Example 1: by borough
bor = dens.groupby("boroname")[["trees", "street_km"]].sum()
bor["per_km"] = bor.trees / bor.street_km
print(bor.round(0).astype(int).to_string())
trees street_km per_km
boroname
Bronx 78712 1281 61
Brooklyn 167539 2522 66
Manhattan 61184 815 75
Queens 235378 3646 65
Staten Island 101130 1503 67
By borough the differences are small: Manhattan has 75 trees per km of street, the Bronx 61, the others 65–67. The variation is within boroughs, between neighbourhoods.
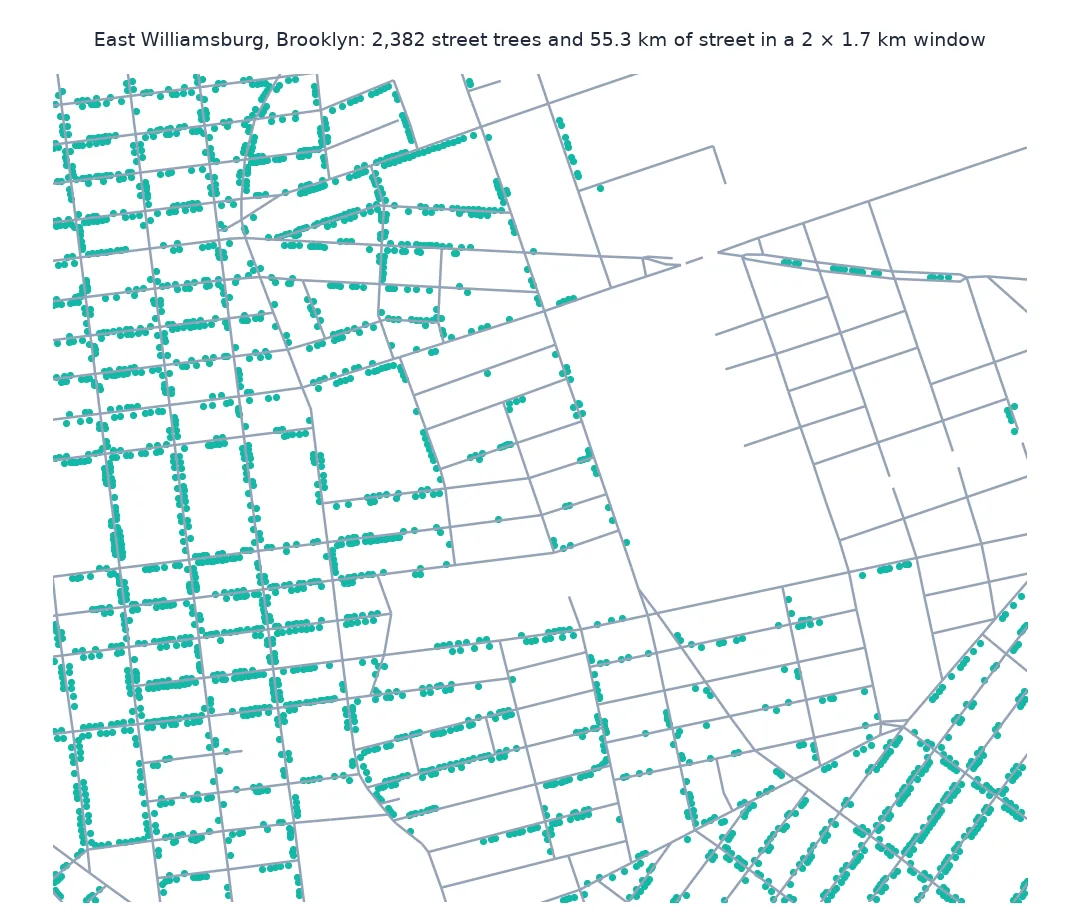
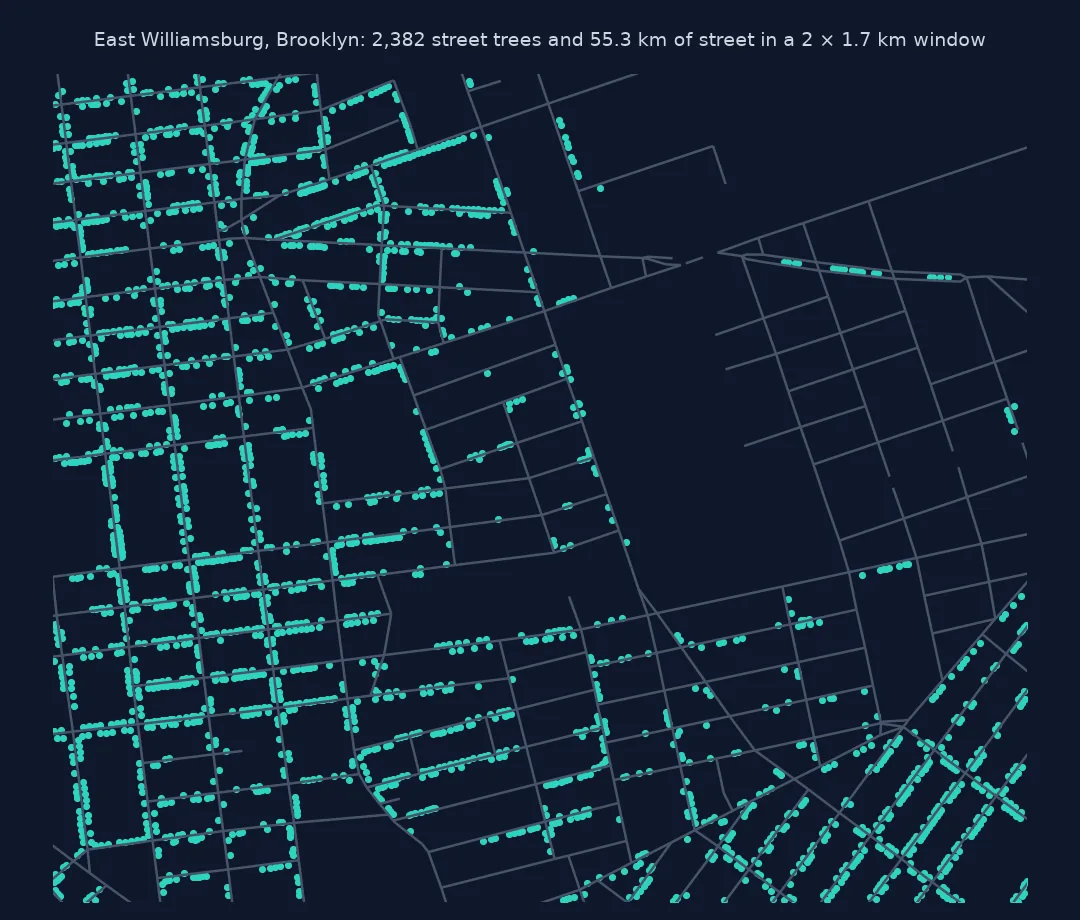
Example 2: how full could the streets be
spacing_m = 1000 / dens.per_km
print(f"implied spacing: median {spacing_m.median():.0f} m between trees per km of centreline")
print(f"neighbourhoods under 40 trees per km: {(dens.per_km < 40).sum()}; over 100: {(dens.per_km > 100).sum()}")
implied spacing: median 15 m between trees per km of centreline
neighbourhoods under 40 trees per km: 8; over 100: 7
Sixty-six trees per kilometre of centreline means one tree every 15 m — counting both sides of the street, so 30 m apart on each side in a typical neighbourhood. 8 neighbourhoods have fewer than 40 trees per km and 7 more than 100. How to find gaps in street tree planting finds where the missing trees would go.
Choosing the denominator
A rate is only as fair as its denominator. Population, area and street length each answer a different question: trees per resident is about who benefits, trees per area about canopy, trees per kilometre of street about how fully the planting sites are used. Street trees live on streets, and a neighbourhood with long industrial streets and few residents should not look well planted because it has few people, nor poorly planted because it is large.
The work is in making the denominator honest. The centreline is a model of every roadway the city maintains, so it must be filtered to the kind of street a tree could stand on, cut at the neighbourhood boundaries, and measured in a projected CRS. Each of those choices is visible in the code and changes the result, which is why the counts of what was kept are printed alongside it.
Pitfalls with per-kilometre rates
- Filter the centreline to streets; highways and ramps inflate the denominator.
- Measure in metres. Degrees and survey feet give wrong lengths.
- Clip segments at boundaries with
overlay, or long segments are counted twice. - Centreline length counts both sides once. Halve the spacing for one side of the street.
- Parks have streets and trees too. Decide whether non-residential areas belong in the comparison.
Internal links
- How to analyse New York's street tree census — the trees
- How to find gaps in street tree planting — the same question tree by tree
- Neighbourhood codes that match no boundary — why this page joins by location
- How to turn traffic counts into vehicle-kilometres — another per-kilometre measure
FAQ
How many street trees per kilometre does New York have?
66 per kilometre of street centreline across the 197 residential neighbourhoods, from 26 in Midtown–Times Square to 116 on the central Upper West Side.
Should I use trees per km of street or per square kilometre?
Per km of street for how fully streets are planted; per square kilometre for canopy. They rank New York's neighbourhoods similarly (0.86), but dense street grids score higher per area.