
How to Match USGS Wind Turbines to EIA-860 Wind Plants
On this page
Problem statement
Two federal datasets describe the same wind farms from different ends. The US Wind Turbine Database places each turbine on a map with its model and size. EIA-860 lists each wind plant's generators as their owners report them, with capacity, operating date and the plant code that links to monthly generation in EIA-923. Joined, they give generation per turbine model, capacity factors by rotor size, or a map of EIA plants drawn from real turbine positions. USGS stores the EIA plant code on most turbines as eia_id, so the join looks trivial. It mostly works, but wind farms built in phases are split differently on each side. This page joins version 9.1 to EIA-860 for 2025 and measures where the two agree.
Quick answer
Total the turbines by eia_id, total EIA-860's wind generators by Plant Code, and outer-join the two:
e = w.groupby("Plant Code").agg(name=("Plant Name", "first"), st=("State", "first"), mw_eia=("Nameplate Capacity (MW)", "sum"),
                                turbines_eia=("Number of Turbines", "sum"))
u = wt.groupby("eia_id").agg(turbines=("case_id", "size"), mw_usgs=("t_cap", lambda s: s.sum(min_count=1) / 1e3))
j = e.join(u, how="outer")
both = j.dropna(subset=["mw_eia", "turbines"])
print(f"EIA wind plants {len(e):,}; eia_id values {len(u):,}; in both {len(both):,}; EIA only {j.turbines.isna().sum()}; USGS only {j.mw_eia.isna().sum()}")
print(f"capacity within 1 MW: {((both.mw_usgs - both.mw_eia).abs() <= 1).mean():.1%}; turbine count equal: {(both.turbines == both.turbines_eia).mean():.1%}")
EIA wind plants 1,371; eia_id values 1,348; in both 1,276; EIA only 95; USGS only 72
capacity within 1 MW: 73.3%; turbine count equal: 79.2%
EIA-860 lists 1,371 operating wind plants and the turbine file uses 1,348 different plant codes. 1,276 appear in both. For those, the turbines' summed capacity is within 1 MW of EIA's nameplate capacity at 73.3% of plants, and the turbine counts agree exactly at 79.2%. Where they differ, the next steps show why.
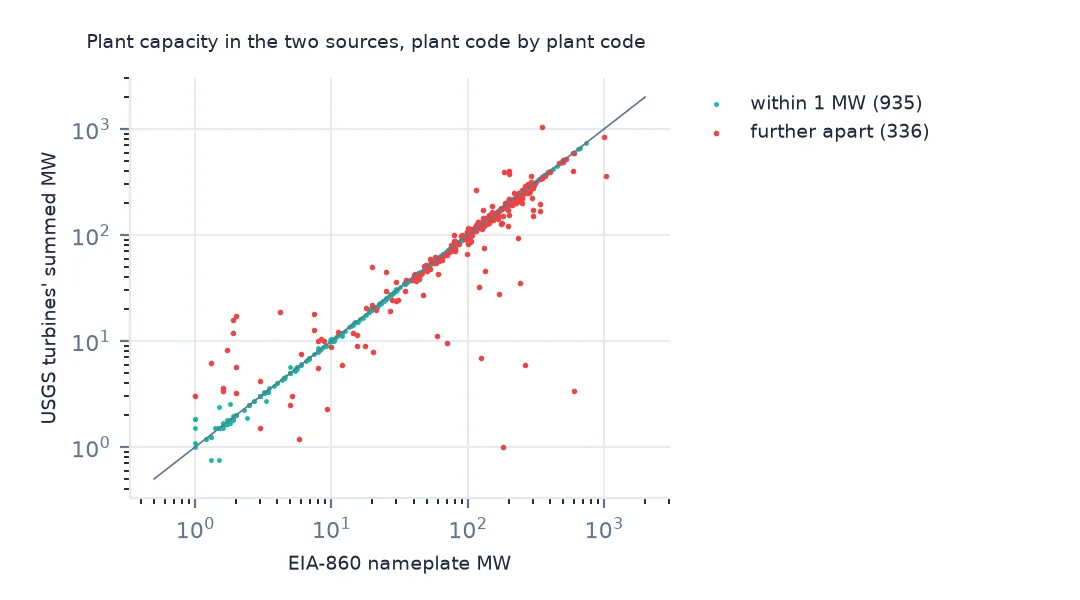
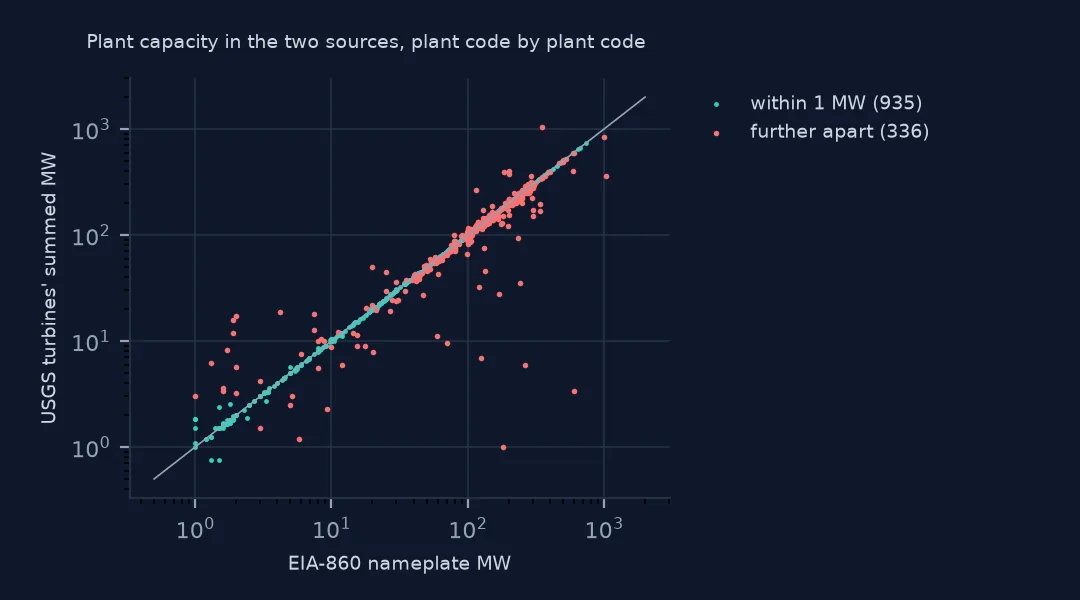
Where the two disagree
1. Turbines without a plant code
none = wt[wt.eia_id.isna()]
print(f"turbines with no eia_id: {len(none):,}, {none.t_cap.sum() / 1e3:,.1f} MW known; by project year:")
print(none.p_year.value_counts().sort_index().tail(4).to_string())
turbines with no eia_id: 5,051, 2,510.6 MW known; by project year:
p_year
2023.0 20
2024.0 82
2025.0 1666
2026.0 751
5,051 turbines have no plant code, and nearly all are from 2025 and 2026 projects: 1,666 and 751 of them. A plant reaches EIA-860 once it is operating, a year's data appears the following September, and USGS adds the code when it fills in the rest of the record. So the newest turbines are simply too new to link.
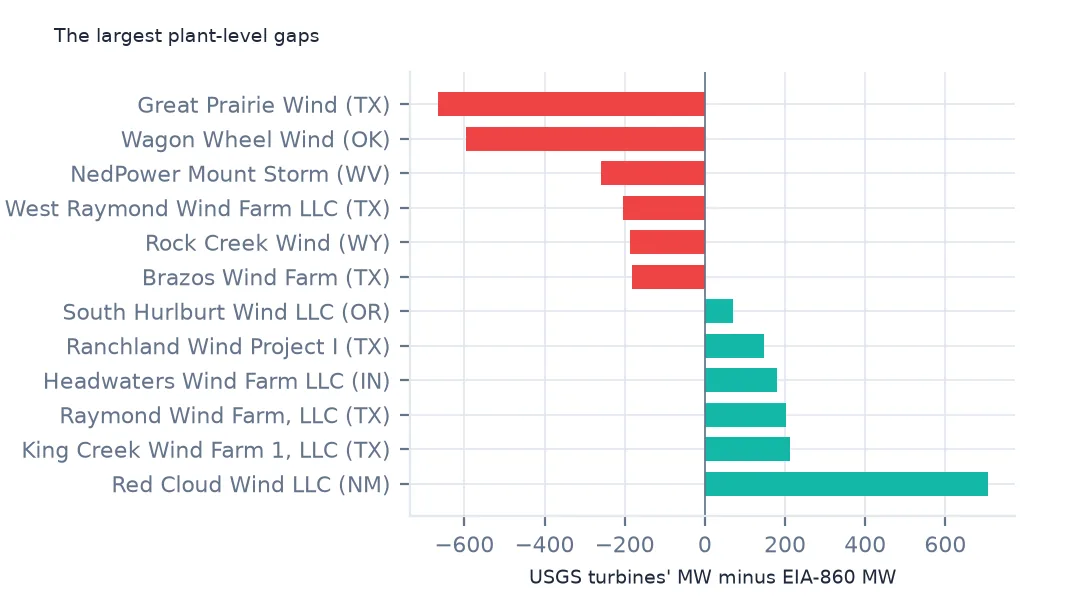
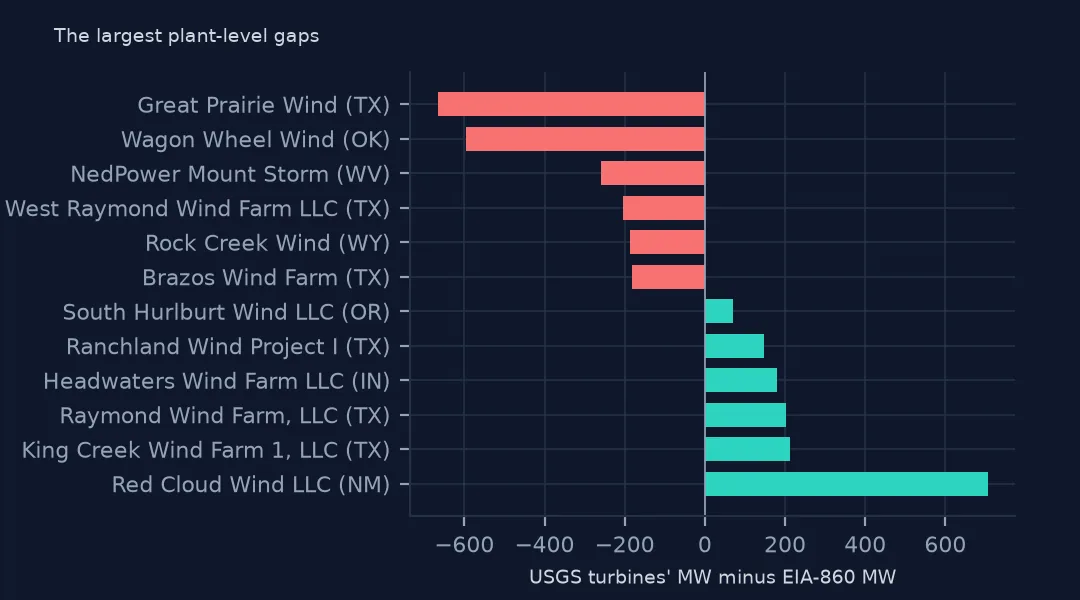
2. The largest gaps
gap = both.assign(diff=both.mw_usgs - both.mw_eia).dropna(subset=["diff"]).sort_values("diff")
print(gap[["name", "st", "mw_eia", "mw_usgs", "turbines_eia", "turbines"]].head(3).round(1).to_string(index=False))
print(gap[["name", "st", "mw_eia", "mw_usgs", "turbines_eia", "turbines"]].tail(3).round(1).to_string(index=False))
name st mw_eia mw_usgs turbines_eia turbines
Great Prairie Wind TX 1027.0 361.0 365.0 128.0
Wagon Wheel Wind OK 598.4 3.4 176.0 1.0
NedPower Mount Storm WV 264.0 6.0 132.0 3.0
name st mw_eia mw_usgs turbines_eia turbines
Raymond Wind Farm, LLC TX 200.2 401.4 91.0 184.0
King Creek Wind Farm 1, LLC TX 184.0 396.6 47.0 96.0
Red Cloud Wind LLC NM 350.0 1055.6 124.0 377.0
The largest gaps come from phases, unfinished records and codes on the wrong project. Great Prairie Wind has a third of its turbines under its own code and the rest under two others (Example 1). Wagon Wheel's other 161 turbines are in the file with no code and no capacity yet. Mount Storm's are most likely the 77 turbines filed as "unknown Grant County". At the other end, Raymond carries 93 turbines of its neighbour West Raymond, and King Creek 1 those of King Creek 2. The 377 turbines under Red Cloud's code all belong to a different project, Western Spirit. Matched plant by plant, one misfiled phase counts as two errors, though the turbines are all there.
3. Plants in only one file
eo = j[j.turbines.isna()].sort_values("mw_eia", ascending=False)
print(eo[["name", "st", "mw_eia"]].head(4).to_string(index=False), f"\nEIA-only capacity: {eo.mw_eia.sum():,.1f} MW")
uo = j[j.mw_eia.isna()]
print(f"USGS codes not among EIA's operating wind plants: {len(uo)}, {int(uo.turbines.sum()):,} turbines")
name st mw_eia
Clines Corners Wind Farm LLC NM 325.0
Tecolote Wind LLC NM 272.0
Lundgren Wind Project IA 270.9
Pryor Mountain Wind MT 239.8
EIA-only capacity: 2,728.4 MW
USGS codes not among EIA's operating wind plants: 72, 1,389 turbines
95 EIA plants, 2,728.4 MW, have no turbines under their code. Some are phases whose turbines USGS filed under a sibling's code, like Pryor Mountain Wind, whose turbines sit under code 59758 next door. Others are projects USGS has not reached yet. The 72 codes USGS uses that are not among EIA's operating wind plants hold 1,389 turbines: phases EIA reports under another code, and plants since retired or reported under a different technology.
Matching phases together
The data used on this page
The US Geological Survey's US Wind Turbine Database, version 9.1 of 28 September 2026 (Hoen and others, doi:10.5066/F7TX3DN0), public domain, and the wind table (3_2_Wind_Y2025.xlsx) of the US Energy Information Administration's Form EIA-860 for 2025, released in September 2026. Both were saved on this site on 19 October 2026, because USGS replaces its file every quarter and EIA revises the annual files.
from pathlib import Path
import zipfile

import pandas as pd
import requests

Path("data").mkdir(exist_ok=True)
# USGS US Wind Turbine Database v9.1 (28 September 2026) with its metadata and changelog, Census 2024 cartographic
# boundary counties and the EIA-860 2025 wind table. Saved 19 October 2026: USGS replaces the file every quarter.
# Live: https://energy.usgs.gov/uswtdb/assets/data/uswtdbCSV.zip and https://www.eia.gov/electricity/data/eia860/xls/eia8602025.zip
ARCHIVE = "usgs-uswtdb-v9-1-2026-10-19.zip"
if not Path(f"data/{ARCHIVE}").exists():
    Path(f"data/{ARCHIVE}").write_bytes(requests.get(f"https://data.spatialworkflow.io/{ARCHIVE}", timeout=600).content)
Z = zipfile.ZipFile(f"data/{ARCHIVE}")
wt = pd.read_csv(Z.open("uswtdb_V9_1_20260928.csv"), dtype={"t_fips": str})
w = pd.read_excel(Z.open("3_2_Wind_Y2025.xlsx"), sheet_name="Operable", header=1)
w = w[pd.to_numeric(w["Plant Code"], errors="coerce").notna()]       # the sheet ends in a note row
print(f"USWTDB v9.1: {len(wt):,} turbines; EIA-860 2025 operable wind generators: {len(w):,} at {w['Plant Code'].nunique():,} plants")
USWTDB v9.1: 77,839 turbines; EIA-860 2025 operable wind generators: 1,573 at 1,371 plants
Example 1: one complex, three codes
print(j[j.name.fillna("").str.contains("Great Prairie") | j.index.isin([64666, 64667])][["name", "mw_eia", "turbines_eia", "turbines", "mw_usgs"]].to_string()) name mw_eia turbines_eia turbines mw_usgs
Plant Code
64665.0 Great Prairie Wind 1027.0 365.0 128.0 360.96
64666.0 NaN NaN NaN 75.0 211.50
64667.0 NaN NaN NaN 107.0 301.74
Great Prairie Wind in Texas is one plant of 1,027 MW and 365 turbines to EIA. USGS splits it into three phases with their own codes, 128 turbines under EIA's code and 182 under two codes EIA doesn't use. Together the three hold 310 turbines and 874.2 MW. Matched code by code, it shows as one plant missing two thirds of its capacity and two plants unknown to EIA. Grouping codes that share a project name stem before comparing, or comparing at a coarser level, avoids that.
Example 2: compare by state
st = pd.DataFrame({"eia_mw": w.groupby("State")["Nameplate Capacity (MW)"].sum(),
                   "usgs_mw": wt.groupby("t_state").t_cap.sum() / 1e3}).dropna()
st["diff_pct"] = (st.usgs_mw / st.eia_mw - 1) * 100
print(st.sort_values("eia_mw", ascending=False).head(6).round(1).to_string())
print(f"states within 5%: {(st.diff_pct.abs() <= 5).sum()} of {len(st)}")
eia_mw usgs_mw diff_pct
TX 43942.4 43928.4 -0.0
OK 13594.4 12942.0 -4.8
IA 13411.1 13654.5 1.8
KS 9713.7 9696.6 -0.2
IL 8461.1 8478.9 0.2
CA 6478.8 6022.6 -7.0
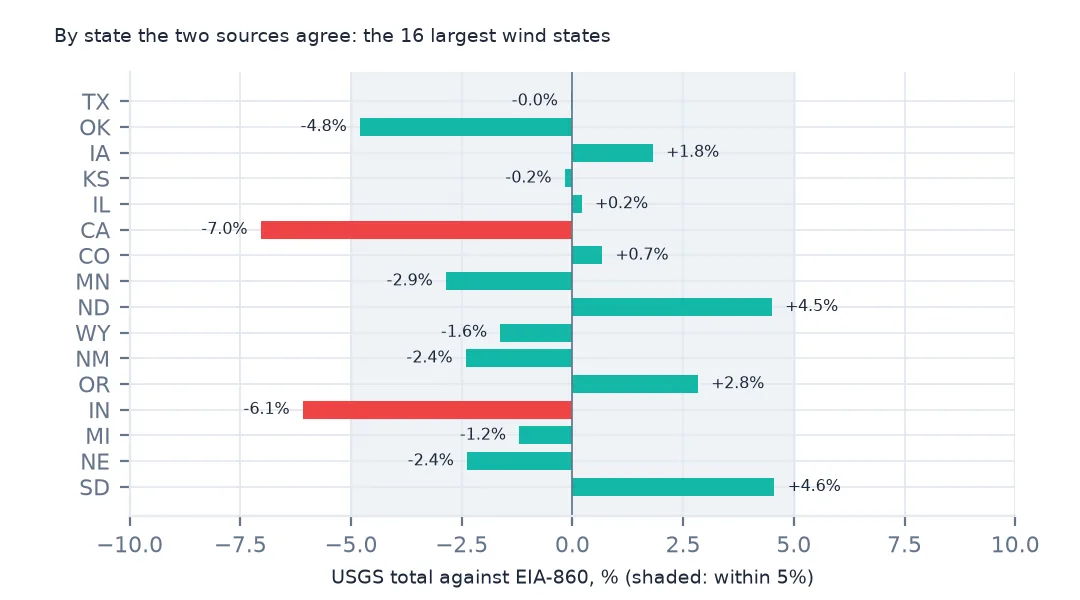
states within 5%: 36 of 43
By state the two sources agree far better: Texas's totals differ by 14 MW out of almost 44 GW, and 36 of the 43 states with wind are within 5%. California's turbine total is 7.0% below EIA's because 1,604 of its turbines have no capacity in the turbine file. Oklahoma's 4.8% is mostly Wagon Wheel, whose 161 turbines are still to be described. Plant-level mismatches mostly cancel within a state, so state and county totals from either source can be trusted much more than plant-level joins.
Internal links
- EIA-860 and EIA-923 explained — the plant and generator keys on the EIA side
- Nameplate or summer capacity — which EIA capacity column to compare
- Capacity by county — the USGS side mapped
- Capacity factors from EIA data — what the joined generation gives