
How to Find Agrivoltaic Solar Farms: Grazing, Crops and Pollinator Habitat
On this page
Problem statement
Agrivoltaics is solar that shares its land with something else that grows: sheep grazing between the rows, crops under raised panels, or pollinator meadows sown instead of gravel. It answers the commonest objection to solar farms, that they take land out of farming, and it is spreading fast in state incentive programmes. The USPVDB records it in p_agrivolt with three uses, crop, grazing and "es" for ecosystem services such as pollinator habitat, which can combine. This page counts each use, finds where agrivoltaic facilities are, and compares their size and mounting with other solar farms.
Quick answer
Split the comma-separated uses into one column each and count:
uses = pv.p_agrivolt.str.get_dummies(sep=",")
print(uses.sum().to_string())
ag = pv[pv.p_agrivolt != "non-agrivoltaic"]
print(f"agrivoltaic facilities: {len(ag)} ({len(ag) / len(pv):.1%}), {ag.p_cap_ac.sum():,.0f} MW AC ({ag.p_cap_ac.sum() / pv.p_cap_ac.sum():.1%})")
crop 9
es 330
grazing 174
non-agrivoltaic 6170
agrivoltaic facilities: 441 (6.7%), 6,603 MW AC (5.0%)
Ecosystem services is the most common use, at 330 facilities, then grazing at 174 and crops at only 9. Counted once each, 441 facilities, 6.7% of the total, are agrivoltaic, with 6,603 MW AC, 5.0% of the capacity. Crop agrivoltaics, the version in most news stories, is almost absent from US utility-scale solar.
The categories, the places and the plants
1. What the categories mean
print(pv.p_agrivolt.value_counts().to_string())p_agrivolt
non-agrivoltaic 6170
es 261
grazing 106
es,grazing 65
crop,es 3
crop 3
crop,grazing 2
crop,grazing,es 1
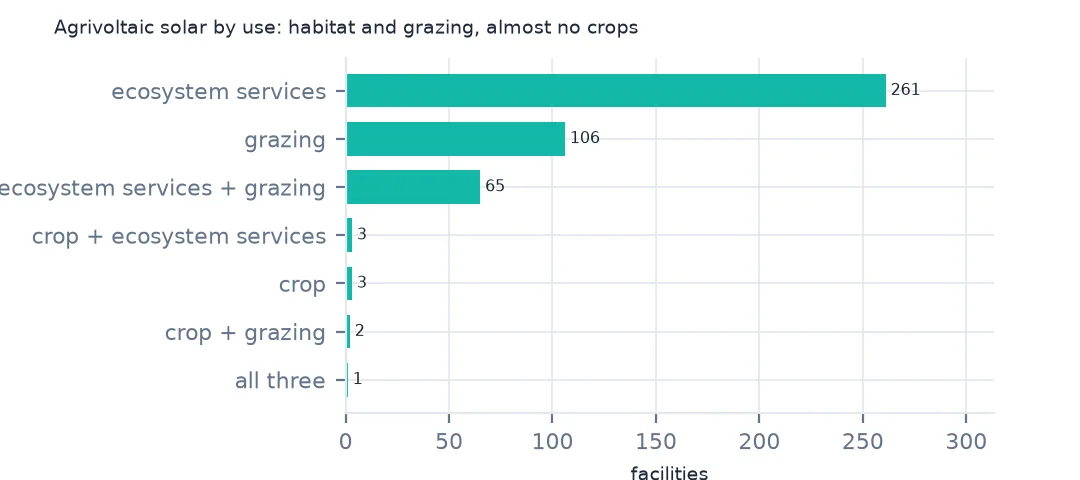
Most agrivoltaic facilities have one use: 261 ecosystem services only and 106 grazing only. 65 combine pollinator habitat with grazing, and the few crop sites are mostly combined with something else. "es" in the database means the ground cover is managed for habitat, typically native plants for pollinators, rather than gravel or mown grass.
2. Where they are
print(ag.groupby("p_state").agg(facilities=("case_id", "size"), mw_ac=("p_cap_ac", "sum")).sort_values("facilities", ascending=False).head(8).round(0).astype(int).to_string())
print(f"Minnesota's share of all ecosystem-services sites: {ag[ag.p_agrivolt.str.contains('es')].p_state.eq('MN').mean():.1%}")
facilities mw_ac
p_state
MN 213 682
NY 38 158
IL 34 440
MA 23 72
CA 22 1570
WI 22 300
TX 8 1150
IN 8 432
Minnesota's share of all ecosystem-services sites: 62.4%
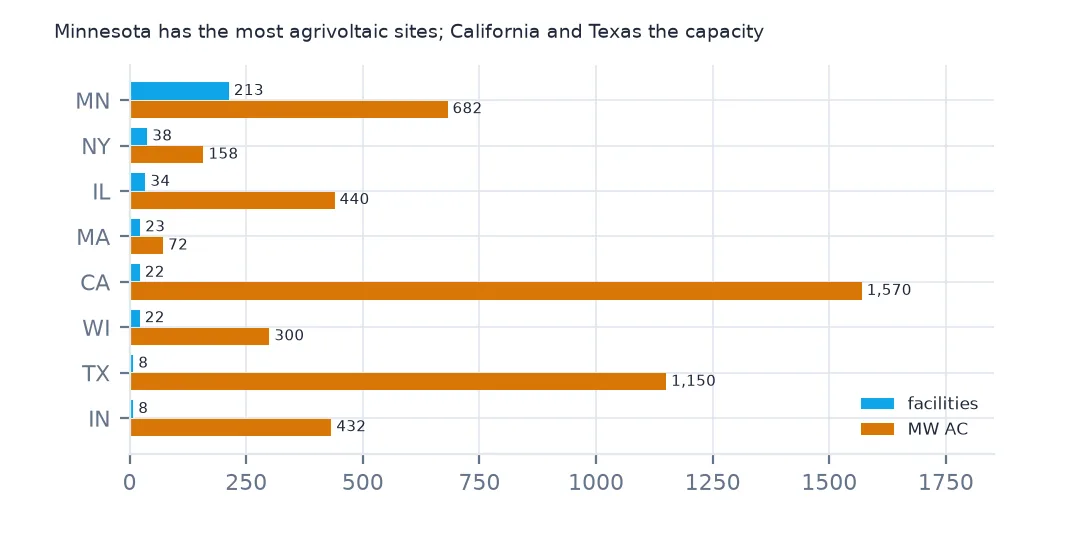
Minnesota dominates by count, with 213 agrivoltaic facilities, and holds 62.4% of all ecosystem-services sites: the state has a pollinator-friendly solar standard that many of its community solar gardens meet. By capacity the picture is different: California's 22 agrivoltaic plants hold 1,570 MW and Texas's 8 hold 1,150, almost all of it on grazed land.
3. Size and mounting
print(f"median MW AC: agrivoltaic {ag.p_cap_ac.median():.1f}, others {pv.loc[pv.p_agrivolt == 'non-agrivoltaic', 'p_cap_ac'].median():.1f}")
print(pd.crosstab(pv.p_agrivolt != "non-agrivoltaic", pv.p_axis.where(pv.p_axis.isin(["single-axis", "fixed-tilt"]), "other"), normalize="index").round(3).to_string())
median MW AC: agrivoltaic 2.2, others 3.3
p_axis fixed-tilt other single-axis
p_agrivolt
False 0.474 0.056 0.470
True 0.415 0.027 0.558
Agrivoltaic facilities are smaller than other solar farms, with a median of 2.2 MW AC against 3.3, because the Minnesota gardens are small. They use single-axis trackers somewhat more often, 55.8% against 47.0%, and fixed tilt less, which fits the large grazed plants in California and Texas.
Agrivoltaic facilities by year
The data used on this page
The US Geological Survey and Lawrence Berkeley National Laboratory's US Large-Scale Solar Photovoltaic Database (USPVDB), version 4.0 of 14 April 2026 (Fujita and others, doi:10.5066/P9IA3TUS), public domain, as GeoJSON with the metadata and changelog from the download. USGS replaces the files at the same address with each version, so version 4.0 was saved on this site on 28 October 2026. Capacities are megawatts, areas square metres of panels and inverters.
from pathlib import Path
import zipfile

import geopandas as gpd
import numpy as np
import pandas as pd
import requests

Path("data").mkdir(exist_ok=True)
# USGS/LBNL US Large-Scale Solar Photovoltaic Database (USPVDB) version 4.0 of April 2026 (doi:10.5066/P9IA3TUS),
# array outlines as GeoJSON, with the Census Bureau's 2024 counties and states. Saved 28 October 2026: each new
# version replaces the files at the same address.
# Live: https://energy.usgs.gov/uspvdb/assets/data/uspvdbGeoJSON.zip
ARCHIVE = "usgs-uspvdb-v4-0-2026-10-28.zip"
if not Path(f"data/{ARCHIVE}").exists():
    Path(f"data/{ARCHIVE}").write_bytes(requests.get(f"https://data.spatialworkflow.io/{ARCHIVE}", timeout=600).content)
Z = zipfile.ZipFile(f"data/{ARCHIVE}")
for f in ["uspvdb_v4_0_20260414.geojson", "cb_2024_us_county_20m.zip", "cb_2024_us_state_20m.zip"]:
    if not Path(f"data/{f}").exists():
        Path(f"data/{f}").write_bytes(Z.read(f))
pv = gpd.read_file("data/uspvdb_v4_0_20260414.geojson")
print(f"USPVDB 4.0: {len(pv):,} solar facilities, {pv.p_cap_ac.sum():,.0f} MW AC")
USPVDB 4.0: 6,611 solar facilities, 131,574 MW AC
Example 1: by year
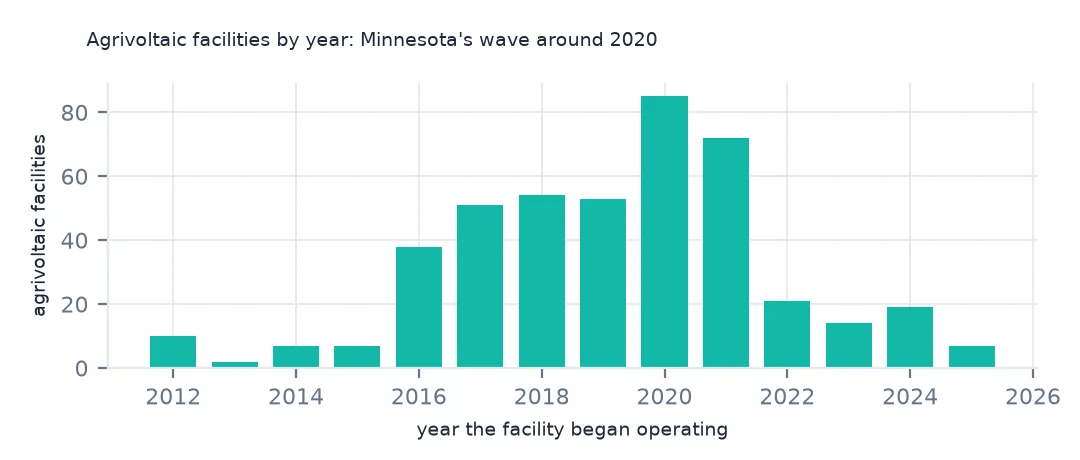
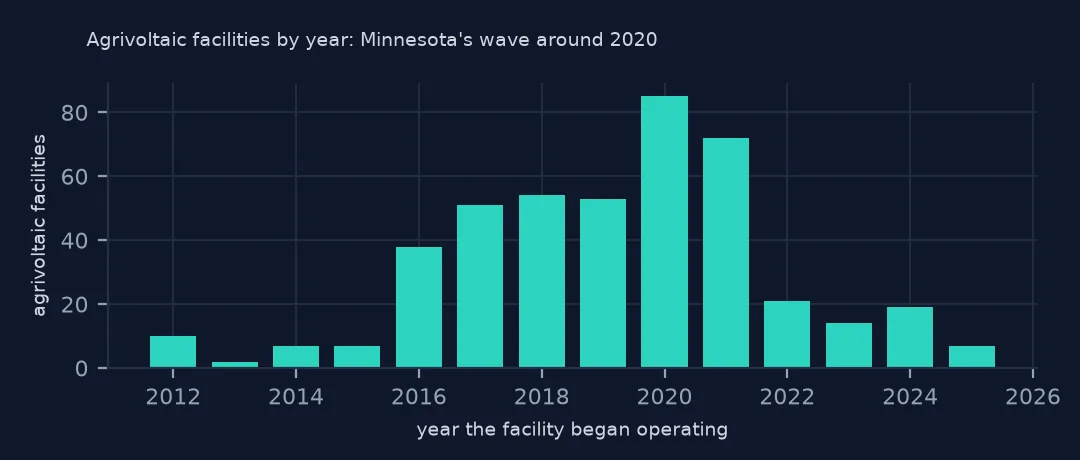
print(ag.groupby("p_year").size().loc[2015:].to_string())p_year
2015 7
2016 38
2017 51
2018 54
2019 53
2020 85
2021 72
2022 21
2023 14
2024 19
2025 7
The years show a wave, not a trend: 38 agrivoltaic facilities began operating in 2016, 85 in 2020 and 72 in 2021, then only 21 in 2022 and 7 in 2025. The peak is Minnesota's community solar programme; the recent dip may be partly recording, since land use is checked on imagery and the newest plants are the least likely to be classified yet.
Internal links
- Solar on landfills — the other way to avoid farmland
- Solar farm land use — how much ground the arrays take
- Agriculture topic — crop and land data
- Reading the database — the other columns