
How to Find Solar Farms Built on Landfills and Superfund Sites
On this page
Problem statement
Building solar on closed landfills, former Superfund sites and old mines puts land that has no other use back to work, and it avoids the fight over farmland that greenfield plants often face. The USPVDB marks each facility's land type in p_type, mostly from the EPA's RE-Powering America's Land initiative, which tracks renewable energy on contaminated and disturbed land. This page counts the facilities on each kind of reused land, maps where they are, compares their size with greenfield plants, and checks how many are community solar.
Quick answer
Group the facilities by land type and add up what is not greenfield:
t = pv.groupby("p_type").agg(facilities=("case_id", "size"), mw_ac=("p_cap_ac", "sum"), median_mw=("p_cap_ac", "median"))
print(t.sort_values("facilities", ascending=False).round(1).to_string())
re = pv[pv.p_type != "greenfield"]
print(f"on previously used land: {len(re)} facilities, {re.p_cap_ac.sum():,.0f} MW AC ({re.p_cap_ac.sum() / pv.p_cap_ac.sum():.1%})")
facilities mw_ac median_mw
p_type
greenfield 6332 130254.0 3.4
landfill 104 318.6 2.2
landfill named 67 202.2 2.0
PCSC 53 448.2 2.0
superfund 38 235.7 3.2
RCRA 11 70.5 2.0
AML 6 44.3 4.2
on previously used land: 279 facilities, 1,320 MW AC (1.0%)
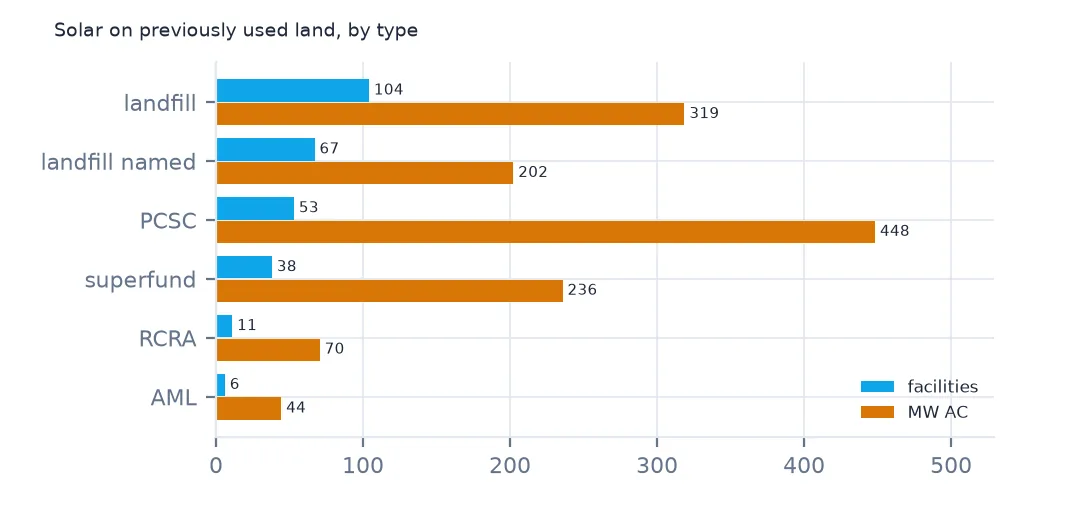
6,332 facilities are on greenfield land and 279 on land used before, with 1,320 MW AC, 1.0% of all capacity. Landfills are the largest group, 104 marked as landfills and 67 more as named landfill sites, then 53 PCSC sites, 38 Superfund sites, 11 RCRA sites and 6 on abandoned mine lands (AML). PCSC is a further category of previously used land in the RE-Powering data, most of it in New Jersey and Massachusetts; RCRA sites are hazardous-waste facilities under the Resource Conservation and Recovery Act.
Where, how big and for whom
1. Where they are
print(re.groupby("p_state").agg(facilities=("case_id", "size"), mw_ac=("p_cap_ac", "sum")).sort_values("facilities", ascending=False).head(8).round(0).astype(int).to_string()) facilities mw_ac
p_state
MA 91 233
NJ 61 286
NY 30 100
CA 15 367
RI 11 40
MD 8 43
IL 7 28
VT 7 16
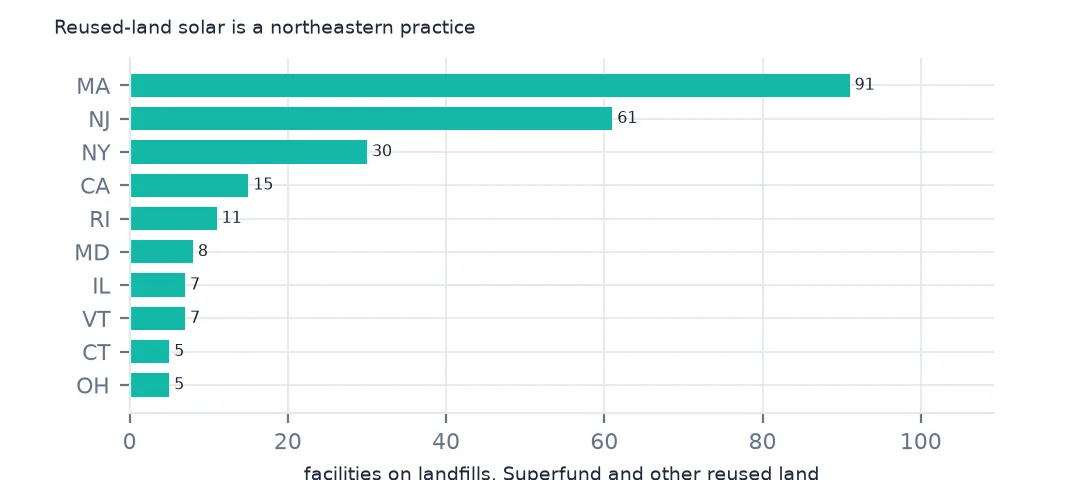
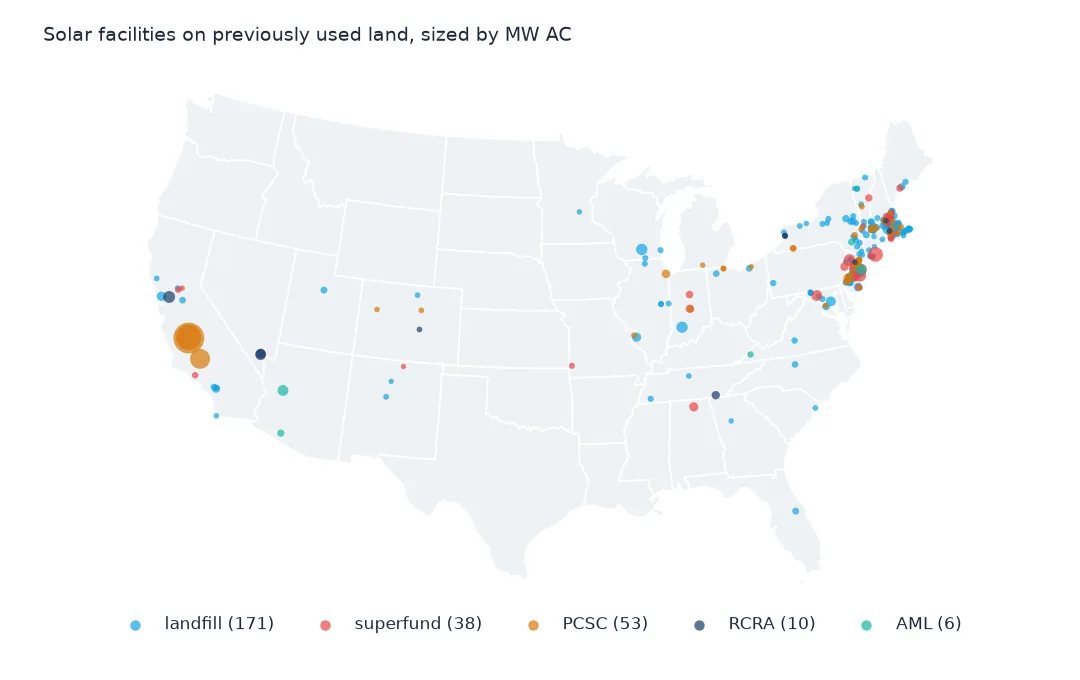
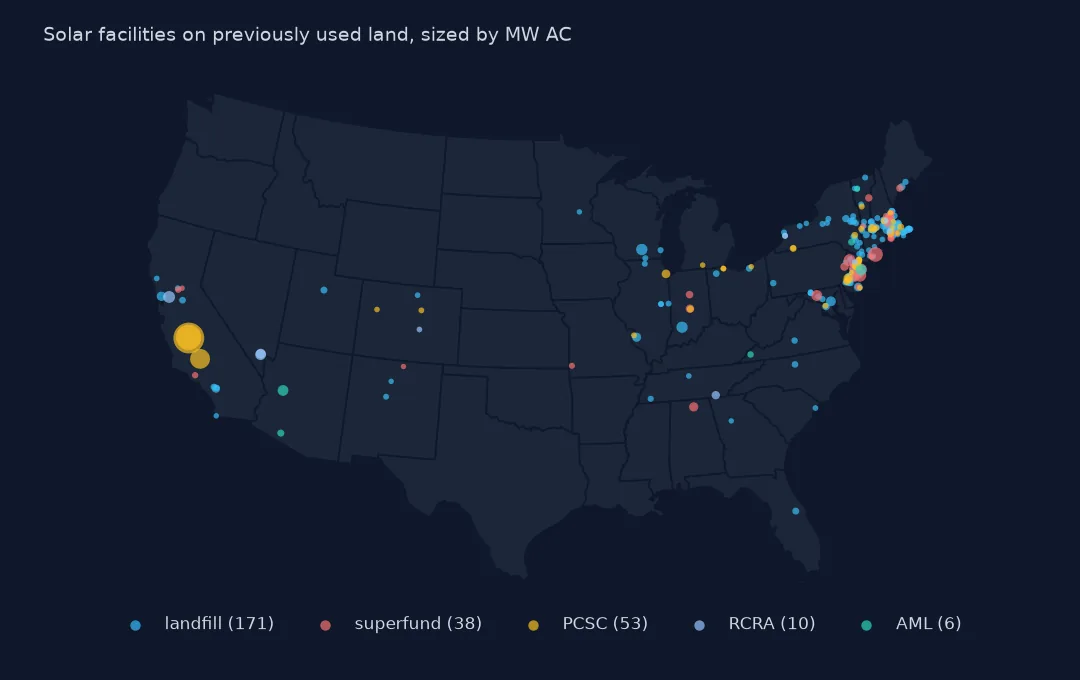
Reused-land solar is a northeastern practice. Massachusetts has 91 of the 279 facilities and New Jersey 61, then New York with 30; California has only 15 but the most capacity, 367 MW. Small states with many closed landfills and expensive land, and state programmes that reward brownfield sites, put their solar there.
2. How big they are
print(f"median MW AC: reused land {re.p_cap_ac.median():.1f}, greenfield {pv.loc[pv.p_type == 'greenfield', 'p_cap_ac'].median():.1f}")
print(re.nlargest(5, "p_cap_ac")[["p_name", "p_state", "p_type", "p_cap_ac", "p_year"]].to_string(index=False))
median MW AC: reused land 2.3, greenfield 3.4
p_name p_state p_type p_cap_ac p_year
Mustang Two CA PCSC 150.0 2020
RE Mustang, LLC CA PCSC 100.0 2016
Regulus Solar Project CA PCSC 60.0 2014
Long Island Solar Farm, LLC NY superfund 31.5 2011
EDF Ph1 Toms River NJ superfund 21.3 2021
Facilities on reused land are smaller, with a median of 2.3 MW AC against 3.4 MW on greenfield land, because a landfill cap is small and limits what can be built on it. The exceptions are large: Mustang Two in California, 150 MW, and RE Mustang, 100 MW, both on PCSC land, and the Long Island Solar Farm in New York, 31.5 MW on a Superfund site.
3. Community solar on landfills
print(pd.crosstab(pv.p_type == "greenfield", pv.p_comm.fillna("not community"), normalize="index").round(3).to_string())p_comm community solar not community
p_type
False 0.100 0.900
True 0.169 0.831
16.9% of the facilities on reused land are community solar, against 10.0% on greenfield land. Community solar programmes in Massachusetts, New Jersey and New York often favour landfill and brownfield sites, which matches the states that lead the list.
The sites by type
The data used on this page
The US Geological Survey and Lawrence Berkeley National Laboratory's US Large-Scale Solar Photovoltaic Database (USPVDB), version 4.0 of 14 April 2026 (Fujita and others, doi:10.5066/P9IA3TUS), public domain, as GeoJSON with the metadata and changelog from the download. USGS replaces the files at the same address with each version, so version 4.0 was saved on this site on 28 October 2026. Capacities are megawatts, areas square metres of panels and inverters.
from pathlib import Path
import zipfile

import geopandas as gpd
import numpy as np
import pandas as pd
import requests

Path("data").mkdir(exist_ok=True)
# USGS/LBNL US Large-Scale Solar Photovoltaic Database (USPVDB) version 4.0 of April 2026 (doi:10.5066/P9IA3TUS),
# array outlines as GeoJSON, with the Census Bureau's 2024 counties and states. Saved 28 October 2026: each new
# version replaces the files at the same address.
# Live: https://energy.usgs.gov/uspvdb/assets/data/uspvdbGeoJSON.zip
ARCHIVE = "usgs-uspvdb-v4-0-2026-10-28.zip"
if not Path(f"data/{ARCHIVE}").exists():
    Path(f"data/{ARCHIVE}").write_bytes(requests.get(f"https://data.spatialworkflow.io/{ARCHIVE}", timeout=600).content)
Z = zipfile.ZipFile(f"data/{ARCHIVE}")
for f in ["uspvdb_v4_0_20260414.geojson", "cb_2024_us_county_20m.zip", "cb_2024_us_state_20m.zip"]:
    if not Path(f"data/{f}").exists():
        Path(f"data/{f}").write_bytes(Z.read(f))
pv = gpd.read_file("data/uspvdb_v4_0_20260414.geojson")
print(f"USPVDB 4.0: {len(pv):,} solar facilities, {pv.p_cap_ac.sum():,.0f} MW AC")
USPVDB 4.0: 6,611 solar facilities, 131,574 MW AC
Example 1: a map of the reused sites
print(re.groupby("p_type").apply(lambda d: f"{len(d)} sites in {d.p_state.nunique()} states").to_string())p_type
AML 6 sites in 5 states
PCSC 53 sites in 12 states
RCRA 11 sites in 9 states
landfill 104 sites in 23 states
landfill named 67 sites in 13 states
superfund 38 sites in 12 states
The 104 landfill sites are spread over 23 states, the 38 Superfund sites over 12 and the 53 PCSC sites over 12. The abandoned mine sites are only 6, in 5 states, though coal country has much more such land.
Internal links
- Agrivoltaics — solar that shares land with farming
- Solar farm land use — how much land the arrays take
- Superfund and toxic releases — the EPA data on the sites themselves
- Solar capacity by county — every facility on a map