
How Many Solar Farms Does the US Have? The Large-Scale Solar Database's Count Explained
On this page
Problem statement
How many solar farms does the United States have? The usual answer, 6,611, comes from the US Large-Scale Solar Photovoltaic Database, and the number depends on its rules. It counts ground, rooftop, canopy and floating systems of a megawatt or more that the Energy Information Administration lists in Form 860 and that USGS and Lawrence Berkeley National Laboratory staff could outline on aerial imagery. Home rooftop panels, small commercial systems and anything EIA has not yet recorded are outside the count. This page shows what passes the threshold, how the two sources combine, how old each outline is and what changed in version 4.0.
Quick answer
Look at the smallest facilities and at the digitisers' confidence score:
print(f"facilities: {len(pv):,}; smallest: {pv.p_cap_ac.min()} MW AC; under 5 MW: {(pv.p_cap_ac < 5).mean():.1%} of facilities, {pv.loc[pv.p_cap_ac < 5, 'p_cap_ac'].sum() / pv.p_cap_ac.sum():.1%} of capacity")
print(pv.p_dig_conf.value_counts().sort_index().to_string())
facilities: 6,611; smallest: 0.2 MW AC; under 5 MW: 61.0% of facilities, 6.7% of capacity
p_dig_conf
1 39
2 216
3 92
4 6264
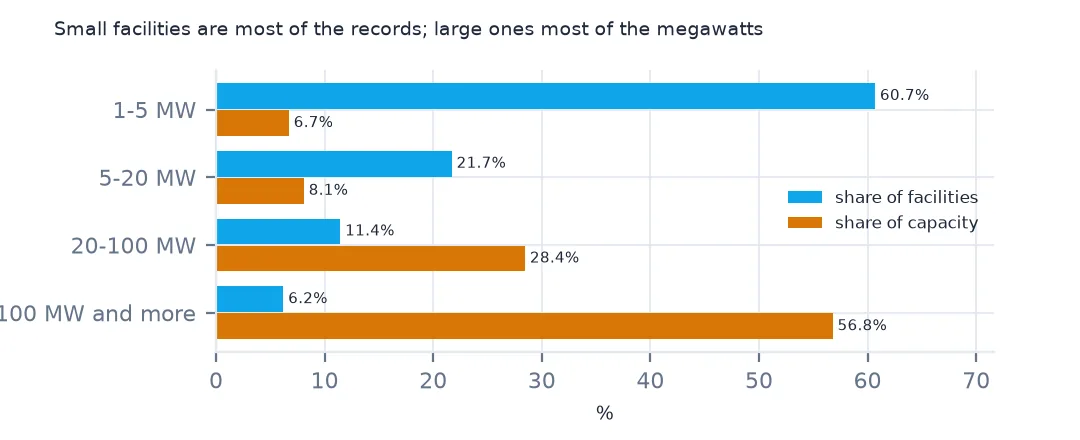
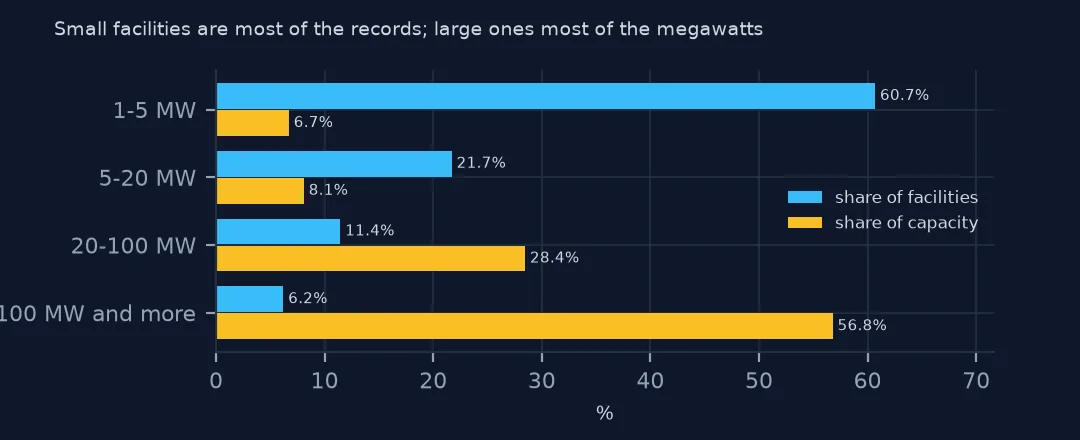
Most records are small. 61.0% of facilities are under 5 MW AC, but together they hold only 6.7% of the capacity. The smallest listed is 0.2 MW AC, so the 1 MW threshold is not applied to the AC column alone. The digitisers rate their confidence from 1 to 4, and 6,264 outlines have the top score; the 39 rated 1 are sites where the imagery could not confirm the arrays clearly.
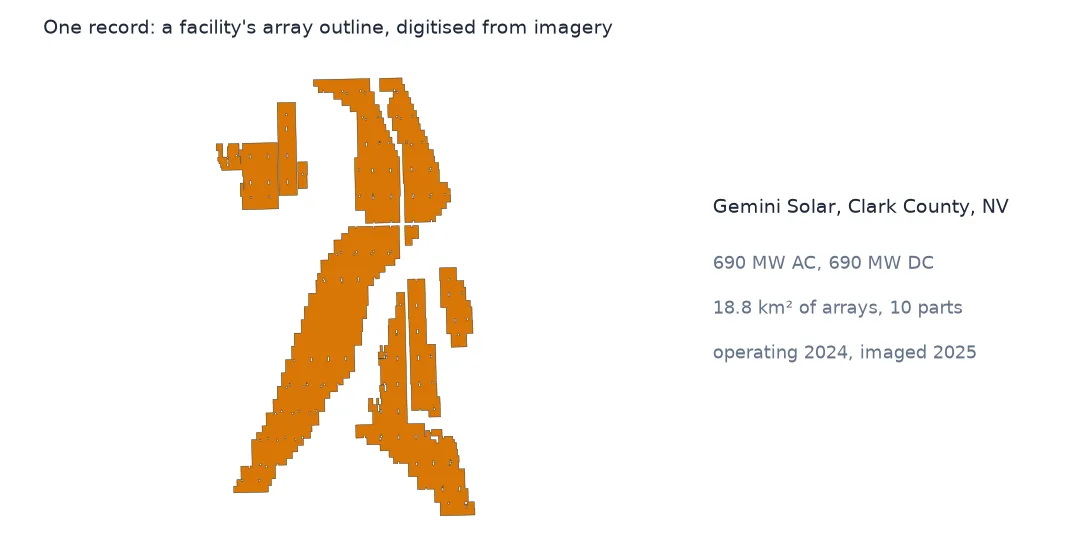
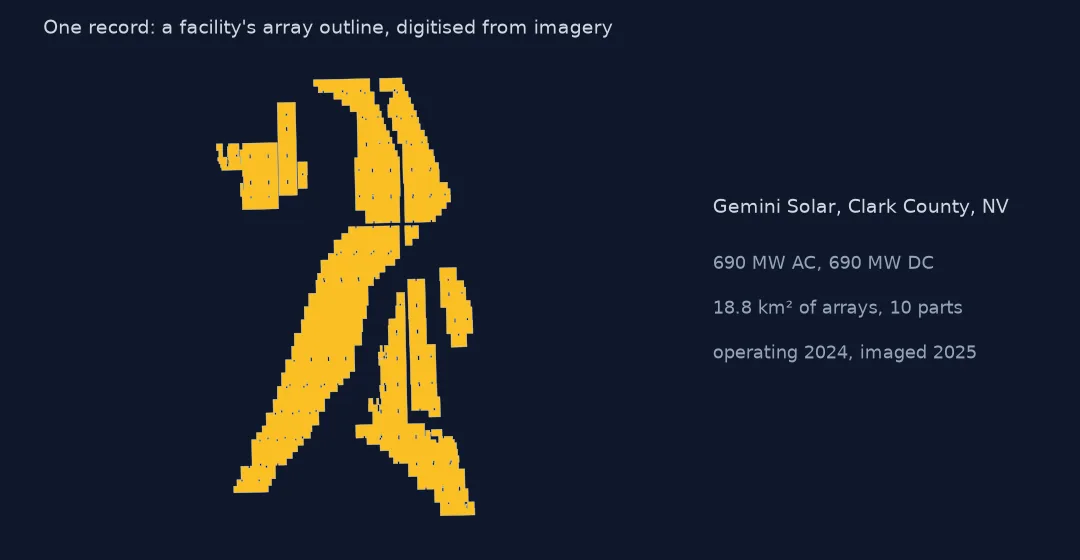
Two sources, one record
1. Built from two sources
print(f"every facility has an EIA plant id: {pv.eia_id.notna().all()}; distinct: {pv.eia_id.nunique():,}")
print(pv.p_pwr_reg.value_counts().head(8).to_string())
print(f"no power region: {pv.p_pwr_reg.isna().sum()} ({pv.loc[pv.p_pwr_reg.isna(), 'p_state'].value_counts().to_dict()})")
every facility has an EIA plant id: True; distinct: 6,611
p_pwr_reg
PJM 1049
MISO 990
ISNE 895
CISO 776
NYIS 616
CPLE 395
DUK 309
ERCO 178
no power region: 16 ({'HI': 7, 'MN': 6, 'AK': 1, 'NV': 1, 'CA': 1})
Every facility has an EIA plant id, all 6,611 distinct, so the database is EIA's list of solar plants, located and outlined. The power region comes from EIA too: PJM, the mid-Atlantic grid, has the most facilities, 1,049, then MISO in the Midwest and ISO New England. 16 records have none, seven of them in Hawaii, whose utilities are not in EIA's regional data.
2. How old the outline is
img = pd.to_datetime(pv.p_img_date.astype(str), format="%Y%m%d", errors="coerce")
print(f"image dates that are not dates: {img.isna().sum()} {pv.loc[img.isna(), 'p_img_date'].tolist()}")
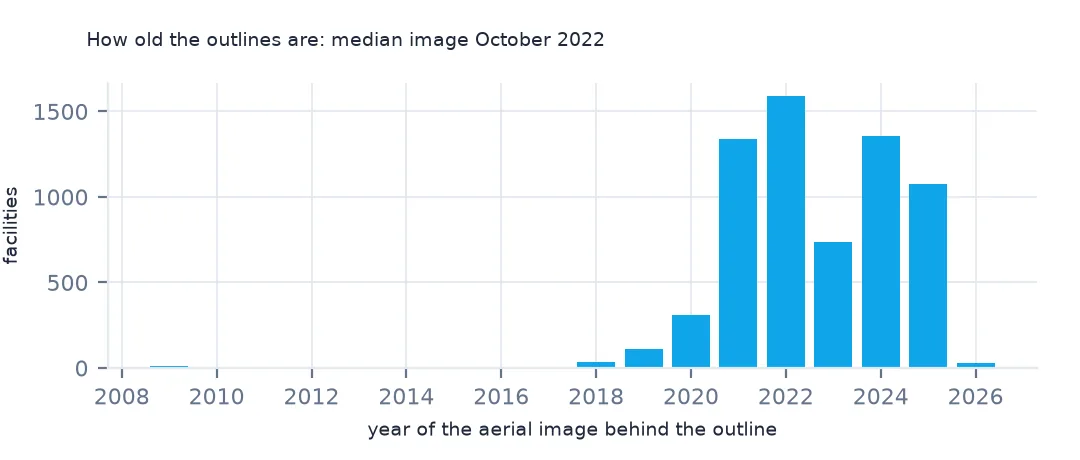
print(img.dt.year.value_counts().sort_index().to_string())
print(f"median image date: {img.median():%Y-%m-%d}")
image dates that are not dates: 1 [20240231]
p_img_date
2009.0 12
2010.0 3
2011.0 1
2012.0 2
2014.0 2
2015.0 1
2017.0 8
2018.0 33
2019.0 113
2020.0 307
2021.0 1340
2022.0 1588
2023.0 735
2024.0 1358
2025.0 1076
2026.0 31
median image date: 2022-10-18
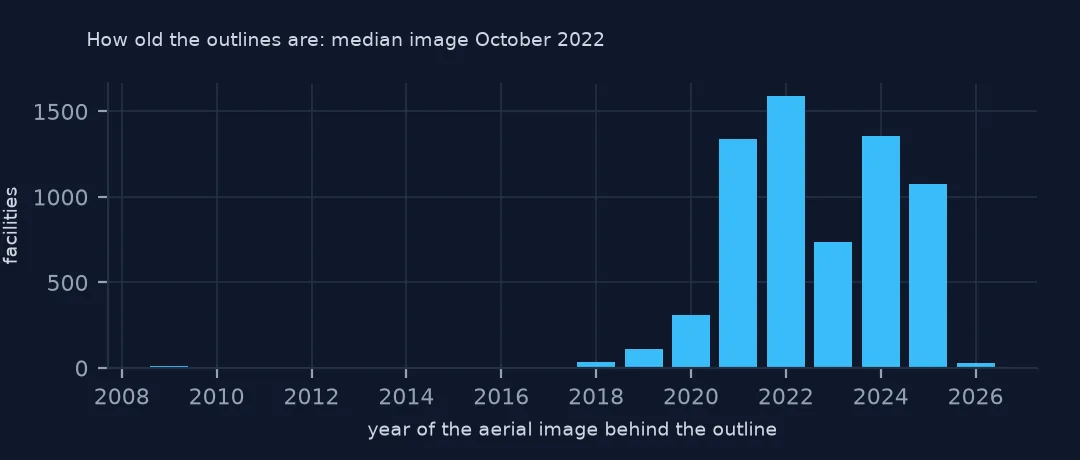
Each outline is as old as its image. The median image is from 18 October 2022, and most were taken between 2021 and 2025; 12 date from 2009. An array expanded since its image is drawn at its old size. One image date in the file, 20240231, is not a calendar date.
3. What changed in version 4.0
log = Z.read("CHANGELOG.txt").decode()
print(log.split("## [3.0.0]")[0].strip()[:600])
## [4.0.0] - 2026-04-14
Fourth public release of the USPVDB.
### Added
- 903 facility records.
### Removed
- 4 facility records determined to be under the capacity threshold of 1MW.
### Changed
- 53 updates to 'multi_poly'.
- 1 updates to 'p_state'.
- 22 updates to 'p_county'.
- 5708 updates to 'ylat'.
- 5708 updates to 'xlong'.
- 599 updates to 'p_area'.
- 274 updates to 'p_img_date'.
- 275 updates to 'p_dig_conf'.
- 3 updates to 'p_pwr_reg'.
- 2021 updates to 'p_tech_sec'.
- 5 updates to 'p_azimuth'.
- 19 updates to 'p_battery'.
- 143 updates to 'p_type'.
- 5708 upd
Version 4.0 added 903 facilities and removed 4 found to be below the 1 MW threshold. It also moved the representative points of 5,708 facilities and revised 599 areas, so a point or area from an earlier version is not comparable with this one. Cite the version you used.
Small facilities, most of the records
The data used on this page
The US Geological Survey and Lawrence Berkeley National Laboratory's US Large-Scale Solar Photovoltaic Database (USPVDB), version 4.0 of 14 April 2026 (Fujita and others, doi:10.5066/P9IA3TUS), public domain, as GeoJSON with the metadata and changelog from the download. USGS replaces the files at the same address with each version, so version 4.0 was saved on this site on 28 October 2026. Capacities are megawatts, areas square metres of panels and inverters.
from pathlib import Path
import zipfile

import geopandas as gpd
import numpy as np
import pandas as pd
import requests

Path("data").mkdir(exist_ok=True)
# USGS/LBNL US Large-Scale Solar Photovoltaic Database (USPVDB) version 4.0 of April 2026 (doi:10.5066/P9IA3TUS),
# array outlines as GeoJSON, with the Census Bureau's 2024 counties and states. Saved 28 October 2026: each new
# version replaces the files at the same address.
# Live: https://energy.usgs.gov/uspvdb/assets/data/uspvdbGeoJSON.zip
ARCHIVE = "usgs-uspvdb-v4-0-2026-10-28.zip"
if not Path(f"data/{ARCHIVE}").exists():
    Path(f"data/{ARCHIVE}").write_bytes(requests.get(f"https://data.spatialworkflow.io/{ARCHIVE}", timeout=600).content)
Z = zipfile.ZipFile(f"data/{ARCHIVE}")
for f in ["uspvdb_v4_0_20260414.geojson", "cb_2024_us_county_20m.zip", "cb_2024_us_state_20m.zip"]:
    if not Path(f"data/{f}").exists():
        Path(f"data/{f}").write_bytes(Z.read(f))
pv = gpd.read_file("data/uspvdb_v4_0_20260414.geojson")
print(f"USPVDB 4.0: {len(pv):,} solar facilities, {pv.p_cap_ac.sum():,.0f} MW AC")
USPVDB 4.0: 6,611 solar facilities, 131,574 MW AC
Example 1: small facilities, most of the records
bins = [1, 5, 20, 100, 1000]
t = pv.groupby(pd.cut(pv.p_cap_ac, bins, right=False)).p_cap_ac.agg(["size", "sum"])
t["share of facilities"] = (t["size"] / t["size"].sum()).map("{:.1%}".format); t["share of MW"] = (t["sum"] / t["sum"].sum()).map("{:.1%}".format)
print(t.drop(columns="sum").to_string())
size share of facilities share of MW
p_cap_ac
[1, 5) 3980 60.7% 6.7%
[5, 20) 1423 21.7% 8.1%
[20, 100) 750 11.4% 28.4%
[100, 1000) 406 6.2% 56.8%
By size class, the 3,980 facilities of 1 to 5 MW are 60.7% of the records and 6.7% of the megawatts, while the 406 of 100 MW or more are 6.2% of the records and 56.8% of the megawatts. A count of solar farms describes the small community projects of the Northeast and Midwest; a sum of capacity describes the large plants of Texas, California and the Southwest.
Getting the solar data without code
- Look first: the USPVDB Viewer maps every facility over imagery. Click an outline for its name, capacity, year, mounting, panel type and image date, or filter by state and size.
- Download: the data page offers the whole database as a shapefile, GeoJSON or CSV. The GeoJSON zip is under 10 MB; QGIS opens it by dragging it onto the map, and the CSV opens in a spreadsheet with a point for each facility.
- What is included: facilities of 1 MW or more in EIA Form 860 that could be confirmed on imagery. Panels on homes and small businesses are not in it, and a new plant appears only once EIA reports it and imagery shows it.
- How current it is: version 4.0 was published on 14 April 2026, and each version replaces the files at the same address; the changelog in the download lists what was added, removed and revised. There is also an API.
- The copy these pages use: downloaded on 28 October 2026 and saved at data.spatialworkflow.io.
- Credit: Fujita, K.S., and others, United States Large-Scale Solar Photovoltaic Database (ver. 4.0, April 2026), U.S. Geological Survey data release, doi:10.5066/P9IA3TUS. It is public domain. The method is described in Scientific Data (doi:10.1038/s41597-023-02644-8).
Internal links
- Reading the database — every column and its traps
- Wind turbines explained — the sister database for wind
- Solar growth by year — what the versions add
- AC and DC capacity — the two megawatt columns