
Fixing Airbnb Listing Coordinates That Are Not Exact
On this page
Problem statement
You plot Airbnb listings over a street map and many sit in the middle of roads, in parks or in rivers, listings you know are in one apartment building are scattered across a block, and a spatial join to small areas gives results that change when you look closely. Nothing is wrong with your code. Airbnb deliberately shifts each listing's published location by up to about 150 metres to protect hosts' privacy, and Inside Airbnb's data inherits those shifted coordinates.
This page measures the effect in the Inside Airbnb snapshot for Washington, D.C. of 24 June 2026. It checks how many listing points fall inside a building footprint from OpenStreetMap, looks at the spread of listings that belong to the same large operator, and shows which analyses the blurring affects and which it does not.
Quick answer
Treat each listing as an area about 150 m across, not a point. Buffer before joining to small areas:
G = gpd.GeoDataFrame(L, geometry=gpd.points_from_xy(L.longitude, L.latitude), crs=4326).to_crs(32618)
inside = gpd.sjoin(G[["id", "geometry"]], B[["geometry"]], predicate="within", how="left").groupby(level=0).index_right.count() > 0
print(f"listing points inside a building footprint: {inside.mean():.0%} of {len(G):,}")
G["zone"] = G.buffer(150)                                    # where the listing could actually be
print(f"area of a 150 m uncertainty circle: {G.zone.iloc[0].area / 1e4:.1f} ha")
listing points inside a building footprint: 47% of 6,945
area of a 150 m uncertainty circle: 7.1 ha
Fewer than half the listing points, 47%, fall inside any building footprint. The other 53% sit in streets, yards, parks or other open ground. A 150 m circle around each point covers 7.1 hectares.
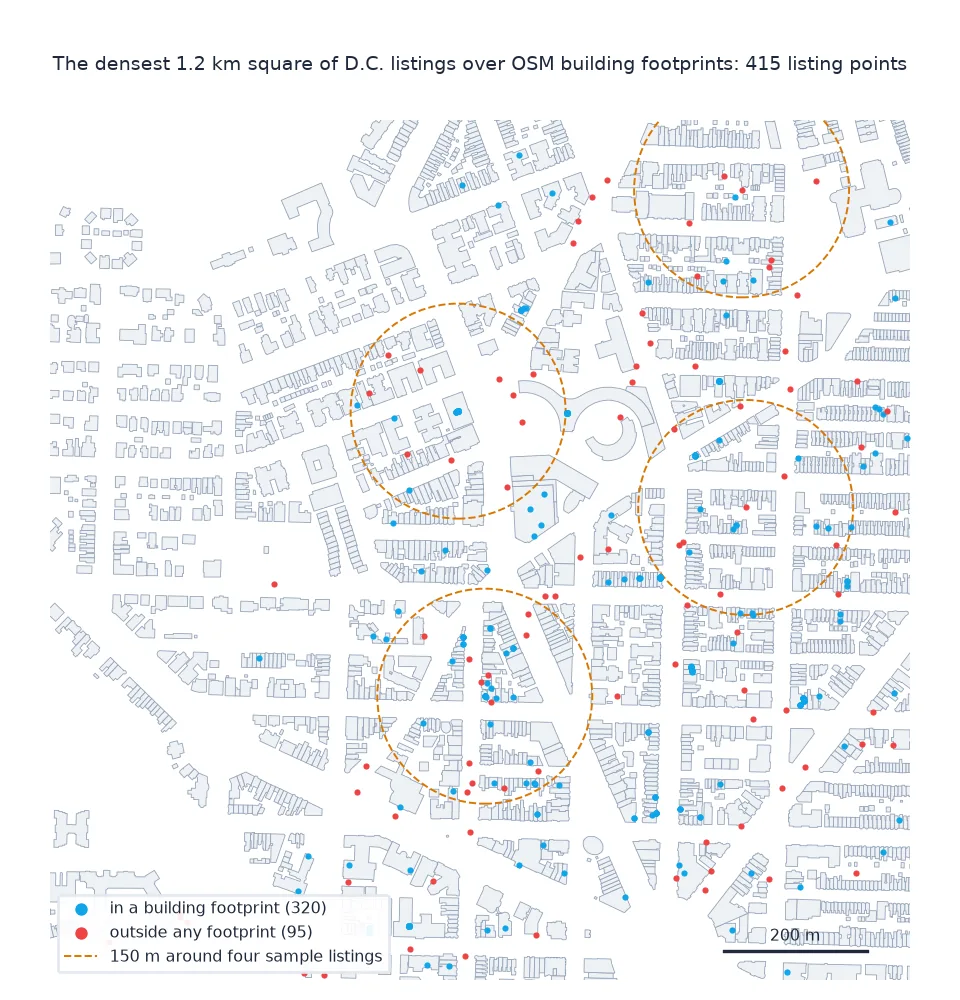
Expected building shares, one operator's points, the effect
1. What share of buildings would we expect?
Compare with random points inside the same area, to see whether listing points avoid buildings or fall in them:
rng = np.random.default_rng(0)
x0, y0, x1, y1 = G.total_bounds
pts = gpd.GeoSeries(gpd.points_from_xy(rng.uniform(x0, x1, 20000), rng.uniform(y0, y1, 20000)), crs=32618)
pts = pts[pts.within(DC.union_all())]
rnd = gpd.sjoin(gpd.GeoDataFrame(geometry=pts), B[["geometry"]], predicate="within", how="left").groupby(level=0).index_right.count() > 0
print(f"random points in D.C. inside a building: {rnd.mean():.0%}; listing points: {inside.mean():.0%}")
random points in D.C. inside a building: 15%; listing points: 47%
Random points across the District land in a building 15% of the time, so listing points do fall in buildings three times as often as chance. They are close to real homes but not on them, consistent with a shift of tens of metres rather than a random placement.
2. One operator, one building, many points
Hosts with many listings often run several units in one building. Check whether their points coincide or spread out, and how far apart the listings of smaller multi-listing hosts sit:
big = G[G.calculated_host_listings_count >= 50]
dup = G.duplicated(["latitude", "longitude"], keep=False)
print(f"hosts with 50+ listings: {big.host_id.nunique()}, holding {len(big):,} listings")
print(f"listings sharing exact coordinates with another listing: hosts with 50+ {dup[big.index].mean():.0%}, everyone else {dup.drop(big.index).mean():.0%}")
multi = G.drop(big.index); multi = multi[multi.host_id.duplicated(keep=False)]
nn = multi.groupby("host_id").apply(lambda g: g.geometry.apply(lambda p: g.distance(p).nsmallest(2).iloc[-1]), include_groups=False)
print(f"smaller multi-listing hosts: median distance to the host's nearest other listing {nn.median():.0f} m, over {nn.notna().sum():,} listings")
hosts with 50+ listings: 8, holding 952 listings
listings sharing exact coordinates with another listing: hosts with 50+ 63%, everyone else 12%
smaller multi-listing hosts: median distance to the host's nearest other listing 62 m, over 3,637 listings
The eight hosts with 50 or more listings behave differently from everyone else: 63% of their listings share exact coordinates with another listing, against 12% for the rest. For smaller hosts with more than one listing, the nearest other listing of the same host is a median 62 m away. That fits units in one building scattered by separate shifts, although it could also reflect hosts with units on neighbouring streets.
3. What it does to small-area counts
Assign listings to a fine grid and compare with a grid twice as coarse:
for size in (250, 500, 1000):
    cell = (G.geometry.x // size).astype(int).astype(str) + "_" + (G.geometry.y // size).astype(int).astype(str)
    shifted = ((G.geometry.x + 100) // size).astype(int).astype(str) + "_" + ((G.geometry.y + 100) // size).astype(int).astype(str)
    print(f"{size:>5} m cells: listings changing cell if moved 100 m north-east: {(cell != shifted).mean():.0%}")
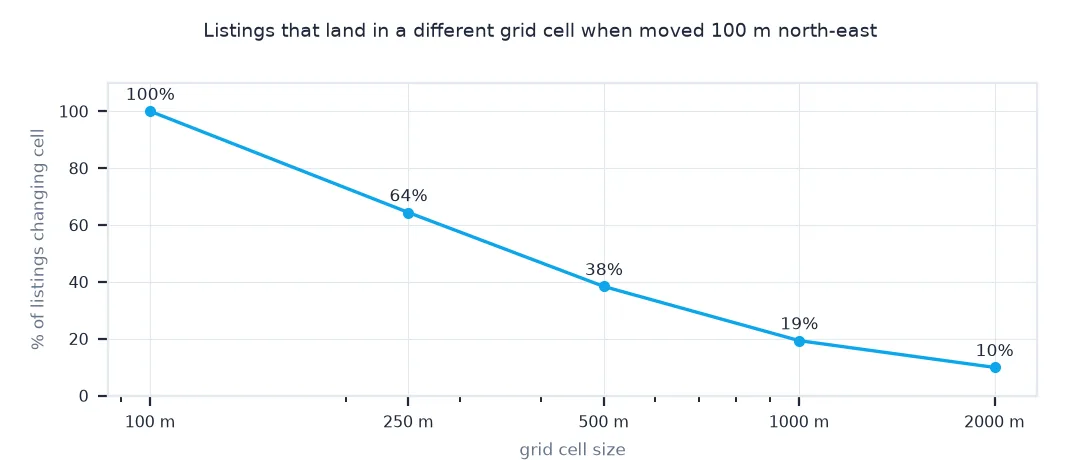
250 m cells: listings changing cell if moved 100 m north-east: 64%
500 m cells: listings changing cell if moved 100 m north-east: 38%
1000 m cells: listings changing cell if moved 100 m north-east: 19%
A 100 m shift moves 64% of listings into a different 250 m grid cell, 38% at 500 m and 19% at 1 km. Counts for areas a few hundred metres across depend heavily on where the points happened to land.
Buildings within the uncertainty circle
The data used on this page
The Inside Airbnb listings for Washington, D.C. from the snapshot of 24 June 2026 (CC BY 4.0); building footprints (building=* areas) from the Geofabrik OpenStreetMap extract of 1 January 2026 (© OpenStreetMap contributors, ODbL); and the District boundary from the US Census Bureau's 2023 cartographic boundaries at 1:500,000.
from pathlib import Path

import geopandas as gpd
import numpy as np
import osmium
import pandas as pd
import requests

Path("data").mkdir(exist_ok=True)
def cached(path, url):
    p = Path(path)
    if not p.exists():
        r = requests.get(url, timeout=600); r.raise_for_status(); p.write_bytes(r.content)
    return p
L = pd.read_csv(cached("data/listings.csv.gz", "https://data.insideairbnb.com/united-states/dc/washington-dc/2026-06-24/data/listings.csv.gz"))
PBF = cached("data/district-of-columbia-260101.osm.pbf", "https://download.geofabrik.de/north-america/us/district-of-columbia-260101.osm.pbf")
fp = (osmium.FileProcessor(str(PBF)).with_areas().with_filter(osmium.filter.EntityFilter(osmium.osm.AREA))
      .with_filter(osmium.filter.KeyFilter("building")).with_filter(osmium.filter.GeoInterfaceFilter(tags=["building"])))
B = gpd.GeoDataFrame.from_features(fp, crs=4326).to_crs(32618)
C = gpd.read_file(cached("data/cb_2023_us_county_500k.zip", "https://www2.census.gov/geo/tiger/GENZ2023/shp/cb_2023_us_county_500k.zip"))
DC = C[C.GEOID == "11001"].to_crs(32618)
print(f"{len(L):,} listings; {len(B):,} building footprints")
6,945 listings; 161,846 building footprints
The OpenStreetMap extract has 161,846 building footprints for the District.
Example 1: buildings within the uncertainty circle
How many buildings could each listing actually be in?
sample = G.sample(500, random_state=0)
n_b = gpd.sjoin(gpd.GeoDataFrame(geometry=sample.zone, crs=32618), B[["geometry"]], predicate="intersects").groupby(level=0).size().reindex(sample.index, fill_value=0)
print(f"buildings within 150 m of a listing point: median {n_b.median():.0f}, middle half {n_b.quantile(0.25):.0f} to {n_b.quantile(0.75):.0f}")
buildings within 150 m of a listing point: median 157, middle half 89 to 218
A 150 m circle around a listing point contains a median of 157 buildings, and the middle half of listings have 89 to 218. Coordinates alone cannot say which of them is the listing.
Locations anonymised before booking
Airbnb does not publish exact addresses before a booking. The map shows each listing at an approximate location, and Inside Airbnb, which scrapes those locations, documents that they are anonymised to within about 150 m of the real address. The shift appears to be applied per listing, so units in the same building usually appear at different points, although many listings of the largest operators share a single point, and points can land on roads, open space or water. For city-wide maps and neighbourhood statistics this hardly matters, because the error is small relative to the areas. For anything at the scale of a block or a building, such as matching listings to properties, counting listings per building or measuring distance to a nearby feature, it dominates.
Analyses should work at a scale above the blurring. Aggregate to areas several hundred metres across or more, buffer each point by the uncertainty before spatial joins, and treat distances under about 150 m as noise. Matching individual listings to buildings or registrations needs other information, such as licence numbers or descriptions, not coordinates. When reporting counts for small areas, say that locations are approximate.
Exact duplicates, density maps and enforcement
- Exact duplicates: identical coordinates for several listings often mean one operator, not one unit.
- Hexbin and kernel density: smooth over the uncertainty naturally; choose a bandwidth well above 150 m.
- Distance measures: distances to stations or landmarks are biased slightly upward on average by random shifts.
- Enforcement: cities matching listings to properties use platform data under agreements, not the public coordinates.
Internal links
- How to map Airbnb prices by neighbourhood in Python — working at neighbourhood scale
- How to measure Airbnb prices against distance to transit in Python — distances with blurred points
- Coordinate decimal places explained — precision and accuracy
FAQ
Are Airbnb listing locations accurate?
No; Airbnb shifts published locations by up to about 150 m for privacy, and Inside Airbnb's data uses those shifted points.
Why are Airbnb listings shown in the street or in parks?
The random shift can move a listing's point off its building onto roads, parks or water.
How do I analyse Airbnb data at a small scale?
Aggregate to areas larger than the uncertainty, buffer points by about 150 m before joins, and avoid building-level conclusions.
Can I find the exact building of an Airbnb listing?
Not from the public coordinates; other evidence such as licence numbers is needed.