
How to Map Airbnb Prices by Neighbourhood in Python
On this page
Problem statement
A map of Airbnb prices by neighbourhood is the classic first analysis of short-term rental data, and an easy one to get wrong. Mixing private rooms with whole apartments compares different products. Neighbourhoods with three listings get the same colour weight as those with three hundred. Averages are dragged up by a handful of mansions at thousands of dollars a night. And the neighbourhood label in the data may not match the polygon a listing actually falls in.
This page maps the median nightly price of entire homes in each neighbourhood of Washington, D.C. from the Inside Airbnb snapshot of 24 June 2026. It joins the listings to Inside Airbnb's neighbourhood boundaries, applies a minimum sample size, compares medians with means, and checks the neighbourhood labels against a spatial join.
Quick answer
Keep one room type, compute medians per neighbourhood, require a minimum count, and join to the polygons:
E = L[(L.room_type == "Entire home/apt") & L.price_usd.notna()]
stats = E.groupby("neighbourhood_cleansed").agg(listings=("id", "size"), median_price=("price_usd", "median"), mean_price=("price_usd", "mean"))
N = NB.merge(stats, left_on="neighbourhood", right_index=True, how="left")
N.loc[N.listings < 10, ["median_price", "mean_price"]] = np.nan                      # too few to say
print(f"neighbourhoods {len(N)}; with at least 10 priced entire homes: {N.median_price.notna().sum()}")
print(N.nlargest(3, "median_price")[["neighbourhood", "listings", "median_price"]].to_string(index=False))
neighbourhoods 39; with at least 10 priced entire homes: 38
neighbourhood listings median_price
Downtown, Chinatown, Penn Quarters, Mount Vernon Square, North Capitol Street 152 539.20
West End, Foggy Bottom, GWU 55 393.71
Georgetown, Burleith/Hillandale 140 324.79
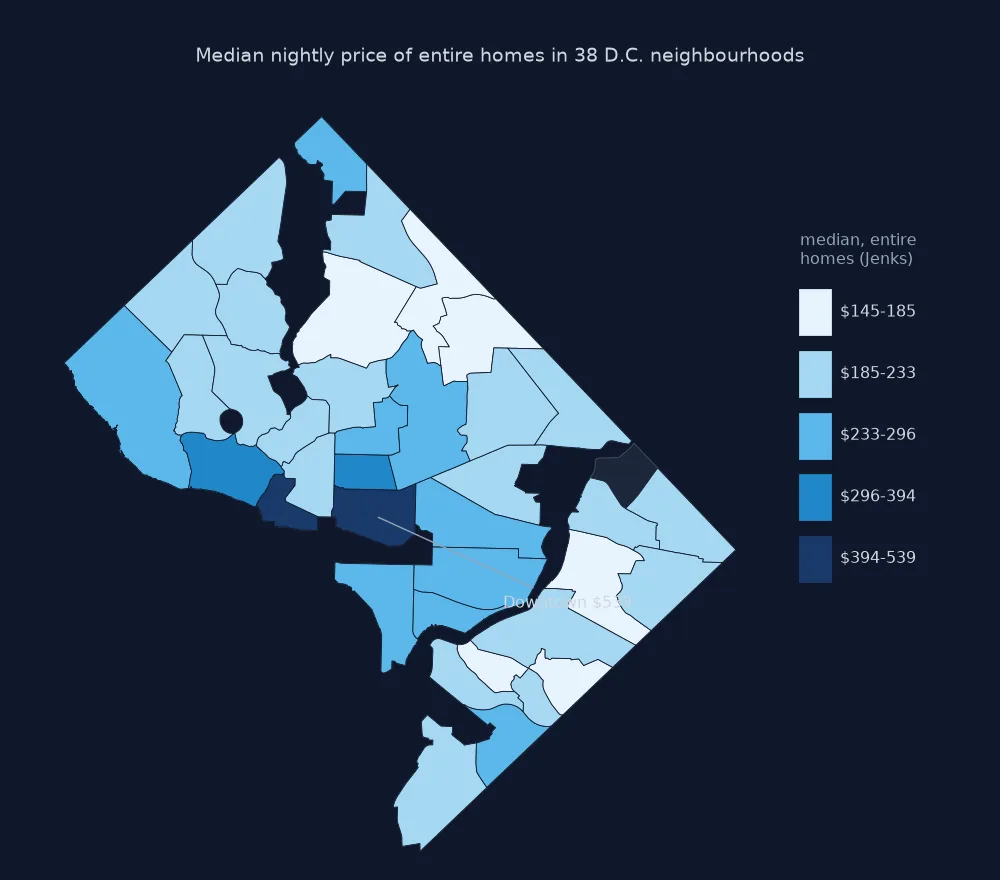
38 of the 39 neighbourhoods have at least 10 priced entire homes. Downtown, with Chinatown, Penn Quarter and Mount Vernon Square, is the most expensive at a median of $539 a night, followed by the West End and Foggy Bottom ($394) and Georgetown ($325).
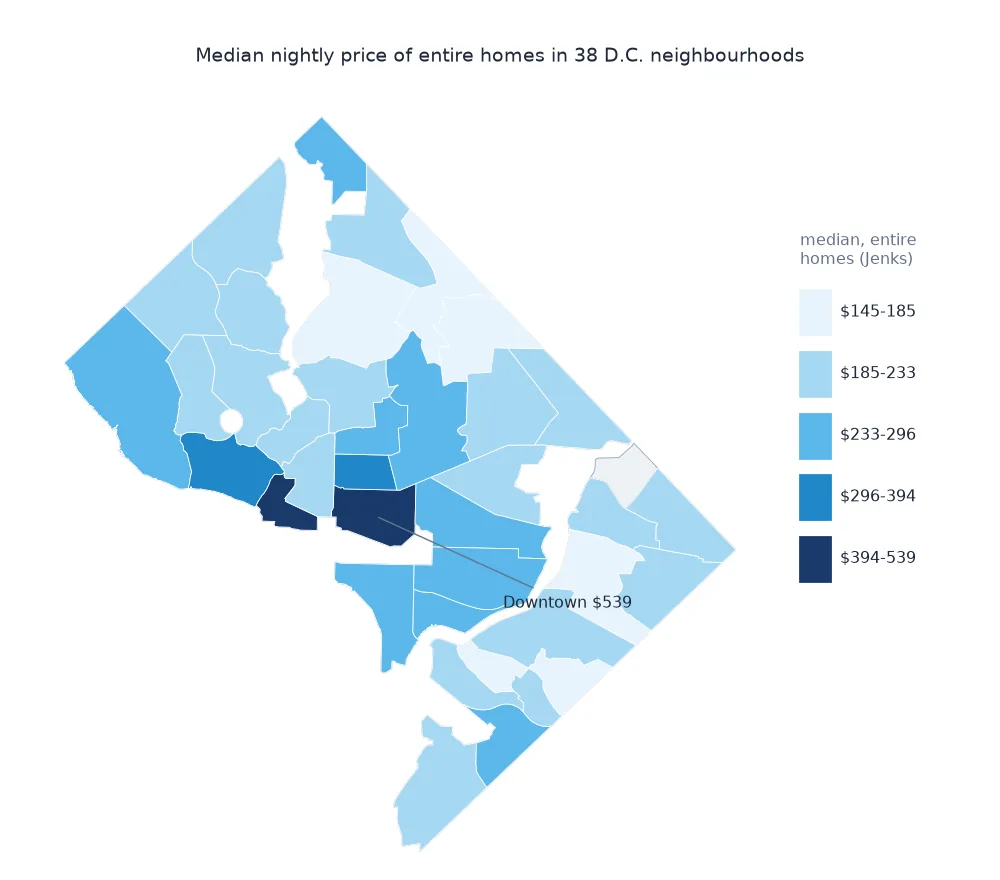
Median not mean, sample size, labels against a spatial join
1. Median, not mean
d = N.dropna(subset=["median_price"])
print(f"mean exceeds median in {(d.mean_price > d.median_price).mean():.0%} of neighbourhoods; largest gap ${(d.mean_price - d.median_price).max():.0f} in {d.loc[(d.mean_price - d.median_price).idxmax(), 'neighbourhood'][:40]}")
mean exceeds median in 100% of neighbourhoods; largest gap $361 in Brightwood Park, Crestwood, Petworth
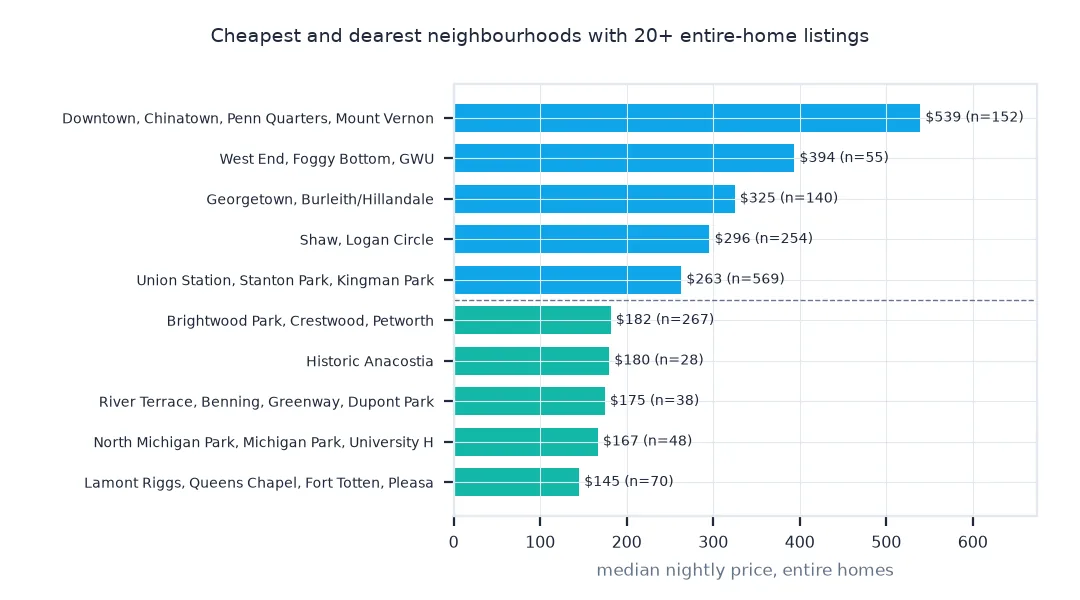
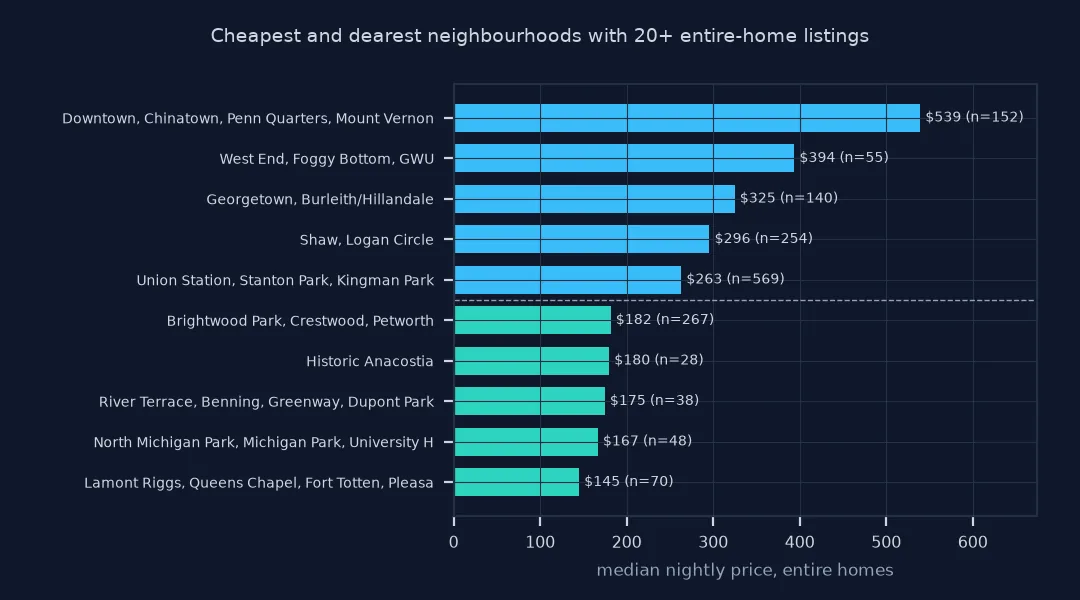
The mean exceeds the median in every neighbourhood, by as much as $361 in Brightwood Park, Crestwood and Petworth, where a few very expensive listings pull the average up.
2. How much the sample size matters
print(f"entire homes per neighbourhood: median {stats.listings.median():.0f}, range {stats.listings.min()} to {stats.listings.max()}")
print(f"neighbourhoods dropped for having fewer than 10: {(N.listings.fillna(0) < 10).sum()}")
entire homes per neighbourhood: median 56, range 5 to 569
neighbourhoods dropped for having fewer than 10: 1
Neighbourhoods have a median of 56 priced entire homes, ranging from 5 to 569. Only one falls below the threshold of 10.
3. Labels against a spatial join
G = gpd.GeoDataFrame(E, geometry=gpd.points_from_xy(E.longitude, E.latitude), crs=4326)
j = gpd.sjoin(G, NB[["neighbourhood", "geometry"]].rename(columns={"neighbourhood": "polygon"}), predicate="within", how="left")
agree = (j.polygon == j.neighbourhood_cleansed)
print(f"listings whose label matches the polygon they fall in: {agree.mean():.1%}; outside every polygon: {j.polygon.isna().sum()}")
listings whose label matches the polygon they fall in: 100.0%; outside every polygon: 0
Every listing's label matches the polygon it falls in, and none falls outside them all, consistent with Inside Airbnb assigning the labels by the same spatial join. The labels inherit the blurred coordinates, though, so they are only as precise as the locations.
Price per guest
The data used on this page
The Inside Airbnb snapshot for Washington, D.C. dated 24 June 2026: listings.csv.gz and neighbourhoods.geojson, the neighbourhood clusters Inside Airbnb uses for D.C. (CC BY 4.0).
from pathlib import Path

import geopandas as gpd
import numpy as np
import pandas as pd
import requests

Path("data").mkdir(exist_ok=True)
BASE = "https://data.insideairbnb.com/united-states/dc/washington-dc/2026-06-24"
def cached(path, url):
    p = Path(path)
    if not p.exists():
        r = requests.get(url, timeout=600); r.raise_for_status(); p.write_bytes(r.content)
    return p
L = pd.read_csv(cached("data/listings.csv.gz", f"{BASE}/data/listings.csv.gz"))
L["price_usd"] = pd.to_numeric(L.price.str.replace(r"[$,]", "", regex=True), errors="coerce")
NB = gpd.read_file(cached("data/neighbourhoods.geojson", f"{BASE}/visualisations/neighbourhoods.geojson"))
print(f"{len(L):,} listings; {len(NB)} neighbourhood polygons")
6,945 listings; 39 neighbourhood polygons
The snapshot has 6,945 listings and 39 neighbourhood polygons, the District's neighbourhood clusters.
Example 1: price per guest
Larger homes cost more. Divide by accommodates to compare neighbourhoods on price per guest:
E2 = E.assign(per_guest=E.price_usd / E.accommodates.clip(lower=1))
pg = E2.groupby("neighbourhood_cleansed").agg(n=("id", "size"), per_guest=("per_guest", "median"))
pg = pg[pg.n >= 10].sort_values("per_guest")
print(f"median price per guest: lowest ${pg.per_guest.iloc[0]:.0f} ({pg.index[0][:35]}), highest ${pg.per_guest.iloc[-1]:.0f} ({pg.index[-1][:35]})")
median price per guest: lowest $39 (River Terrace, Benning, Greenway, D), highest $148 (Downtown, Chinatown, Penn Quarters,)
Per guest, the gap narrows but remains: from $39 a night in River Terrace, Benning and Greenway to $148 downtown.
Every summary choice changes the picture
A neighbourhood price map summarises many listings into one value per area. Each choice in that summary changes the picture. Room types are different markets: a private room in a shared house and a whole three-bedroom apartment rarely compete. Nightly prices are skewed, with a long tail of luxury homes, so the median describes a typical listing far better than the mean. Areas with few listings give unstable medians, where one or two listings decide the colour, so a minimum count and a visible "too few" class keep the map honest.
The geography needs care too. Inside Airbnb assigns each listing to a neighbourhood using its coordinates, which Airbnb has blurred by up to about 150 m, so listings near a boundary can carry the label of the area next door. For a city like Washington, whose neighbourhood clusters are large, the effect is small, but it grows with smaller areas. Finally, prices are the quoted prices on the scrape date, so a map of June quotes is a June map.
Classes, weighting and long minimum stays
- Classes: quantile classes make every colour hold the same number of neighbourhoods; state the breaks in the legend.
- Weighting: a city-wide median is the median of listings, not of neighbourhood medians.
- Long minimum stays: filter
minimum_nights < 30to map short-term lets only. - Other cities: some cities have
neighbourhood_group_cleansedfor a coarser level.
Internal links
- How to analyse Inside Airbnb listings in Python — loading and cleaning
- Fixing Airbnb listing coordinates that are not exact — why labels near boundaries disagree
- Choropleth classification explained — choosing classes
FAQ
How do I make a map of Airbnb prices by neighbourhood?
Filter to one room type, compute the median price per neighbourhood with a minimum listing count, merge with the neighbourhood polygons, and plot a choropleth.
Should I use the mean or median Airbnb price?
The median; prices are skewed by a few very expensive listings.
Why do some neighbourhoods have no colour?
They have too few listings for a stable median; showing them as "too few" is better than a misleading value.
Where do the neighbourhood boundaries come from?
Inside Airbnb publishes neighbourhoods.geojson with each city's snapshot, using the city's official neighbourhood areas.