
House Price Index Methods Explained: Median, Mix-Adjusted, Repeat-Sales and Hedonic
On this page
Problem statement
"House prices rose 5% last year" can mean very different things depending on how the index was built. A median of all sales, a median adjusted for the mix of property types, a repeat-sales index that compares each home with itself, and a hedonic index that values each home's characteristics can all be computed from the same transactions and give different answers, because each defines "the price change" differently. Official indices such as the UK House Price Index and the US Case-Shiller indices choose deliberately, and anyone building their own should know what each choice measures.
This page computes three indices for England and Wales from the 2019 to 2024 HM Land Registry Price Paid files: a simple median, a type-mix-adjusted median and a repeat-sales index. It explains why they diverge, and where the hedonic approach fits.
Quick answer
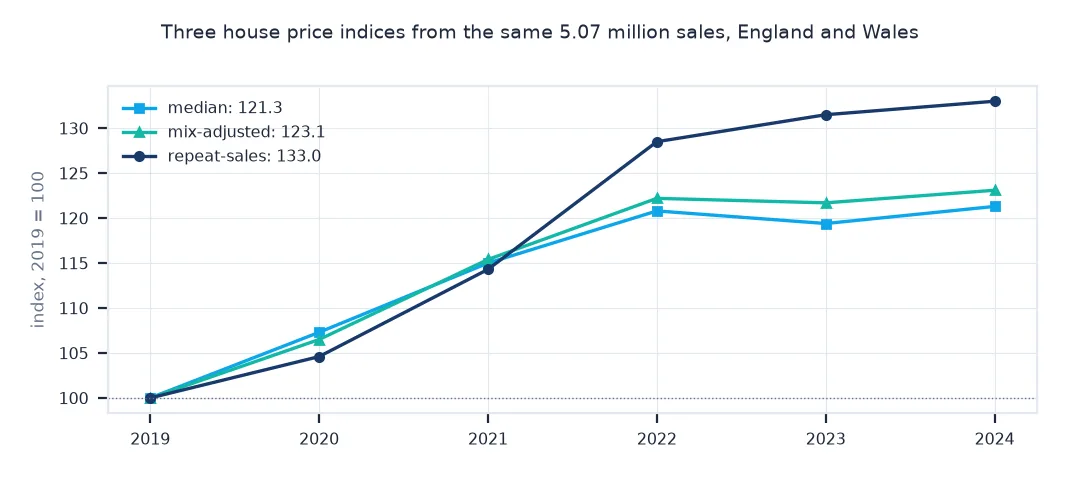
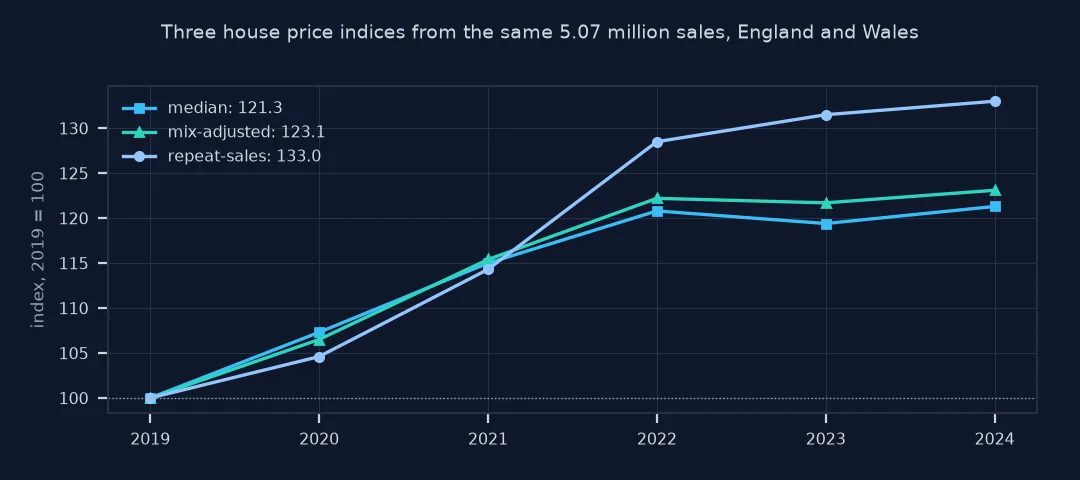
Three indices from the same sales, 2019 = 100:
cmp = pd.DataFrame({"median": med_idx, "mix-adjusted": mix_idx, "repeat-sales": rs_idx}).round(1)
print(cmp.to_string())
print(f"2019-2024: median {med_idx[2024] - 100:+.1f}%, mix-adjusted {mix_idx[2024] - 100:+.1f}%, repeat-sales {rs_idx[2024] - 100:+.1f}%")
median mix-adjusted repeat-sales
2019 100.0 100.0 100.0
2020 107.3 106.5 104.6
2021 115.0 115.4 114.3
2022 120.8 122.2 128.5
2023 119.4 121.7 131.5
2024 121.3 123.1 133.0
2019-2024: median +21.3%, mix-adjusted +23.1%, repeat-sales +33.0%
The same sales give three answers for 2019 to 2024: +21.3% by the median, +23.1% mix-adjusted and +33.0% by repeat sales. The first two track each other closely; the repeat-sales index pulls away from 2022.
What moves the median, who repeat sales represent, annual change
1. What moves the median
The median changes when prices change and when the mix of what sold changes. Measure the mix:
mix = A.groupby(A.date.dt.year).property_type.value_counts(normalize=True).unstack()[["D", "S", "T", "F"]]
print((mix * 100).round(1).to_string())
property_type D S T F
date
2019 26.2 29.3 27.3 17.2
2020 28.3 29.2 26.4 16.1
2021 27.9 28.6 26.9 16.6
2022 25.3 28.3 26.9 19.4
2023 25.2 29.1 27.0 18.8
2024 26.1 29.7 26.7 17.5
The type mix shifts by a few points from year to year. Detached homes rose to 28.3% of sales in 2020, and flats rose to 19.4% in 2022. A year with more detached sales pushes the median up and a year with more flats pulls it down, whatever happens to prices.
2. Who the repeat-sales index represents
Only homes that sold twice count. Compare their type mix with all sales:
rs_types = pairs.type.value_counts(normalize=True).reindex(["D", "S", "T", "F"])
all_types = A.property_type.value_counts(normalize=True).reindex(["D", "S", "T", "F"])
print(pd.DataFrame({"all sales": all_types, "repeat-sale pairs": rs_types}).mul(100).round(1).to_string())
print(f"pairs: {len(pairs):,}, from {pairs.key.nunique():,} properties, out of {len(A):,} sales")
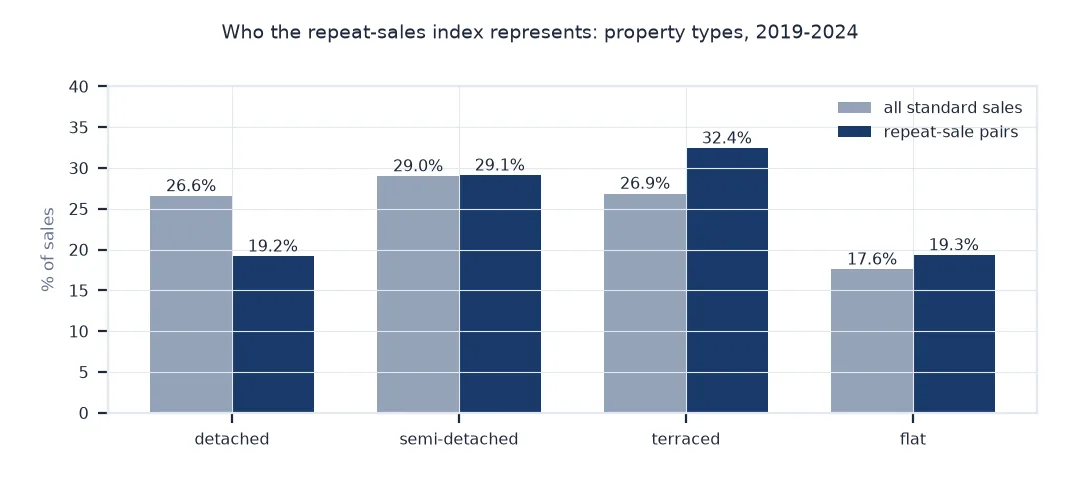
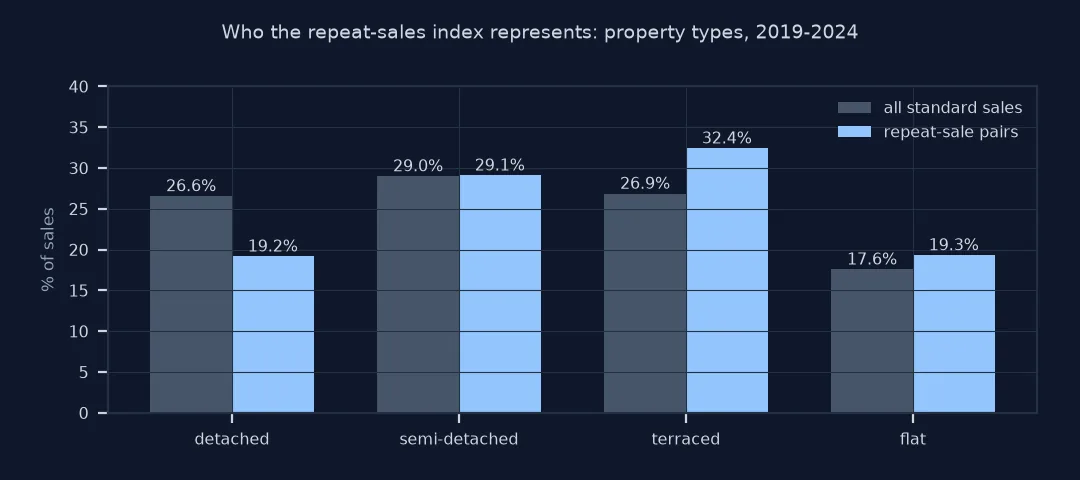
all sales repeat-sale pairs
D 26.6 19.2
S 29.0 29.1
T 26.9 32.4
F 17.6 19.3
pairs: 308,237, from 298,871 properties, out of 5,065,502 sales
Repeat sales over-represent terraced houses (32.4% of pairs against 26.9% of sales) and under-represent detached ones (19.2% against 26.6%). The repeat-sales index therefore describes homes that change hands often within six years, which is not the same population as all sales.
3. Year-on-year
yoy = cmp.pct_change().mul(100).round(1).dropna()
print(yoy.to_string())
median mix-adjusted repeat-sales
2020 7.3 6.5 4.6
2021 7.2 8.4 9.3
2022 5.0 5.9 12.4
2023 -1.2 -0.4 2.3
2024 1.6 1.2 1.1
The methods disagree most in 2022, when the repeat-sales index rose 12.4% and the median 5.0%. In 2023 the median fell 1.2% while the repeat-sales index rose 2.3%. By 2024 all three show growth between 1.1% and 1.6%.
How much the method matters for one year
The data used on this page
The yearly Price Paid Data files for 2019 to 2024 from HM Land Registry (© Crown copyright 2026, Open Government Licence v3.0), standard sales only.
from pathlib import Path

import numpy as np
import pandas as pd
import requests

Path("data").mkdir(exist_ok=True)
COLS = ["transaction_id", "price", "date", "postcode", "property_type", "old_new", "duration", "paon", "saon",
        "street", "locality", "town", "district", "county", "ppd_category", "record_status"]
frames = []
for y in range(2019, 2025):
    f = Path(f"data/pp-{y}.csv")
    if not f.exists():
        r = requests.get(f"http://prod1.publicdata.landregistry.gov.uk.s3-website-eu-west-1.amazonaws.com/pp-{y}.csv", timeout=1800); r.raise_for_status(); f.write_bytes(r.content)
    frames.append(pd.read_csv(f, header=None, names=COLS, usecols=["price", "date", "postcode", "property_type", "old_new", "duration", "paon", "saon", "street", "ppd_category"], parse_dates=["date"]))
A = pd.concat(frames).query("ppd_category == 'A'")
A = A[A.date.between("2019-01-01", "2024-12-31")]
years = list(range(2019, 2025))

med = A.groupby(A.date.dt.year).price.median(); med_idx = 100 * med / med.iloc[0]
w = A.property_type.value_counts(normalize=True).reindex(["D", "S", "T", "F"])
bt = A.groupby([A.date.dt.year, "property_type"]).price.median().unstack()[["D", "S", "T", "F"]]
mixed = (bt * (w / w.sum()).values).sum(axis=1); mix_idx = 100 * mixed / mixed.iloc[0]

d = A.assign(key=A.postcode.fillna("") + "|" + A.paon.fillna("") + "|" + A.saon.fillna("") + "|" + A.street.fillna(""))
d = d[d.key.duplicated(keep=False)].sort_values(["key", "date"])
nxt = d.groupby("key").shift(-1)
pairs = pd.DataFrame({"key": d.key, "type": d.property_type, "p1": d.price, "p2": nxt.price, "d1": d.date, "d2": nxt.date, "new1": d.old_new,
                      "same": (d.property_type == nxt.property_type) & (d.duration == nxt.duration)}).dropna(subset=["p2"])
pairs = pairs[pairs.same & (pairs.new1 != "Y") & ((pairs.d2 - pairs.d1).dt.days >= 182)]
ann = (pairs.p2 / pairs.p1) ** (365.25 / (pairs.d2 - pairs.d1).dt.days) - 1
pairs = pairs[ann.abs() <= 0.5]
X = np.column_stack([(pairs.d2.dt.year == y).astype(int) - (pairs.d1.dt.year == y).astype(int) for y in years[1:]])
beta = np.linalg.lstsq(X, np.log(pairs.p2 / pairs.p1).values, rcond=None)[0]
rs_idx = pd.Series(100 * np.exp(np.r_[0, beta]), index=years)
print(f"{len(A):,} standard sales; {len(pairs):,} repeat-sale pairs")
5,065,502 standard sales; 308,237 repeat-sale pairs
Six years give 5,065,502 standard sales, and 308,237 repeat-sale pairs after filtering out new builds, changes of type or tenure, short holds and extreme annual changes.
Example 1: how much the method matters for one year
The spread between methods in each year, in percentage points of annual change:
spread = yoy.max(axis=1) - yoy.min(axis=1)
print({y: f"{v:.1f} pp" for y, v in spread.items()})
{2020: '2.7 pp', 2021: '2.1 pp', 2022: '7.4 pp', 2023: '3.5 pp', 2024: '0.5 pp'}
The spread between methods reaches 7.4 percentage points in 2022 and is half a point in 2024. A headline annual change can depend on the method by more than the change itself.
Each index answers a different question
Each index answers a slightly different question. A median of all sales tracks the price of what sold, and moves with both the market and the mix of property types and locations. A mix-adjusted median holds the composition fixed by weighting each type's median by a constant share, removing the largest composition effect but not those within types. A repeat-sales index compares each property only with itself, removing composition entirely for the homes it covers, but those are only the homes that sold twice, which over a short window favours properties that change hands often. Improvements between sales count as price growth. A hedonic index regresses price on characteristics such as type, size, location and age, and tracks the price of a constant bundle. It is the method of the official UK House Price Index, which needs property attributes beyond those in Price Paid Data.
The divergence between them is itself information. When the median lags a repeat-sales index, the gap points to a change in what is selling, or in which homes the repeat-sales pairs represent, rather than in the price of a given home. When they move together, neither effect is large. For reporting, the method should match the question. "What did buyers pay?" is answered by the median. "How has the value of a given home changed?" is answered by repeat-sales or hedonic indices. In every case, state the method and the source.
The UK HPI, Case-Shiller and revisions
- Official UK index: the UK HPI from ONS and HM Land Registry uses a hedonic model with property characteristics, published monthly by region.
- Case-Shiller: a weighted repeat-sales index for US metropolitan areas.
- Revisions: repeat-sales and hedonic indices are revised as new sales arrive; medians change as late registrations do.
- Short windows: with only six years, repeat-sales pairs are mostly short holdings; longer histories give more representative pairs.
Internal links
- How to build a repeat-sales house price index in Python — the repeat-sales method in detail
- How to build a house price time series from Land Registry data in Python — medians and mix adjustment
- How to build a hedonic price model for Airbnb listings in Python — the hedonic regression
FAQ
What is the difference between a median and a repeat-sales house price index?
A median tracks the price of whatever sold, so it moves with the mix; a repeat-sales index compares each home with itself.
Which house price index is most accurate?
Each measures something different; hedonic and repeat-sales indices control for composition, the median does not.
What method does the UK House Price Index use?
A hedonic regression on property characteristics, combining Land Registry sales with attribute data.
What is a mix-adjusted house price index?
An index that weights each property type's median by a fixed share, so changes in the mix of types sold do not move it.