
How to Estimate Airbnb Occupancy From Inside Airbnb Calendars in Python
On this page
Problem statement
How busy are short-term rentals? Inside Airbnb's calendar file records, for every listing and each of the next 365 days, whether the date is available to book. It is tempting to read every unavailable night as a booking, but hosts also block dates they do not want to rent, and long-stay listings block whole months. The calendar gives an upper bound on bookings, not occupancy, and Inside Airbnb's own occupancy estimate takes a different route through reviews.
This page reads the calendar for Washington, D.C. from the snapshot of 24 June 2026. It computes the share of future nights unavailable per listing, separates fully blocked listings, compares weekends with weekdays, and sets the calendar measure beside Inside Airbnb's review-based occupancy estimate.
Quick answer
Count unavailable nights per listing over the coming year:
C = pd.read_csv(cached("data/calendar.csv.gz", f"{BASE}/data/calendar.csv.gz"), usecols=["listing_id", "date", "available"], parse_dates=["date"])
per = C.assign(blocked=C.available.eq("f")).groupby("listing_id").agg(nights=("date", "size"), blocked=("blocked", "mean"))
print(f"{C.listing_id.nunique():,} listings, {len(C):,} listing-nights from {C.date.min():%d %b %Y} to {C.date.max():%d %b %Y}")
print(f"share of future nights unavailable: median {per.blocked.median():.0%}; listings fully unavailable: {(per.blocked == 1).mean():.0%}; fully open: {(per.blocked == 0).mean():.0%}")
6,996 listings, 2,553,540 listing-nights from 24 Jun 2026 to 02 Jul 2027
share of future nights unavailable: median 28%; listings fully unavailable: 5%; fully open: 2%
The calendar covers 6,996 listings, slightly more than the listings file, over 2,553,540 listing-nights from 24 June 2026 to 2 July 2027. The median listing has 28% of its future nights unavailable. 5% are unavailable every night and 2% are open every night.
Blocked is not booked, room types, weekends
1. Blocked is not booked
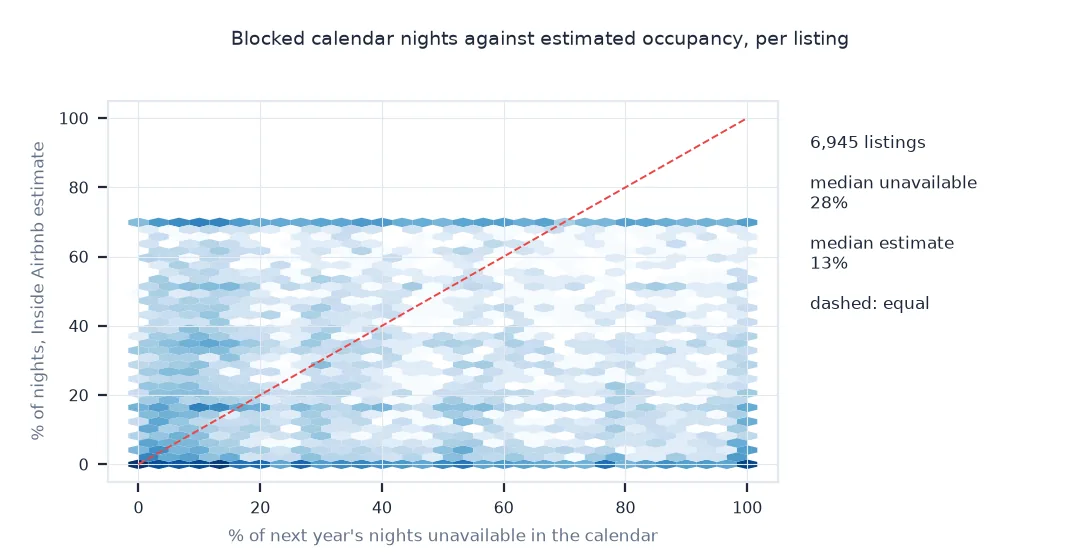
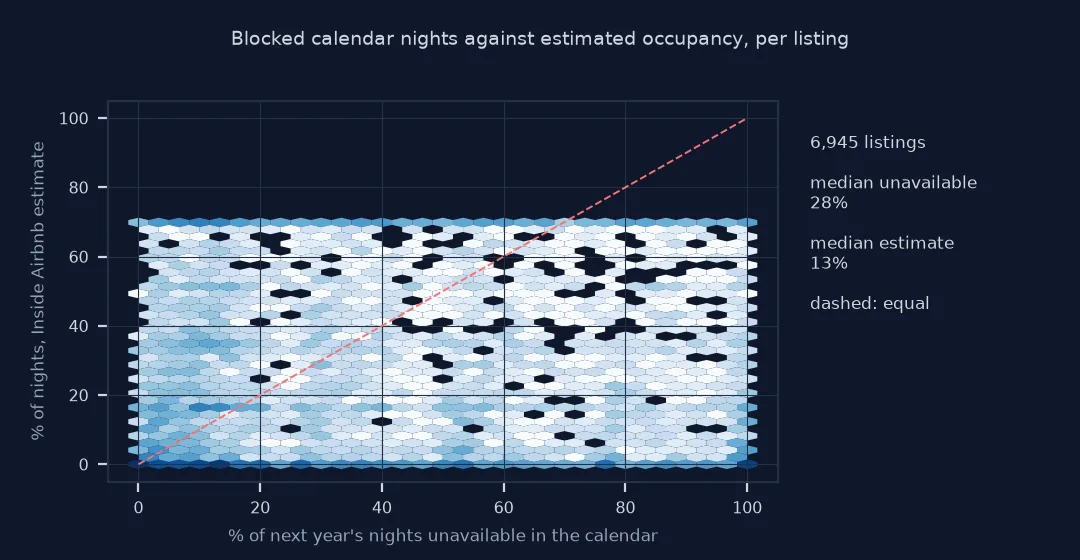
Join the calendar measure to the listings, and compare with the review-based estimate for the past year:
J = L.set_index("id")[["room_type", "minimum_nights", "number_of_reviews_ltm", "estimated_occupancy_l365d"]].join(per, how="inner")
J["est_share"] = J.estimated_occupancy_l365d / 365
print(f"listings joined: {len(J):,}")
print(f"median unavailable share (future, calendar): {J.blocked.median():.0%}; median estimated occupancy (past year, reviews): {J.est_share.median():.0%}")
print(f"listings fully unavailable with no reviews in the past year: {((J.blocked == 1) & (J.number_of_reviews_ltm == 0)).sum():,}")
listings joined: 6,945
median unavailable share (future, calendar): 28%; median estimated occupancy (past year, reviews): 13%
listings fully unavailable with no reviews in the past year: 196
Joined to the listings, the calendar's median of 28% future nights unavailable compares with Inside Airbnb's median estimate of 13% of nights booked in the past year. 196 listings are fully blocked yet had no reviews in the past year, which points to inactive listings rather than full bookings.
2. Room types and long stays
J["stay"] = np.where(J.minimum_nights >= 30, "30+ nights", "under 30")
print(J.groupby(["room_type", "stay"]).blocked.median().unstack().round(2).to_string())
stay 30+ nights under 30
room_type
Entire home/apt 0.21 0.32
Hotel room NaN 0.26
Private room 0.13 0.32
Shared room 0.36 0.04
Entire homes and private rooms open to short stays have about a third of future nights unavailable, more than the long-stay listings.
3. Weekends and weekdays
C["weekend"] = C.date.dt.dayofweek.isin([4, 5])                      # Friday and Saturday nights
active = C[C.listing_id.isin(per.index[(per.blocked > 0) & (per.blocked < 1)])]
w = active.assign(blocked=active.available.eq("f")).groupby("weekend").blocked.mean()
print(f"listings neither fully open nor fully blocked: {active.listing_id.nunique():,}; unavailable share on weekdays {w[False]:.1%}, Friday and Saturday nights {w[True]:.1%}")
listings neither fully open nor fully blocked: 6,473; unavailable share on weekdays 34.3%, Friday and Saturday nights 35.9%
Among the 6,473 listings that are neither fully open nor fully blocked, Friday and Saturday nights are only slightly more often unavailable than weekdays, 35.9% against 34.3%.
How the year fills up
The data used on this page
The Inside Airbnb snapshot for Washington, D.C. dated 24 June 2026: calendar.csv.gz, one row per listing and future date with availability, and listings.csv.gz (CC BY 4.0).
from pathlib import Path

import numpy as np
import pandas as pd
import requests

Path("data").mkdir(exist_ok=True)
BASE = "https://data.insideairbnb.com/united-states/dc/washington-dc/2026-06-24"
def cached(path, url):
    p = Path(path)
    if not p.exists():
        r = requests.get(url, timeout=600); r.raise_for_status(); p.write_bytes(r.content)
    return p
L = pd.read_csv(cached("data/listings.csv.gz", f"{BASE}/data/listings.csv.gz"))
print(f"{len(L):,} listings in the snapshot")
6,945 listings in the snapshot
The snapshot has 6,945 listings.
Example 1: how the year fills up
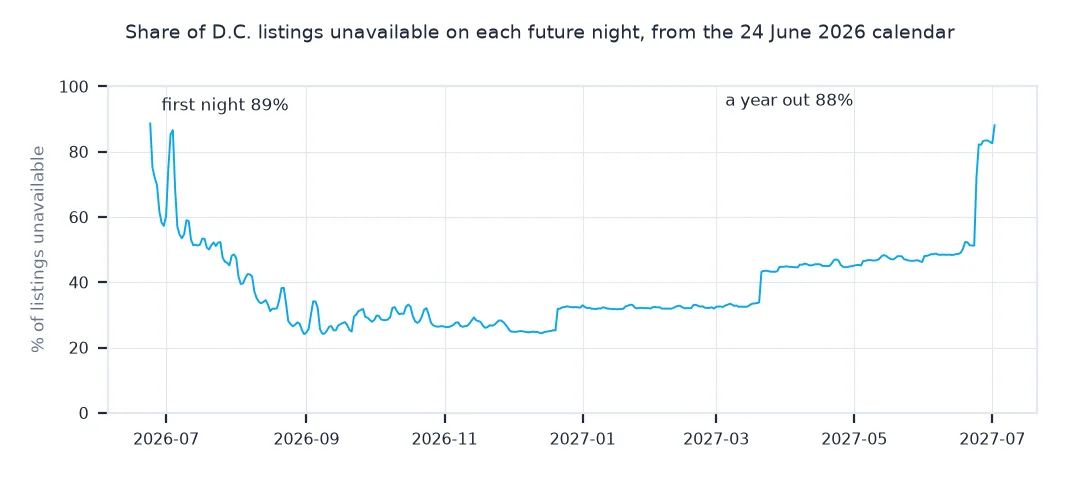
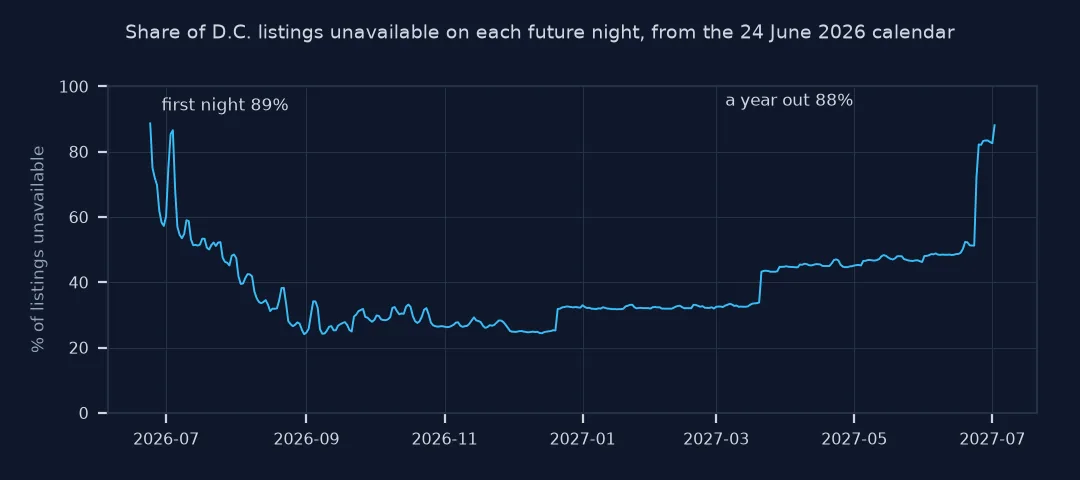
The share of listings unavailable on each future date, by month:
daily = C.assign(blocked=C.available.eq("f")).groupby("date").blocked.mean()
m = daily.resample("MS").mean()
print({d.strftime("%b %Y"): f"{v:.0%}" for d, v in m.items()})
{'Jun 2026': '69%', 'Jul 2026': '55%', 'Aug 2026': '34%', 'Sep 2026': '28%', 'Oct 2026': '29%', 'Nov 2026': '27%', 'Dec 2026': '27%', 'Jan 2027': '32%', 'Feb 2027': '32%', 'Mar 2027': '37%', 'Apr 2027': '45%', 'May 2027': '47%', 'Jun 2027': '57%', 'Jul 2027': '85%'}
The near future is mostly unavailable, 69% in late June and 55% in July, then the share falls to under 30% from September to December. It rises again towards spring 2027. The calendar fills from the front, so a snapshot's averages depend on when it was taken.
What the public calendar shows
Airbnb's public calendar shows, for each listing, which future dates can be booked. Inside Airbnb records it at the scrape date as one row per listing and night, available true or false. An unavailable night can be a reservation, a date the host has blocked, or a night the listing cannot be booked because of minimum-stay rules or advance-notice settings. So the calendar measures supply withdrawn from the market, not demand. It is also forward-looking: it shows the next 12 months as they stood on the scrape date, which fills up with time, since near dates are more likely to be booked than distant ones.
That is why serious occupancy estimates use other signals. Inside Airbnb's estimated_occupancy_l365d starts from the number of reviews in the past year, assumes a share of stays leave a review, and multiplies by the average stay length, with a cap. That is a model with its own assumptions, but it is anchored in realised stays. Reported side by side, the two measures bracket the truth: the calendar's unavailable share is an upper bound for future bookings, and the review-based figure is a rough estimate of past ones.
Blocked listings, snapshot timing and minimum nights
- Fully blocked listings: many are inactive or rented long-term off-platform; exclude them before averaging.
- Snapshot timing: a scrape in June sees summer partly booked and next spring mostly open.
- Prices: recent calendar files no longer include nightly prices.
- Minimum nights: the calendar file's
minimum_nightsper date can differ from the listing's default.
Internal links
- How to analyse Inside Airbnb listings in Python — the listings file
- Inside Airbnb data explained — what the estimates assume
- How to find hosts with multiple Airbnb listings in Python — who supplies the nights
FAQ
How do I calculate Airbnb occupancy from Inside Airbnb data?
The calendar gives the share of future nights unavailable, an upper bound on bookings; the listings file's estimated_occupancy_l365d gives a review-based estimate of past nights booked.
Does unavailable mean booked on Airbnb?
No; hosts also block dates, and minimum-stay rules make some dates unbookable.
Why are some listings unavailable all year?
They are often inactive, rented long-term, or require long minimum stays.
Does the Inside Airbnb calendar include prices?
Not in recent releases; use the price in the listings file.