
HM Land Registry Price Paid Data Explained
On this page
Problem statement
Price Paid Data is the record of residential property sales in England and Wales, and the source behind most house-price maps, rankings and research for those countries. It feels complete, every sale with its price and address, but it has a defined scope, a structure with codes and categories, and a publication process that changes the files after release. Misreading any of them leads to wrong statistics: averages inflated by company transactions, regions missing because they are not covered, recent months that look like a slump because they are not yet registered.
This page explains what Price Paid Data contains and how it is made, using the 2024 file. It covers which sales are included and which are not, the meaning of each code, the split between standard and additional transactions, and how registration lags shape the most recent data.
Quick answer
The file is one row per registered sale with sixteen fields; the categories and codes carry most of the meaning:
print(f"{len(P):,} sales registered for 2024")
print("category:", P.ppd_category.value_counts().to_dict())
print("property type:", P.property_type.value_counts().to_dict())
print("old/new:", P.old_new.value_counts().to_dict(), "| duration:", P.duration.value_counts().to_dict())
print("record status in the yearly file:", P.record_status.value_counts().to_dict())
931,453 sales registered for 2024
category: {'A': 763905, 'B': 167548}
property type: {'S': 252107, 'T': 250137, 'D': 211340, 'F': 163884, 'O': 53985}
old/new: {'N': 842308, 'Y': 89145} | duration: {'F': 716354, 'L': 215099}
record status in the yearly file: {'A': 931453}
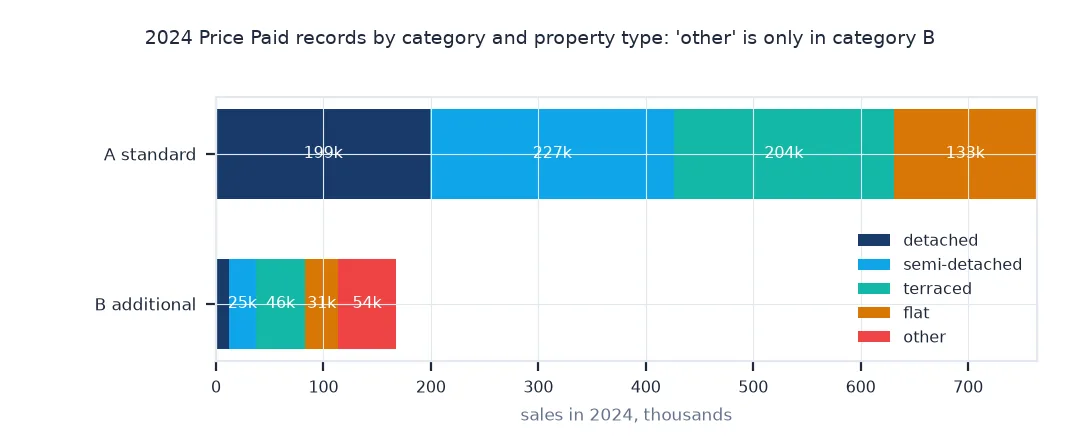
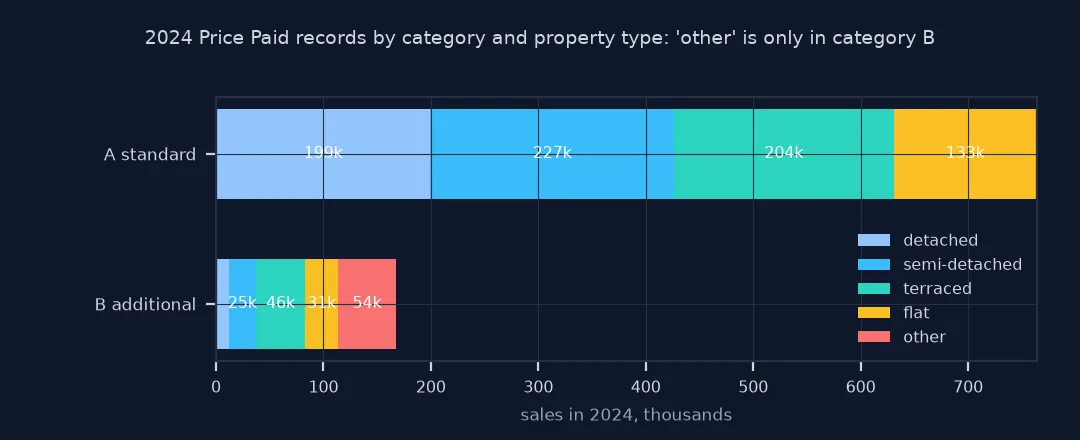
The 2024 file has 931,453 sales: 763,905 standard (A) and 167,548 additional (B). One in ten is a new build and 23% are leasehold. Every record in the yearly file has status A; changes and deletions appear in the separate monthly change files.
Coverage, standard and additional sales, registration lag
1. Coverage
counties = P.county.str.upper().unique()
welsh = {"GWYNEDD", "POWYS", "CARDIFF", "SWANSEA", "PEMBROKESHIRE", "CEREDIGION", "CONWY", "DENBIGHSHIRE", "ISLE OF ANGLESEY", "CARMARTHENSHIRE"}
print(f"counties in the file: {len(counties)}; Welsh counties among them: {len(welsh & set(counties))}; Scottish or Northern Irish: {sum(c in counties for c in ['CITY OF EDINBURGH', 'GLASGOW CITY', 'BELFAST'])}")
print(f"sales in these ten Welsh counties: {P.county.isin(welsh).sum():,}")
counties in the file: 113; Welsh counties among them: 10; Scottish or Northern Irish: 0
sales in these ten Welsh counties: 23,104
The file names 113 counties and unitary areas. All ten of the Welsh counties checked appear, and none of the Scottish or Northern Irish ones, because Scotland and Northern Ireland have their own registers.
2. Standard and additional transactions
for cat, g in P.groupby("ppd_category"):
    print(f"category {cat}: {len(g):,} sales; median £{g.price.median():,.0f}; types {g.property_type.value_counts(normalize=True).round(2).to_dict()}")
category A: 763,905 sales; median £291,000; types {'S': 0.3, 'T': 0.27, 'D': 0.26, 'F': 0.17}
category B: 167,548 sales; median £215,000; types {'O': 0.32, 'T': 0.27, 'F': 0.18, 'S': 0.15, 'D': 0.07}
Category B is a different market. Its median is £215,000 against £291,000, and 32% of its sales are type O, "other", which never appears in category A.
3. The registration lag
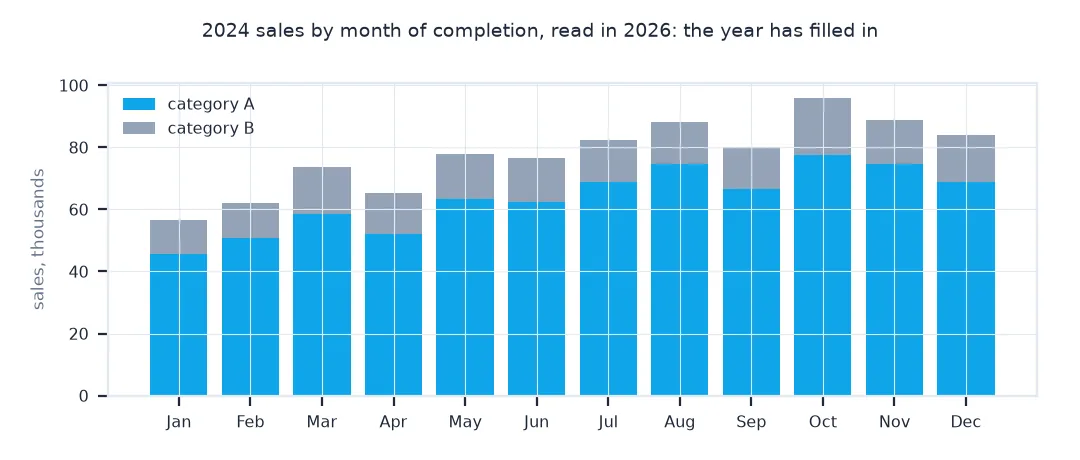
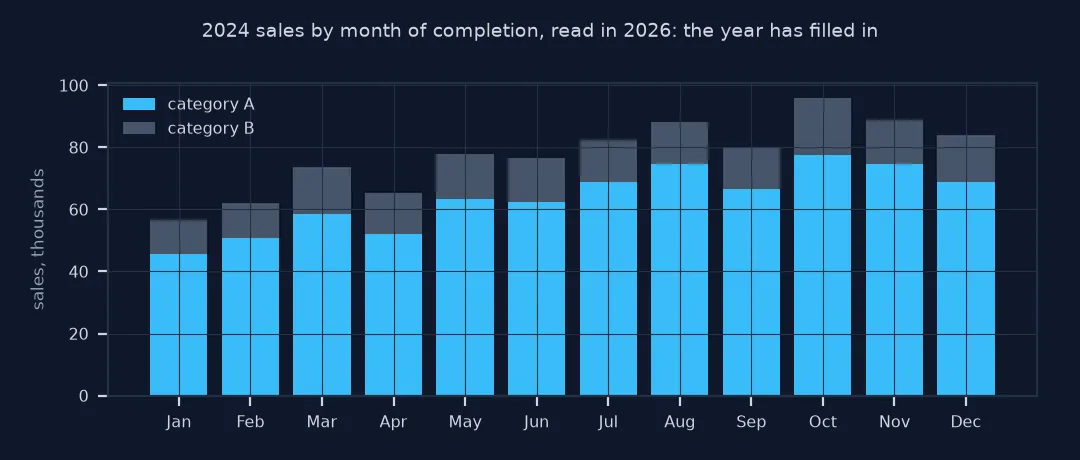
Sales are registered after completion, so the latest months of a download can be incomplete. Count sales by month of completion to see whether the year has filled in:
m = P.groupby(P.date.dt.month).size()
print({mo: int(v) for mo, v in m.items()})
print(f"December's sales as a share of the monthly average: {m[12] / m.mean():.0%}")
{1: 56602, 2: 62203, 3: 73662, 4: 65236, 5: 77734, 6: 76471, 7: 82300, 8: 88116, 9: 80067, 10: 96014, 11: 88950, 12: 84098}
December's sales as a share of the monthly average: 108%
Read in 2026, the 2024 file has filled in: December's sales are 8% above the monthly average, and October is the busiest month. In a file downloaded early in a year, the most recent months fall short of this until late registrations arrive.
What an address looks like
The data used on this page
HM Land Registry Price Paid Data for 2024, pp-2024.csv as published at the time of the run (© Crown copyright 2026, Open Government Licence v3.0).
from pathlib import Path

import pandas as pd
import requests

Path("data").mkdir(exist_ok=True)
CSV = Path("data/pp-2024.csv")
if not CSV.exists():
    r = requests.get("http://prod1.publicdata.landregistry.gov.uk.s3-website-eu-west-1.amazonaws.com/pp-2024.csv", timeout=1800); r.raise_for_status(); CSV.write_bytes(r.content)
COLS = ["transaction_id", "price", "date", "postcode", "property_type", "old_new", "duration", "paon", "saon",
        "street", "locality", "town", "district", "county", "ppd_category", "record_status"]
P = pd.read_csv(CSV, header=None, names=COLS, parse_dates=["date"])
print(f"file last read: {CSV.stat().st_size / 1e6:.0f} MB")
file last read: 162 MB
Example 1: what an address looks like
PAON and SAON together identify a property. See how often flats have a SAON:
f = P[P.property_type == "F"]
print(f"flats with a SAON (flat number or name): {f.saon.notna().mean():.0%}; houses with a SAON: {P[P.property_type.isin(list('DST'))].saon.notna().mean():.1%}")
print(f"sales with no postcode: {P.postcode.isna().sum():,}")
flats with a SAON (flat number or name): 64%; houses with a SAON: 1.3%
sales with no postcode: 2,749
64% of flat sales have a SAON, such as "FLAT 3", against 1.3% of houses. A property is identified by postcode, PAON, SAON and street together; 2,749 sales have no postcode at all.
Sales appear once registered
Price Paid Data is published by HM Land Registry from the registration of residential property sales in England and Wales. A sale appears once the transfer is registered, which happens after completion, often weeks and sometimes months later. Each record holds the price, the completion date, the address, and four codes. Property type is detached, semi-detached, terraced, flat or other. Old/new is a new build or an established home. Duration is freehold or leasehold. The category is standard (A) or additional (B). Category B was added in 2013 to include sales such as repossessions, buy-to-let purchases identified by a mortgage, and transfers to companies, which are excluded from the official House Price Index. Type "other" appears only in category B.
Scope matters as much as structure. Scotland and Northern Ireland keep separate registers and are not included. Sales not for value, such as gifts or transfers between spouses, are excluded, and so are some right-to-buy and shared-ownership sales. The yearly files keep growing after the year ends as late registrations arrive, and records are corrected or deleted through monthly change files. So the latest months of any download understate the number of sales, and published totals for a year change for some time afterwards.
Shared ownership, commercial property and licences
- Shared ownership: sales of a share are generally excluded; the price of a full staircasing purchase may appear.
- Commercial property: only residential sales are included; mixed-use and commercial sales may appear as type "other" in category B.
- Licence: Open Government Licence v3.0; credit HM Land Registry and note the Crown copyright.
- Address data: addresses are given as registered; the related data is personal data under UK GDPR when combined with other information.
Internal links
- How to analyse HM Land Registry price paid data in Python — working with the file
- Fixing Land Registry CSVs that have no header — reading it correctly
- House price index methods explained — indices built from it
FAQ
What is HM Land Registry Price Paid Data?
A record of residential property sales in England and Wales registered with HM Land Registry since 1995, with price, date, address and property codes.
Does price paid data include all house sales?
Most sales for value in England and Wales; it excludes Scotland, Northern Ireland, gifts and some shared-ownership and right-to-buy sales.
Why are recent months missing sales?
Sales appear only once registered, often weeks or months after completion, so recent months fill in over time.
What is the difference between category A and B?
A is a standard sale at market value; B covers additional transactions such as repossessions, buy-to-let and company purchases.