
Why Is My Average Wind Direction Wrong?
On this page
Problem statement
You average a day of wind directions and get an answer that no hour of the day agreed with: the wind blew from the north all day, and the average says east-south-east. The arithmetic is right and the method is wrong. Directions are angles on a circle, and 350° and 10° are 20° apart, but their arithmetic mean is 180°, the opposite direction. Any average that crosses north is pulled towards the south, and the error has nothing to do with the data.
This page measures how often the naive average fails, using a year of hourly wind reports from Chicago O'Hare in 2024, and compares the two correct ways to average directions.
Quick answer
Average the components, not the angles, then convert back to a direction:
day = H[H.day == pd.Timestamp("2024-03-06").date()]
naive = day.dir.mean()
u, v = (-day.speed * np.sin(np.radians(day.dir))).mean(), (-day.speed * np.cos(np.radians(day.dir))).mean()
vector_mean = np.degrees(np.arctan2(-u, -v)) % 360
print(f"6 March 2024, {len(day)} hourly directions: {day.dir.astype(int).tolist()}")
print(f"arithmetic mean {naive:.0f}°; vector mean {vector_mean:.0f}°")
6 March 2024, 24 hourly directions: [10, 10, 10, 350, 340, 340, 350, 350, 360, 360, 10, 10, 10, 20, 20, 30, 40, 40, 40, 30, 30, 20, 30, 30]
arithmetic mean 118°; vector mean 16°
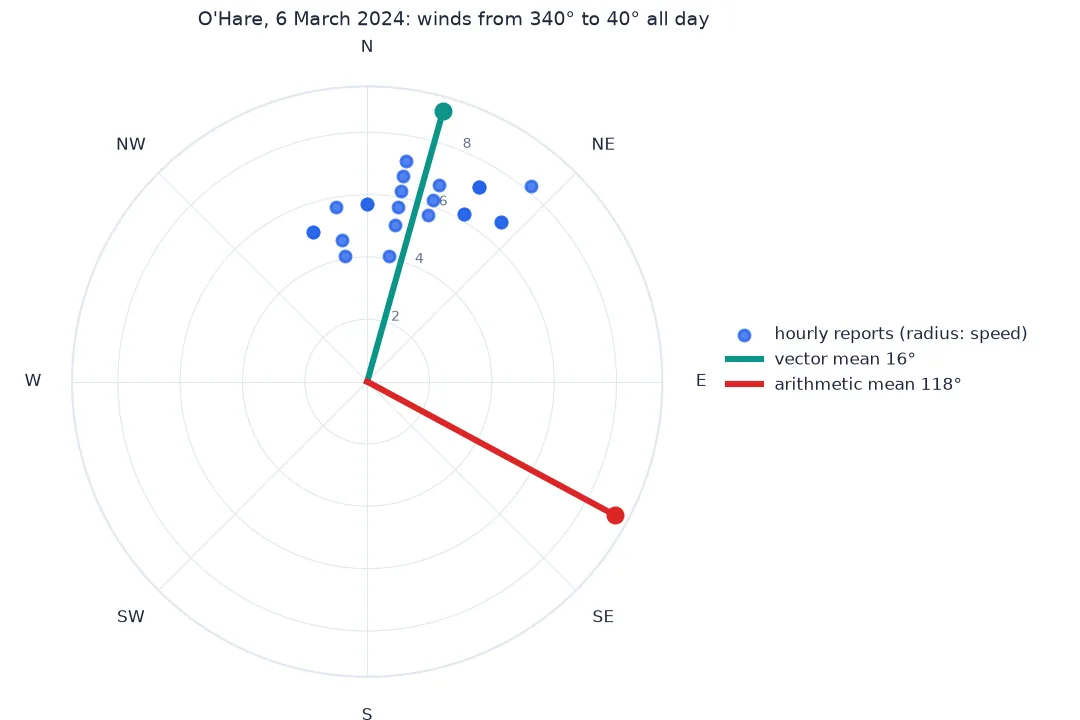
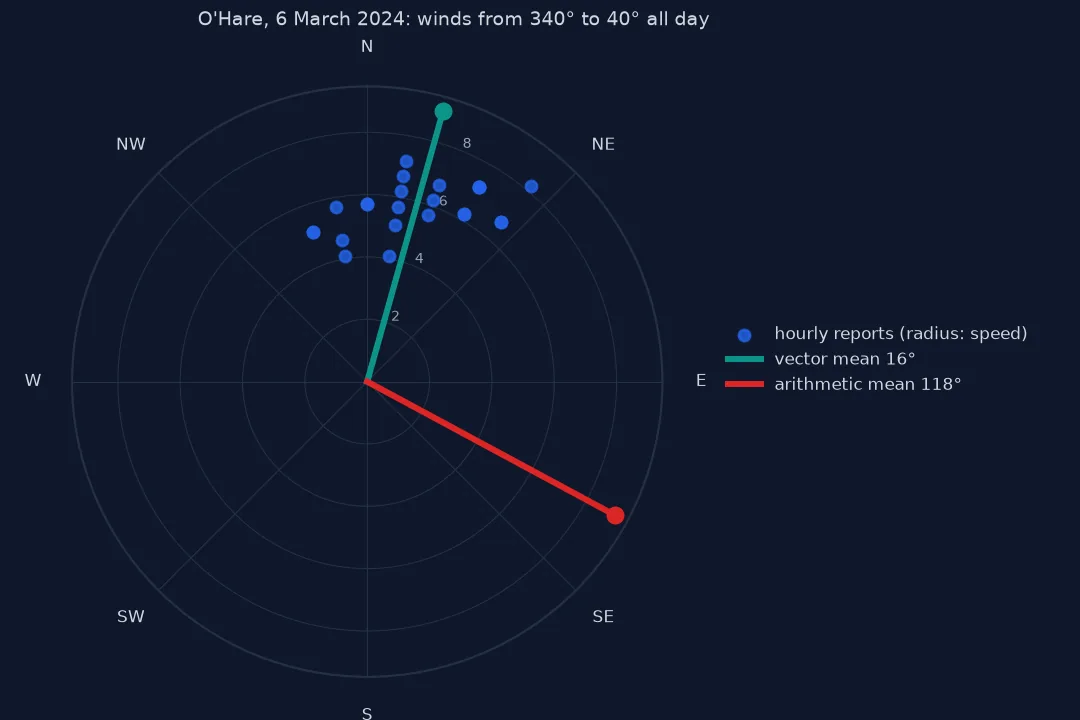
Why the arithmetic mean fails, two correct averages, steadiness
1. See why the arithmetic mean fails
On a circle the number 0 is next to 359, and the arithmetic mean does not know it. Any set of directions on both sides of north averages towards 180°:
for pair in ([350, 10], [340, 20], [330, 30], [90, 110]):
    a = np.radians(pair)
    circ = np.degrees(np.arctan2(np.sin(a).mean(), np.cos(a).mean())) % 360
    print(f"{pair}: arithmetic {np.mean(pair):.0f}°, on the circle {circ:.0f}°")
[350, 10]: arithmetic 180°, on the circle 360°
[340, 20]: arithmetic 180°, on the circle 0°
[330, 30]: arithmetic 180°, on the circle 360°
[90, 110]: arithmetic 100°, on the circle 100°
2. Choose between the two correct averages
There are two defensible answers. The vector mean weights each hour by its speed and gives the direction the air moved overall; the unit-vector, or circular, mean gives each hour the same weight and gives the typical direction regardless of strength:
H["u"], H["v"] = -H.speed * np.sin(np.radians(H.dir)), -H.speed * np.cos(np.radians(H.dir))
H["su"], H["cu"] = np.sin(np.radians(H.dir)), np.cos(np.radians(H.dir))
D = H.groupby("day").agg(naive=("dir", "mean"), u=("u", "mean"), v=("v", "mean"), su=("su", "mean"), cu=("cu", "mean"),
                         speed=("speed", "mean"), n=("dir", "size"))
D["vector"] = np.degrees(np.arctan2(-D.u, -D.v)) % 360
D["circular"] = np.degrees(np.arctan2(D.su, D.cu)) % 360
wrap = lambda a: (a + 180) % 360 - 180
print(f"{len(D)} days; vector against circular mean: median difference {wrap(D.vector - D.circular).abs().median():.1f}°, "
      f"more than 45° apart on {(wrap(D.vector - D.circular).abs() > 45).sum()} days")
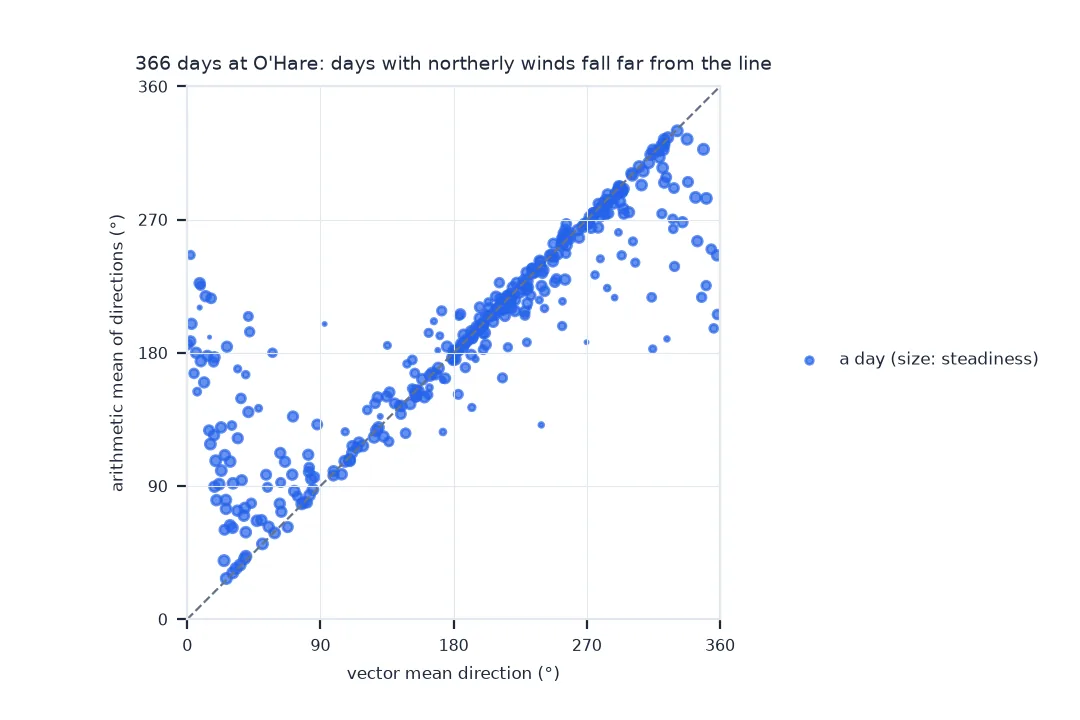
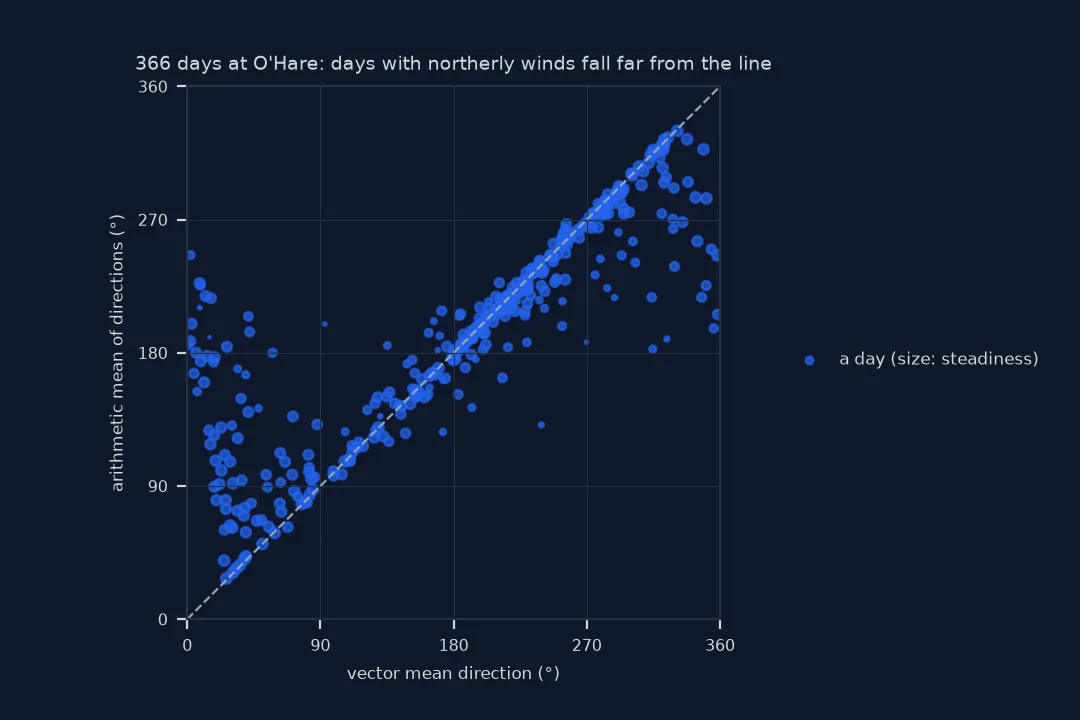
366 days; vector against circular mean: median difference 3.3°, more than 45° apart on 8 days
3. Report how steady the wind was
A mean direction means little if the wind went round the compass. The steadiness, the length of the mean vector over the mean speed, says how much the mean represents:
D["steadiness"] = np.hypot(D.u, D.v) / D.speed
print(f"days with steadiness above 0.8: {(D.steadiness > 0.8).sum()}; below 0.3: {(D.steadiness < 0.3).sum()}")
print(f"6 March: steadiness {D.loc[pd.Timestamp('2024-03-06').date(), 'steadiness']:.2f}")
days with steadiness above 0.8: 234; below 0.3: 14
6 March: steadiness 0.95
How often the naive average is wrong
The data used on this page
NOAA's Integrated Surface Database, routine hourly reports (FM-15) from Chicago O'Hare International Airport for 2024, with calm and variable winds excluded from the directions.
from pathlib import Path

import numpy as np
import pandas as pd
import requests

Path("data").mkdir(exist_ok=True)
F = Path("data/72530094846.csv")
if not F.exists():
    F.write_bytes(requests.get("https://noaa-global-hourly-pds.s3.amazonaws.com/2024/72530094846.csv", timeout=300).content)
raw = pd.read_csv(F, usecols=["DATE", "REPORT_TYPE", "WND"], dtype=str)
raw = raw[raw.REPORT_TYPE.str.strip() == "FM-15"]
w = raw.WND.str.split(",", expand=True)
H = pd.DataFrame({"time": pd.to_datetime(raw.DATE), "dir": pd.to_numeric(w[0].replace("999", np.nan)),
                  "speed": pd.to_numeric(w[3].replace("9999", np.nan)) / 10, "kind": w[2]})
H = H[(H.kind == "N") & H.dir.notna() & H.speed.notna()].copy()
H["day"] = H.time.dt.date
print(f"{len(H):,} hourly reports with a direction, {H.day.nunique()} days")
8,078 hourly reports with a direction, 366 days
Example 1: how often the naive average is wrong
err = wrap(D.naive - D.vector).abs()
print(f"days where the arithmetic mean is more than 45° off: {(err > 45).sum()}; more than 90°: {(err > 90).sum()}")
north = D[(D.vector >= 330) | (D.vector <= 30)]
print(f"on the {len(north)} days with a northerly vector mean, the arithmetic mean had a median of {north.naive.median():.0f}°")
days where the arithmetic mean is more than 45° off: 76; more than 90°: 44
on the 50 days with a northerly vector mean, the arithmetic mean had a median of 182°
Example 2: SciPy agrees
scipy.stats.circmean computes the unit-vector mean:
from scipy.stats import circmean

c = circmean(np.radians(day.dir), high=2 * np.pi)
print(f"scipy circmean for 6 March: {np.degrees(c):.1f}°; ours: {D.loc[pd.Timestamp('2024-03-06').date(), 'circular']:.1f}°")
scipy circmean for 6 March: 13.4°; ours: 13.4°
An angle is a position on a circle
An angle is a position on a circle, and the circle has no natural zero; the arithmetic mean assumes a line with one. The fix is to map each direction to a point on the circle, its sine and cosine or its wind components, average the points, and read the angle of the average. The average point lies inside the circle, and its distance from the centre is a measure of agreement: 1 if every direction was the same, near 0 if they were spread all round.
The vector and circular means usually agree closely, because strong and weak winds tend to come from similar directions within a day. They part company on days with a light, shifting breeze and a short, strong blow from elsewhere: the vector mean follows the blow, the circular mean the breeze. Which is right depends on the purpose: transport and dispersion follow the vector mean; the "usual" direction for a wind rose sector or a runway follows the circular one.
Calm, variable winds and resampling
- Calm: exclude calm hours from directions; they have no direction, not a direction of 0°.
- Variable: METAR variable winds (
V) have no single direction; exclude them too. - Pandas resample:
.resample("D").mean()on a direction column makes exactly this mistake. - Model output: models give
uandv; average those and never convert to directions first. - Standard deviation: the arithmetic standard deviation of directions is just as wrong; use the circular standard deviation,
scipy.stats.circstd.
Internal links
- How to calculate a wind climatology in Python — vector means over decades
- How to make a wind rose in Python — frequency by direction
FAQ
How do I average wind direction in Python?
Convert to components, u = −s·sin(d) and v = −s·cos(d), average them, and convert back with atan2(−u, −v); or use scipy.stats.circmean on the directions in radians.
Why does averaging 350 and 10 degrees give 180?
The arithmetic mean treats directions as numbers on a line; on a circle, 350° and 10° are 20° apart and average to 0°.
What is the difference between vector mean and circular mean wind direction?
The vector mean weights each observation by its speed; the circular mean weights them equally.
How do I know if an average wind direction is meaningful?
Check the steadiness or the circular spread: if the wind came from all directions, no average represents it.