
How to Calculate a Wind Climatology in Python
On this page
Problem statement
A wind climatology is the typical wind of a place, averaged over decades. Averaging wind needs two different averages, and they answer different questions. The mean of the speed says how windy a place is. The mean of the vector, averaging u and v and then taking the length, says how much air is carried in one direction on average, and in a place where the wind blows from every quarter it can be close to zero while the mean speed is high. Their ratio, the steadiness, separates the trade winds, which blow from the same direction month after month, from the westerly belts, where storms bring wind from everywhere.
This page builds a 1991–2020 climatology from the NCEP/NCAR Reanalysis 1 monthly means, maps the mean vector and the steadiness, and compares the two averages at four places.
Quick answer
Average the components and the speed separately over the normal period, then compare:
period = slice("1991-01-01", "2020-12-31")
U = DS.uwnd.sel(time=period).mean("time")
V = DS.vwnd.sel(time=period).mean("time")
S = DS.wspd.sel(time=period).mean("time")
vector_mean = np.hypot(U, V)
steadiness = vector_mean / S
for name, (lat, lon) in PLACES.items():
    p = dict(lat=lat, lon=lon % 360, method="nearest")
    print(f"{name:>26}: mean speed {float(S.sel(**p)):4.1f} m/s, mean vector {float(vector_mean.sel(**p)):4.1f} m/s, "
          f"steadiness {float(steadiness.sel(**p)):.2f}")
trade winds, 15°N 140°W: mean speed 8.2 m/s, mean vector 7.9 m/s, steadiness 0.96
Southern Ocean, 50°S 90°E: mean speed 12.6 m/s, mean vector 10.5 m/s, steadiness 0.83
equatorial Atlantic, 0° 25°W: mean speed 4.8 m/s, mean vector 4.2 m/s, steadiness 0.87
Chicago, 42°N 88°W: mean speed 5.2 m/s, mean vector 1.6 m/s, steadiness 0.30
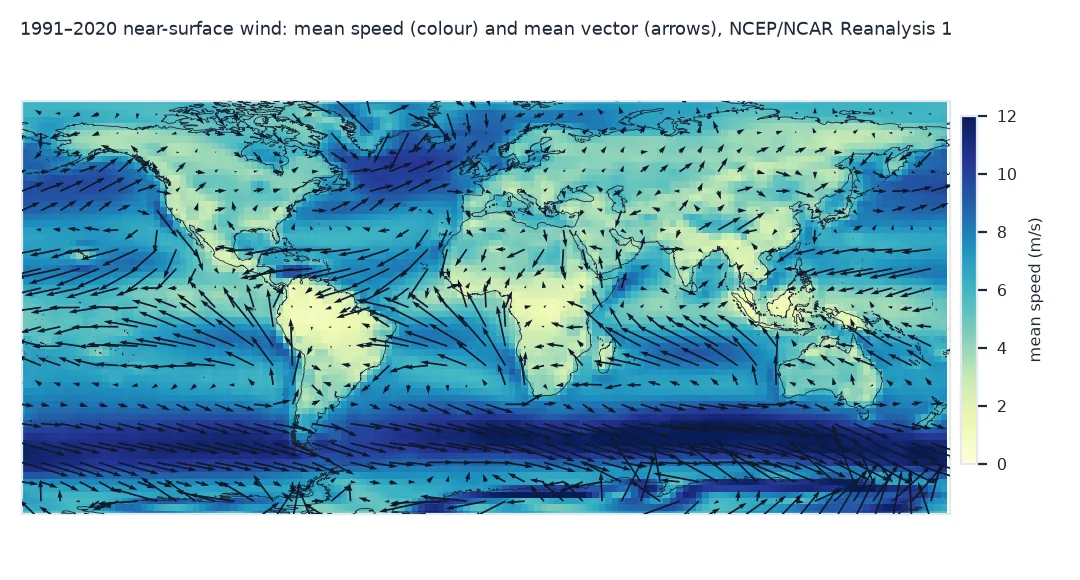
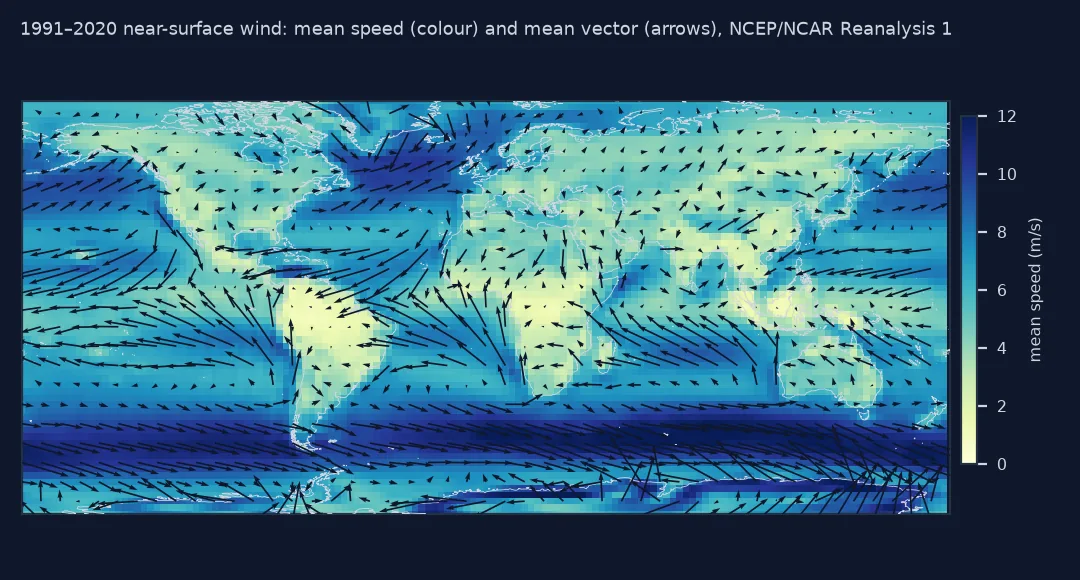
A covered period, how the mean speed was made, steadiness
1. Choose the period and check the data cover it
Climate normals use 30-year periods; 1991–2020 is the current one. The reanalysis runs from 1948:
print(f"months available: {DS.sizes['time']:,}, {pd.Timestamp(DS.time.values[0]):%Y-%m} to {pd.Timestamp(DS.time.values[-1]):%Y-%m}")
print(f"months in 1991–2020: {DS.uwnd.sel(time=period).sizes['time']} (expect 360)")
months available: 938, 1948-01 to 2026-02
months in 1991–2020: 360 (expect 360)
2. Read how the mean speed was made
The wspd file is not the mean of every instantaneous speed: its metadata say it is computed from daily speeds, which are themselves from daily vector winds. Variation within each day is averaged out before the speed is taken, so this mean speed is lower than one from 6-hourly winds would be, and the steadiness correspondingly higher:
print(DS.wspd.attrs["long_name"])
print(f"grid: {DS.sizes['lat']} × {DS.sizes['lon']}, {float(abs(DS.lat[1] - DS.lat[0]))}° spacing; level {DS.wspd.attrs.get('level')}")
Monthly Mean Wind Speed at sigma level 0.995 from daily wind speed (from daily vector winds)
grid: 73 × 144, 2.5° spacing; level 0.995 sigma
3. Map steadiness
bands = steadiness.groupby_bins("lat", [-90, -60, -30, -10, 10, 30, 60, 90]).mean(...)
print(bands.to_series().round(2).to_string())
print(f"share of the globe with steadiness above 0.8: {float((steadiness > 0.8).weighted(np.cos(np.radians(steadiness.lat))).mean()):.0%}")
lat_bins
(-90, -60] 0.64
(-60, -30] 0.54
(-30, -10] 0.70
(-10, 10] 0.62
(10, 30] 0.59
(30, 60] 0.35
(60, 90] 0.27
share of the globe with steadiness above 0.8: 22%
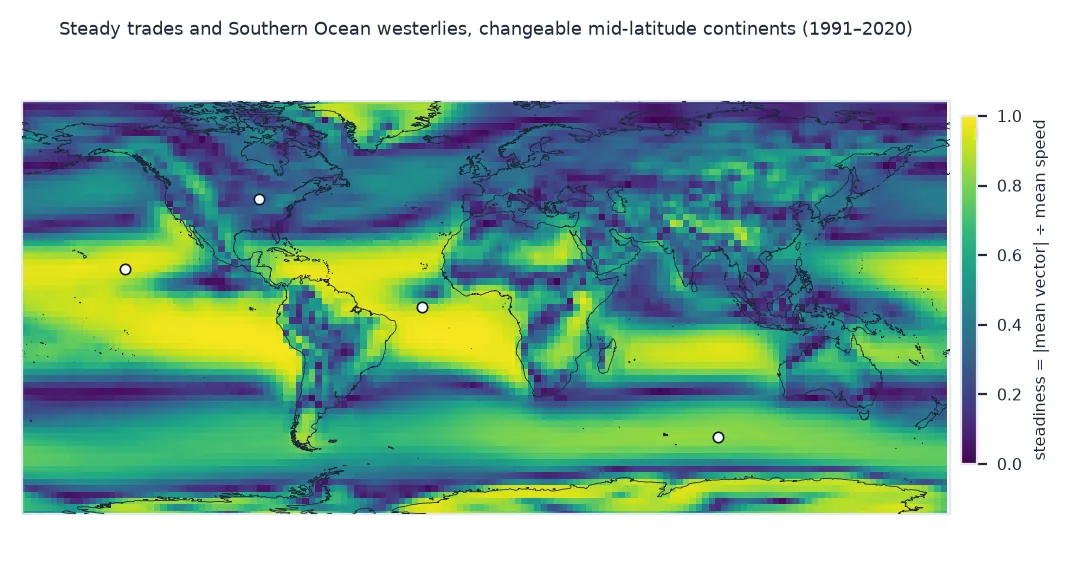
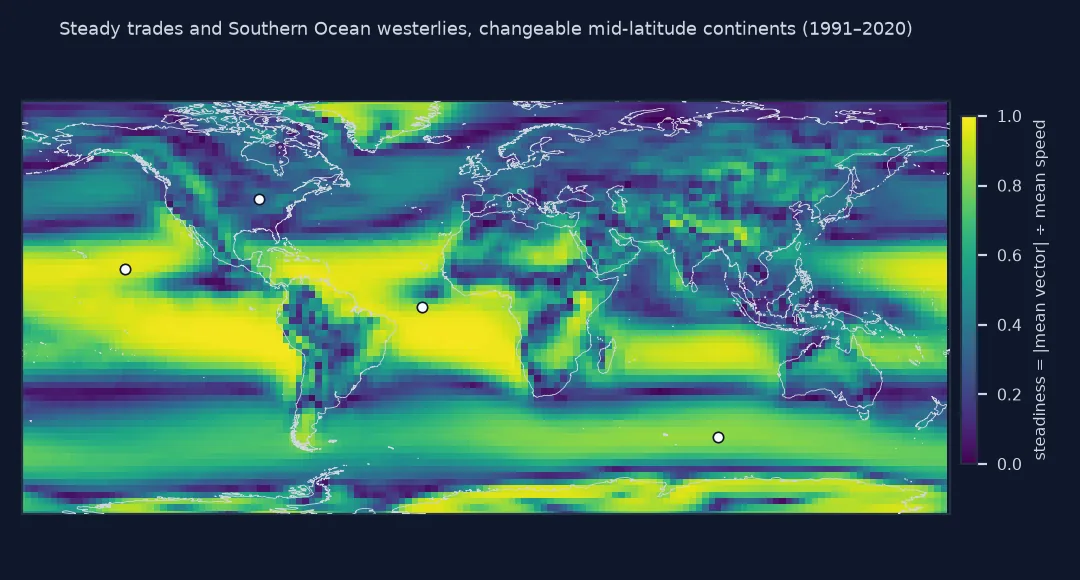
Winter and summer at Chicago
The data used on this page
NCEP/NCAR Reanalysis 1 monthly means at the near-surface sigma level 0.995 from NOAA PSL: uwnd, vwnd and wspd, 2.5° grid, 1948 to the present.
import os
import subprocess
from pathlib import Path

import numpy as np
import pandas as pd
import xarray as xr

Path("data").mkdir(exist_ok=True)
BASE = "https://psl.noaa.gov/thredds/fileServer/Datasets/ncep.reanalysis/Monthlies/surface"
for v in ("uwnd", "vwnd", "wspd"):
    p = Path(f"data/{v}.mon.mean.nc")
    for _ in range(5):                                   # PSL drops connections: resume and retry
        if p.exists():
            break
        part = str(p) + ".part"
        if subprocess.run(["curl", "-sfL", "-C", "-", "--retry", "3", "-o", part, f"{BASE}/{v}.mon.mean.nc"]).returncode == 0:
            os.replace(part, p)
    if not p.exists():
        raise RuntimeError(f"could not download {v}.mon.mean.nc")
DS = xr.merge([xr.open_dataset(f"data/{v}.mon.mean.nc")[v] for v in ("uwnd", "vwnd", "wspd")]).load()
PLACES = {"trade winds, 15°N 140°W": (15, -140), "Southern Ocean, 50°S 90°E": (-50, 90),
          "equatorial Atlantic, 0° 25°W": (0, -25), "Chicago, 42°N 88°W": (42, -88)}
print(f"variables {list(DS.data_vars)}; {DS.sizes['time']} months")
variables ['uwnd', 'vwnd', 'wspd']; 938 months
Example 1: winter and summer at Chicago
The mean vector changes with the season even where the annual one is weak:
p = dict(lat=42, lon=272, method="nearest")
for label, months in (("Dec–Feb", [12, 1, 2]), ("Jun–Aug", [6, 7, 8])):
    sub = DS.sel(time=period).sel(time=DS.sel(time=period).time.dt.month.isin(months))
    u, v = float(sub.uwnd.sel(**p).mean()), float(sub.vwnd.sel(**p).mean())
    d = np.degrees(np.arctan2(-u, -v)) % 360
    print(f"{label}: mean vector {np.hypot(u, v):.1f} m/s from {d:.0f}°, mean speed {float(sub.wspd.sel(**p).mean()):.1f} m/s")
Dec–Feb: mean vector 2.7 m/s from 254°, mean speed 5.8 m/s
Jun–Aug: mean vector 1.2 m/s from 214°, mean speed 4.1 m/s
The mean of speeds is not the speed of the mean
The two averages differ because speed is the length of a vector, and the average of lengths is never smaller than the length of the average. They are equal only if the wind always blows from the same direction. Steadiness, the ratio, therefore runs from 0, for winds that come equally from every direction, to 1, for a wind that never changes direction. The trade winds and the westerlies of the Southern Ocean are steady; the mid-latitude continents, where weather systems pass every few days, are not.
Which average to use depends on the question. Wind energy and wind loading depend on speed, and in fact on the full distribution of speed. Transport, of moisture, dust, pollution or seeds, depends on the vector mean. Mapping a climatological "wind direction" from averaged directions is meaningless where steadiness is low; average the components instead, and show the steadiness alongside.
Resolution, inhomogeneity and monthly vectors
- Resolution: a 2.5° reanalysis smooths coasts and mountains; use ERA5 or a regional reanalysis for local climatology.
- Level: sigma 0.995 is about 40 m above the surface; it is close to, but not the same as, 10 m wind.
- Inhomogeneity: the observing system changed over the decades, especially with satellites from 1979; trends need care.
- Seasons: an annual steadiness can hide two steady seasons with opposite winds, as in monsoon regions.
- Speed from monthly vectors: never compute mean speed from monthly mean u and v; that is the vector mean.
Internal links
- Why is my average wind direction wrong? — averaging directions
- Wind resource explained — speed distributions for energy
FAQ
How do I calculate average wind direction over many years?
Average the u and v components, then compute the direction from the averages; do not average directions in degrees.
What is wind steadiness?
The ratio of the mean vector wind's length to the mean wind speed, from 0 for winds from all directions to 1 for a constant direction.
Where can I get long-term wind data for free?
NOAA PSL publishes the NCEP/NCAR Reanalysis monthly means since 1948; ERA5 from Copernicus has finer resolution and needs an account.
Why is mean vector wind smaller than mean wind speed?
Winds from opposite directions cancel in the vector average but add in the speed average.