
How to Make a Wind Rose in Python
On this page
Problem statement
A wind rose summarises a year of wind at one place on a single figure: how often the wind comes from each direction, and how strong it is when it does. Airports use roses to align runways, engineers to site turbines and stacks, planners to judge where smoke and noise will go. The plot itself is a stacked bar chart on polar axes. The work is in the data: choosing which reports to count, keeping calm and variable winds out of the directional bars but in the total, and binning directions so that north is a whole sector, not two halves.
This page builds a wind rose for Chicago O'Hare International Airport for 2024 from NOAA's Integrated Surface Database, with matplotlib alone, and compares winter with summer.
Quick answer
Keep one report per hour, decode the wind field, bin direction into 16 sectors centred on north, and stack speed classes on polar bars:
SECTORS = 16
width = 360 / SECTORS
H["sector"] = ((H.dir + width / 2) // width % SECTORS).astype("Int64")      # sector 0 is centred on north
bins, labels = [0, 3, 6, 9, 12, 99], ["0–3", "3–6", "6–9", "9–12", "12+"]
H["speed_class"] = pd.cut(H.speed, bins, labels=labels, right=False)
table = pd.crosstab(H.sector, H.speed_class).reindex(range(SECTORS), fill_value=0) / len(ALL) * 100   # % of all hours
ax = plt.figure(figsize=(6, 6)).add_subplot(projection="polar")
ax.set_theta_zero_location("N"); ax.set_theta_direction(-1)                  # compass, not maths, angles
bottom = np.zeros(SECTORS)
for lab in labels:
    ax.bar(np.radians(np.arange(SECTORS) * width), table[lab], width=np.radians(width) * 0.95, bottom=bottom, label=f"{lab} m/s")
    bottom += table[lab].values
plt.legend(loc="lower left", bbox_to_anchor=(1.0, 0)); plt.savefig("ohare_rose.png", dpi=150, bbox_inches="tight")
top = table.sum(axis=1).idxmax()
print(f"{len(ALL):,} hourly reports: {len(H):,} with a direction, {CALM} calm, {VAR} variable")
print(f"most frequent sector: {NAMES[top]} ({table.sum(axis=1)[top]:.1f}% of hours)")
8,756 hourly reports: 8,078 with a direction, 517 calm, 160 variable
most frequent sector: W (9.8% of hours)
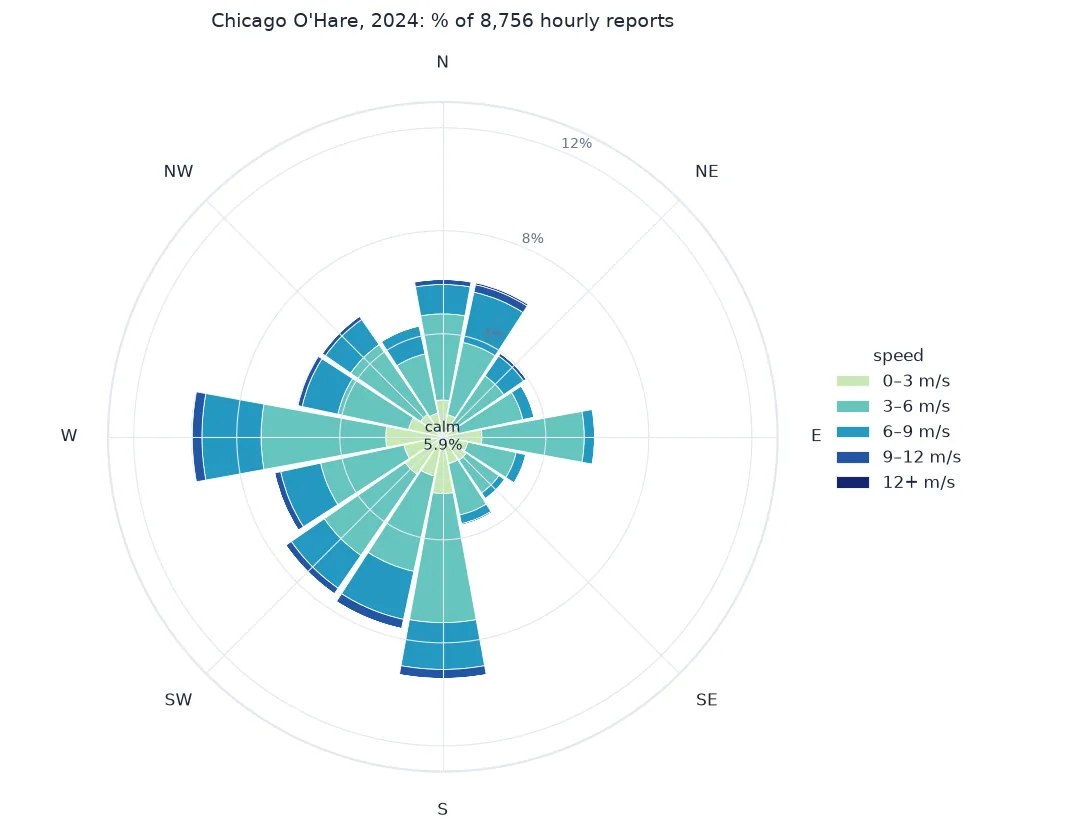
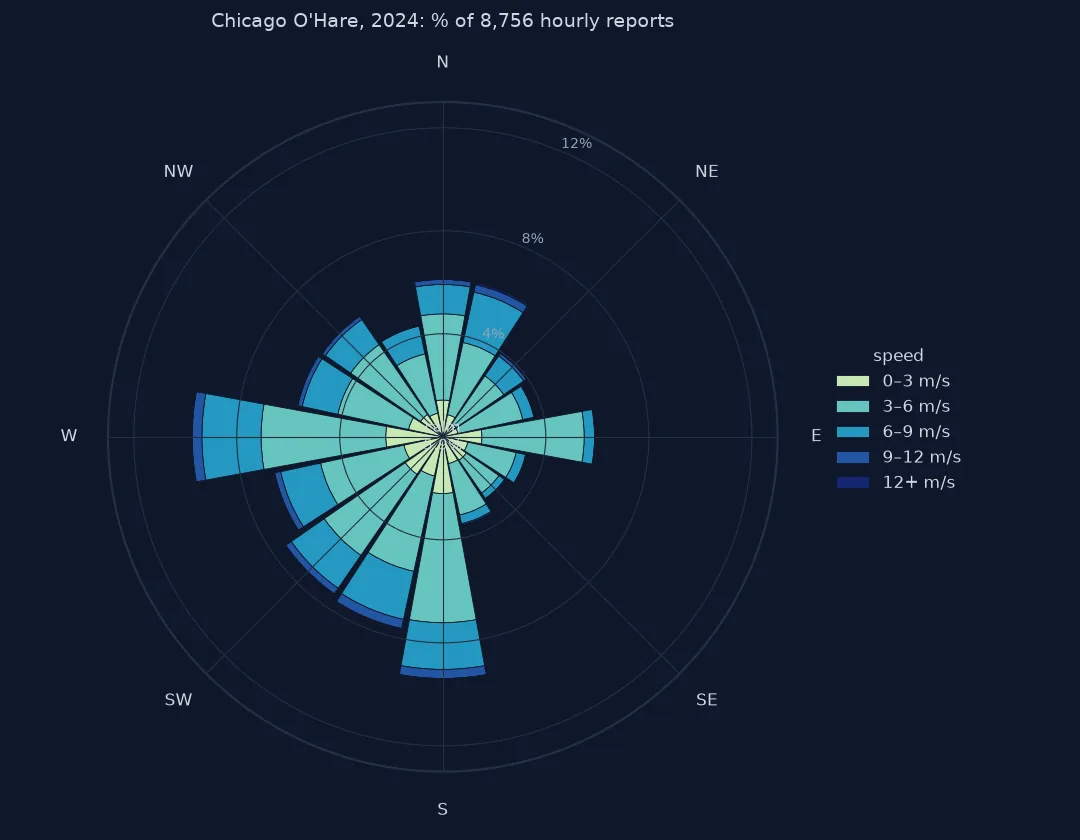
One report per hour, decoded winds, centred sectors
1. Count one report per hour
ISD holds several kinds of report for the same station: routine hourly METARs (FM-15), special reports issued when the weather changes (FM-16), synoptic reports (FM-12) and daily summaries. Counting them all over-weights the hours when the weather was changing:
print(RAW.REPORT_TYPE.str.strip().value_counts().to_string())
print(f"hours in 2024: {366 * 24:,}; routine FM-15 reports: {len(ALL):,}")
REPORT_TYPE
FM-15 8756
FM-12 2766
FM-16 2140
SOD 353
SY-MT 14
SOM 12
hours in 2024: 8,784; routine FM-15 reports: 8,756
2. Decode the wind field
WND holds direction, a quality code, a type code, speed in tenths of a metre per second, and a quality code. Calm (C) and variable (V) winds have no usable direction:
print(ALL.wtype.value_counts().rename({"N": "normal", "C": "calm", "V": "variable", "9": "missing"}).to_string())
print(f"direction 999 (missing or variable): {(ALL.dir_raw == '999').sum()}; speed 9999 (missing): {(ALL.spd_raw == '9999').sum()}")
wtype
normal 8079
calm 517
variable 160
direction 999 (missing or variable): 627; speed 9999 (missing): 1
Calm hours belong in the denominator but not in any direction, so the bars are percentages of all hours and the calm percentage is printed in the middle of the rose.
3. Centre the sectors on the compass points
A naive direction // 22.5 makes the first sector 0–22.5°, so winds from 350° and from 10°, both northerly, fall in different sectors. Shifting by half a sector centres sector 0 on north:
naive = (H.dir // width).astype(int)
print(f"reports from 349–360° and 0–11°: {((H.dir >= 349) | (H.dir < 11.25)).sum()}; "
      f"naive sector 0 holds {(naive == 0).sum()}, centred sector 0 holds {(H.sector == 0).sum()}")
reports from 349–360° and 0–11°: 536; naive sector 0 holds 403, centred sector 0 holds 536
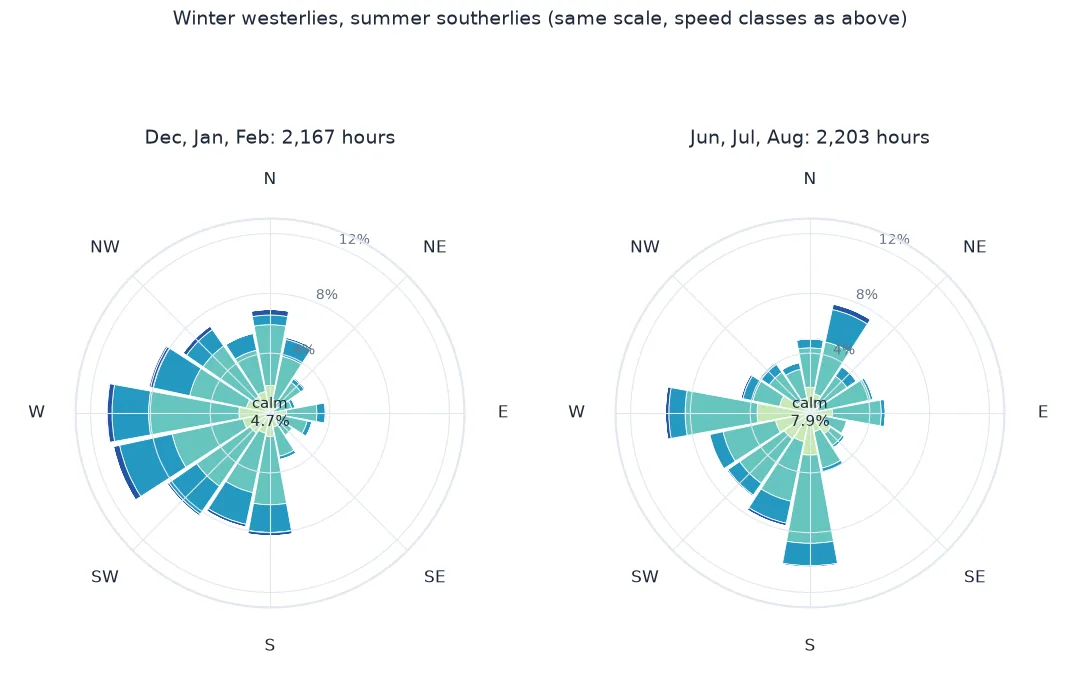
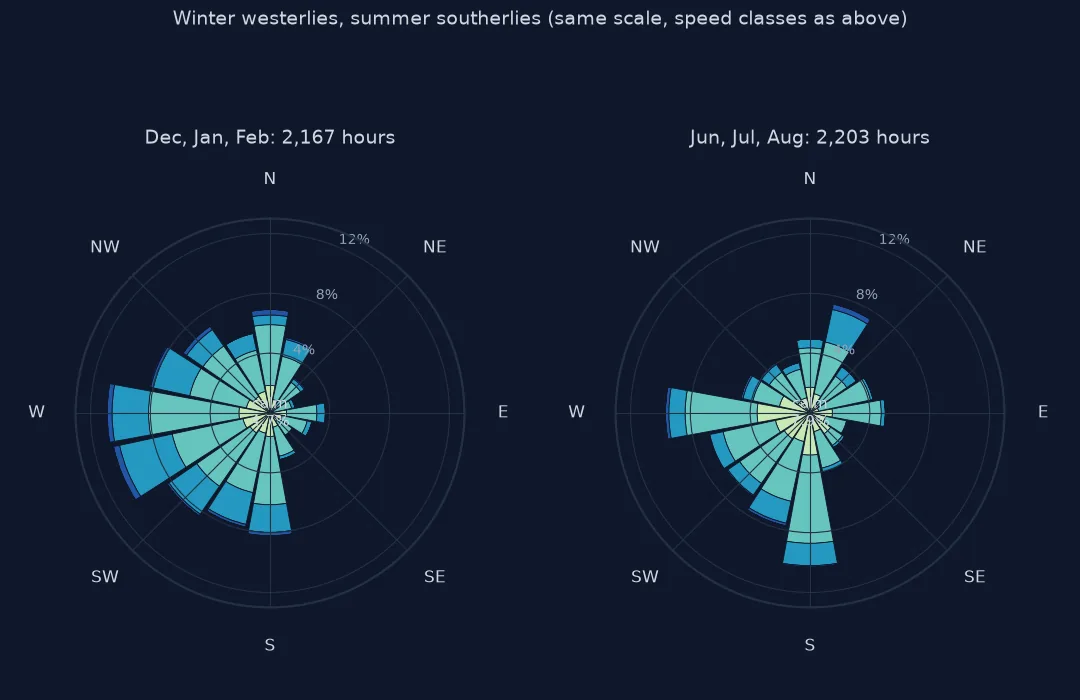
Winter against summer, and the numbers behind the rose
The data used on this page
NOAA's Integrated Surface Database, Global Hourly access file for Chicago O'Hare International Airport (station 725300-94846) for 2024.
from pathlib import Path

import matplotlib
matplotlib.use("Agg")
import matplotlib.pyplot as plt
import numpy as np
import pandas as pd
import requests

Path("data").mkdir(exist_ok=True)
F = Path("data/72530094846.csv")
if not F.exists():
    F.write_bytes(requests.get("https://noaa-global-hourly-pds.s3.amazonaws.com/2024/72530094846.csv", timeout=300).content)
RAW = pd.read_csv(F, usecols=["DATE", "REPORT_TYPE", "NAME", "WND"], dtype=str)
ALL = RAW[RAW.REPORT_TYPE.str.strip() == "FM-15"].copy()
ALL[["dir_raw", "dq", "wtype", "spd_raw", "sq"]] = ALL.WND.str.split(",", expand=True)
ALL["time"] = pd.to_datetime(ALL.DATE)
ALL["speed"] = pd.to_numeric(ALL.spd_raw.replace("9999", np.nan)) / 10            # tenths of m/s
ALL["dir"] = pd.to_numeric(ALL.dir_raw.replace("999", np.nan))
CALM, VAR = (ALL.wtype == "C").sum(), (ALL.wtype == "V").sum()
H = ALL[(ALL.wtype == "N") & ALL.dir.notna() & ALL.speed.notna()].copy()
NAMES = ["N", "NNE", "NE", "ENE", "E", "ESE", "SE", "SSE", "S", "SSW", "SW", "WSW", "W", "WNW", "NW", "NNW"]
print(f"{RAW.NAME.iloc[0]}: {len(RAW):,} reports in 2024, {len(ALL):,} routine hourly")
CHICAGO OHARE INTERNATIONAL AIRPORT, IL US: 14,041 reports in 2024, 8,756 routine hourly
Example 1: winter against summer
for label, months in (("Dec–Feb", [12, 1, 2]), ("Jun–Aug", [6, 7, 8])):
    s = H[H.time.dt.month.isin(months)]
    share = s.sector.value_counts(normalize=True).sort_index() * 100
    print(f"{label}: most frequent {NAMES[share.idxmax()]} ({share.max():.1f}%), mean speed {s.speed.mean():.1f} m/s; "
          f"from the western half (SSW to NNW): {share.loc[9:15].sum():.0f}%")
Dec–Feb: most frequent W (11.5%), mean speed 4.6 m/s; from the western half (SSW to NNW): 62%
Jun–Aug: most frequent S (11.6%), mean speed 4.0 m/s; from the western half (SSW to NNW): 49%
In winter 62% of the hours with a direction came from the western half of the compass, against 49% in summer, when south was the most frequent sector and the winds were lighter.
Example 2: the numbers behind the rose
The rose is a picture of this table; publish the table with it:
out = table.set_axis([NAMES[i] for i in table.index])
out["all"] = out.sum(axis=1)
out = out.round(1)
print(out.sort_values("all", ascending=False).head(5).to_string())
print(f"directional bars add up to {table.values.sum():.1f}% of hours; calm {CALM / len(ALL):.1%}, variable {VAR / len(ALL):.1%}")
speed_class 0–3 3–6 6–9 9–12 12+ all
W 2.2 4.8 2.3 0.4 0.0 9.8
S 2.2 5.0 1.8 0.4 0.0 9.4
SSW 1.6 3.8 1.9 0.4 0.0 7.6
SW 1.8 3.8 1.6 0.3 0.0 7.4
WSW 1.5 3.3 1.6 0.2 0.0 6.7
directional bars add up to 92.3% of hours; calm 5.9%, variable 1.8%
A vector distribution collapsed onto direction
A wind rose is a frequency distribution of a vector, collapsed onto direction. It answers "from where, how often, how strong", and loses everything about when: a rose cannot show whether the summer southerlies blow by day or by night, or which weather brought the strongest winds. Splitting by season or time of day recovers some of that, at the cost of more roses.
The design choices change what a rose shows. Sixteen sectors suit most purposes; thirty-six follow the reported 10° resolution but scatter the data thinly. Bar length can be linear in frequency, as here, or proportional to the square root so that area is proportional to frequency, which reads more fairly but is less common. Whatever the choices, the percentages must say what they are of: all hours, or only hours with a direction.
Report types, resolution and calm thresholds
- Report types: use
FM-15for hourly roses; addingFM-16specials over-weights changeable weather. - Reported resolution: METAR directions are rounded to 10°, so 16 sectors of 22.5° get unequal numbers of possible values; 36 sectors avoid that.
- Height: airport winds are measured at about 10 m; other sites differ, and speed changes with height.
- Calm threshold: calm is below about 1.5 m/s in METAR practice; low-speed bins are partly calm by another name.
- Missing hours: check how many hours are missing before treating percentages as climate.
Internal links
- How to calculate wind speed and direction from u and v — the convention behind the directions
- Wind resource explained — wind speed distributions for energy
FAQ
How do I make a wind rose in Python without the windrose package?
Use matplotlib polar axes with set_theta_zero_location("N") and set_theta_direction(-1), and stack bar calls, one per speed class.
Where can I get hourly wind data for a station?
From NOAA's Integrated Surface Database (Global Hourly), one CSV per station and year, or from the station's national weather service.
Should calm winds be included in a wind rose?
Yes, in the total: show their percentage in the centre and compute the sector percentages over all hours.
Why is north split across two sectors in my wind rose?
The sectors start at 0° instead of being centred on it; shift directions by half a sector before binning.