
Why Do My Wind Arrows Point the Wrong Way on a Projected Map?
On this page
Problem statement
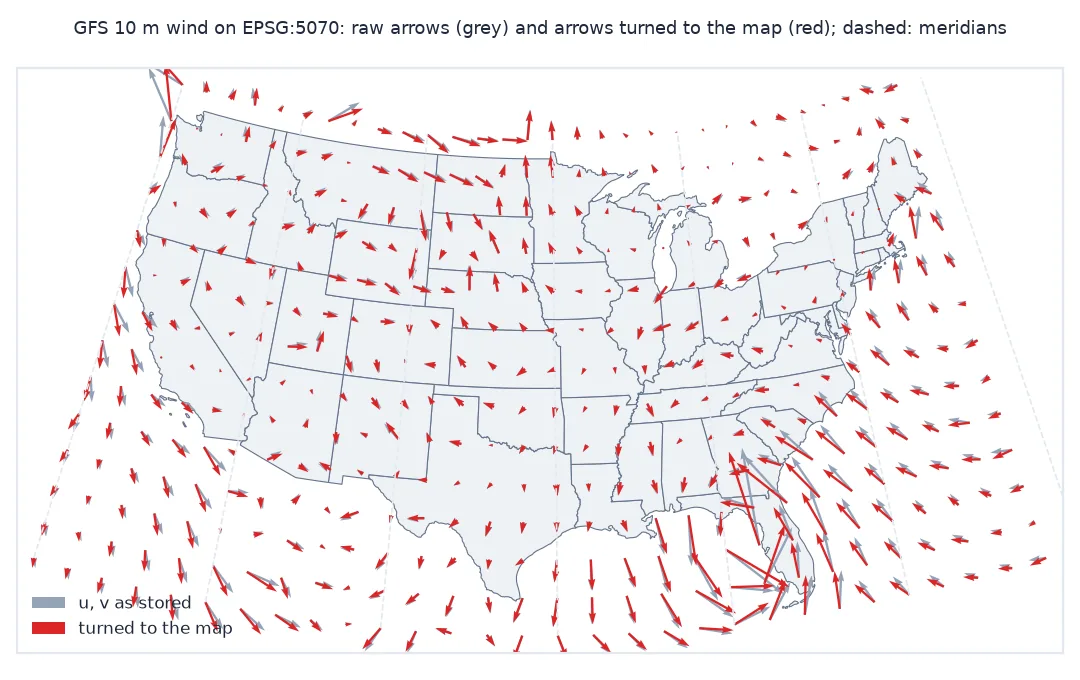
You project wind data onto a proper map, an Albers or Lambert projection of the United States, transform the arrow positions with pyproj, and draw quiver(x, y, u, v). The arrows look reasonable in the middle of the country and wrong towards the edges: a southerly wind drawn in California points west of the local meridian, one in Maine east of it. u and v are east and north components, and on a projected map east is not to the right and north is not up, except along one meridian. Transforming the positions without turning the vectors leaves every arrow pointing as if the map were not projected.
This page draws the GFS 10-metre wind of 00 UTC on 27 September 2024 on the USA Contiguous Albers Equal Area projection (EPSG:5070), measures how far the unrotated arrows are off, and fixes them two ways.
Quick answer
For each point, find the map directions of east and north by projecting two nearby points, and build the arrow from them:
geod = pyproj.Geod(ellps="WGS84")
d = 0.01                                                              # degrees
xe, ye = TO_MAP.transform(LON + d, LAT); xn, yn = TO_MAP.transform(LON, LAT + d)
m_east = geod.inv(LON, LAT, LON + d, LAT)[2]; m_north = geod.inv(LON, LAT, LON, LAT + d)[2]
E = np.stack([(xe - X) / m_east, (ye - Y) / m_east])                  # map units per metre east
N = np.stack([(xn - X) / m_north, (yn - Y) / m_north])                # map units per metre north
u_map, v_map = U * E[0] + V * N[0], U * E[1] + V * N[1]
drawn_raw = np.degrees(np.arctan2(V, U)); drawn_fix = np.degrees(np.arctan2(v_map, u_map))
err = (drawn_raw - drawn_fix + 180) % 360 - 180
print(f"{U.size} arrows; unrotated arrows off by {err.min():.1f}° to {err.max():.1f}°; "
      f"more than 10° off: {(np.abs(err) > 10).mean():.0%}")
420 arrows; unrotated arrows off by -17.9° to 17.9°; more than 10° off: 45%
Measure convergence, rotate, compare the two methods
1. Measure the angle between grid north and true north
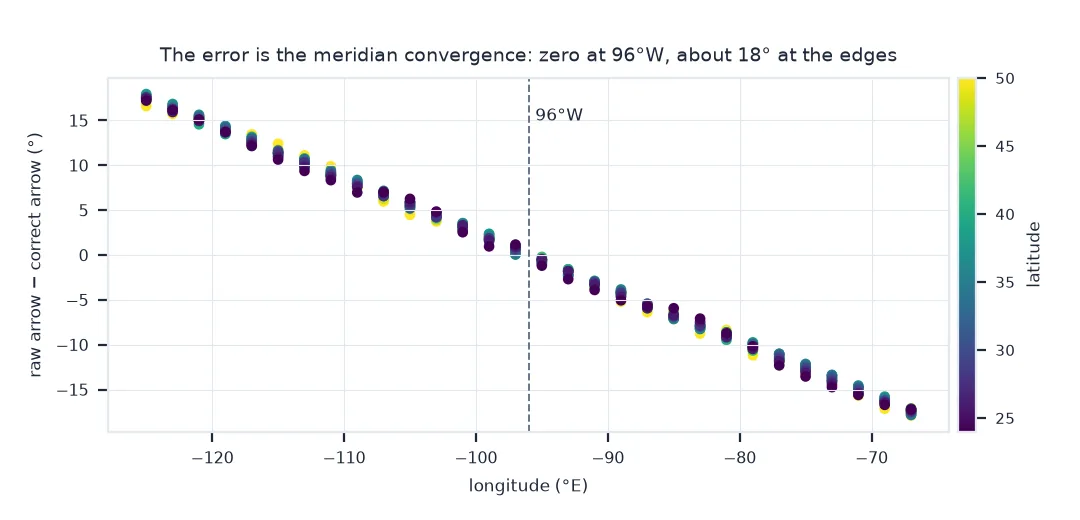
The meridian convergence is the angle between the map's "up" and true north at each point. It is zero on the projection's central meridian, 96°W for EPSG:5070, and grows towards the edges:
gamma = pyproj.Proj("EPSG:5070").get_factors(LON, LAT).meridian_convergence
print(f"meridian convergence across the map: {gamma.min():.1f}° to {gamma.max():.1f}°")
print(f"at 96°W: {pyproj.Proj('EPSG:5070').get_factors(-96.0, 38.0).meridian_convergence:.3f}°")
meridian convergence across the map: -17.5° to 17.5°
at 96°W: -0.000°
2. Rotate by that angle, the shortcut
Turning each vector by the convergence fixes most of the error. The direction of the turn is opposite to the rotation that converts grid-relative model winds to earth-relative ones, because here the conversion goes from the earth to the map:
g = np.radians(gamma)
u_rot, v_rot = np.cos(g) * U - np.sin(g) * V, np.sin(g) * U + np.cos(g) * V
e_rot = (np.degrees(np.arctan2(v_rot, u_rot)) - drawn_fix + 180) % 360 - 180
print(f"rotation by the convergence: largest remaining difference {np.abs(e_rot).max():.2f}°")
rotation by the convergence: largest remaining difference 0.98°
The small remainder is because Albers is equal-area, not conformal: scale differs slightly along the meridians and the parallels, so directions change a little beyond the rotation. The finite-difference method in the quick answer handles that exactly, for any projection.
3. Check the two methods against each other
The map direction of north comes out of the projected points, and independently out of pyproj's convergence. They must agree, and the unrotated arrows, which always point straight up, show the size of the error:
mer = np.degrees(np.arctan2(N[1], N[0]))                            # map direction of north, from the projected points
from_conv = 90 + gamma                                              # the same, from the meridian convergence
print(f"north from projected points vs from the convergence: largest difference {np.abs(mer - from_conv).max():.3f}°")
print(f"arrows that ignore the projection point straight up: off by up to {np.abs(90 - mer).max():.1f}°")
north from projected points vs from the convergence: largest difference 0.000°
arrows that ignore the projection point straight up: off by up to 17.5°
The corrected map itself
The data used on this page
The GFS 0.25° analysis for 00 UTC on 27 September 2024 from the NOAA GFS bucket on AWS, 10 m UGRD and VGRD, every eighth grid point over the contiguous United States, projected to EPSG:5070, USA Contiguous Albers Equal Area Conic.
from pathlib import Path

import matplotlib
matplotlib.use("Agg")
import matplotlib.pyplot as plt
import numpy as np
import pyproj
import requests
import xarray as xr

Path("data").mkdir(exist_ok=True)
GFS = "https://noaa-gfs-bdp-pds.s3.amazonaws.com/gfs.20240927/00/atmos/gfs.t00z.pgrb2.0p25.f000"
G = Path("data/gfs_helene.grib2")
if not G.exists():
    lines = requests.get(GFS + ".idx", timeout=60).text.splitlines()
    starts = [int(l.split(":")[1]) for l in lines]
    with open(G, "wb") as f:
        for i, l in enumerate(lines):
            if ":UGRD:10 m above ground:" in l or ":VGRD:10 m above ground:" in l:
                f.write(requests.get(GFS, headers={"Range": f"bytes={starts[i]}-{starts[i + 1] - 1}"}, timeout=120).content)
ds = xr.open_dataset(G, engine="cfgrib", decode_timedelta=False, backend_kwargs={
    "indexpath": "", "filter_by_keys": {"typeOfLevel": "heightAboveGround", "level": 10}}).load()
w = ds.sel(latitude=slice(50, 24), longitude=slice(235, 294))[{"latitude": slice(None, None, 8), "longitude": slice(None, None, 8)}]
LON, LAT = np.meshgrid(w.longitude.values - 360, w.latitude.values)
U, V = w.u10.values, w.v10.values
TO_MAP = pyproj.Transformer.from_crs(4326, 5070, always_xy=True)
X, Y = TO_MAP.transform(LON, LAT)
print(f"{U.size} points, projected to {pyproj.CRS(5070).name}")
420 points, projected to NAD83 / Conus Albers
Example 1: the map itself
fig, ax = plt.subplots(figsize=(9, 6))
ax.set_aspect("equal")                                            # projected metres: equal aspect
ax.quiver(X, Y, U, V, color="0.6", scale=300, label="u, v as stored")
ax.quiver(X, Y, u_map, v_map, color="crimson", scale=300, label="turned to the map")
ax.legend(loc="lower left"); fig.savefig("arrows_albers.png", dpi=150)
print(f"saved; axes span {(X.max() - X.min()) / 1000:,.0f} km by {(Y.max() - Y.min()) / 1000:,.0f} km")
saved; axes span 5,901 km by 3,209 km
Components tied to the projection's directions
A vector's components are tied to directions, and on a map those directions are the projection's own. On EPSG:5070, a conic projection centred on 96°W, the meridians fan out from a point above the map, so north tilts left in the east and right in the west. A wind drawn with its raw components ignores this and is turned by the local convergence, about 17° at the edges of the contiguous United States and more on maps that reach further from the central meridian.
The general fix is to express the wind in the map's local axes. Projecting a point and its neighbours a short distance east and north gives the map vectors of one metre east and one metre north, and the wind is their weighted sum. This works for any projection, conformal or not, and needs nothing but pyproj. Plotting libraries with map projections built in, such as Cartopy's transform_vectors, do the same thing internally.
Grid-relative input, poles and plate carrée
- Grid-relative input: rotate HRRR-style grid-relative winds to earth-relative first, then to the map.
- Speed on the map: on an equal-area map the arrow length also changes slightly with the local scale; normalise if lengths must match speeds exactly.
- Poles: near the pole of a polar stereographic map the convergence approaches 180°; the finite-difference method still works.
- Step size: 0.01° is small enough for any national map; near the poles or the dateline use a smaller step and handle wrap-around.
- Plate carrée: on a plain longitude-latitude plot east is right and north is up, so no rotation is needed.
Internal links
- Why are my HRRR wind directions wrong? — the grid-relative rotation, the other way round
- How to draw a wind arrow map in Python — arrow density, scale and keys
FAQ
Why do wind arrows point the wrong way on my projected map?
u and v are east and north components; on a projected map those directions are rotated, so the vectors must be turned before plotting.
How do I rotate wind vectors to a map projection in Python?
Project each point and two nearby points, one east and one north, with pyproj; the differences give the map's east and north directions, and u·east + v·north is the arrow.
What is meridian convergence?
The angle between true north and the map's grid north at a point; pyproj returns it from Proj(crs).get_factors(lon, lat).meridian_convergence.
Do I need to rotate winds on a plate carrée map?
No; on a longitude-latitude grid east is along x and north along y everywhere.