
How to Find Where Bank Branches Closed Between 2015 and 2025
On this page
Problem statement
American banks closed thousands of branches in the decade to 2025, and the Summary of Deposits lets every closure be traced, because each office keeps its FDIC id, UNINUMBR, for as long as it exists, even through a merger. Comparing the 2015 and 2025 surveys by that id separates offices that closed from those that opened, shows which banks closed most, and maps the net change by county. This page does that, and checks whether rural or metropolitan counties lost more.
Quick answer
Find the 2015 offices whose id is missing from 2025, and the reverse:
old = read_sod(2015)
gone = old[~old.UNINUMBR.isin(sod.UNINUMBR)]
new = sod[~sod.UNINUMBR.isin(old.UNINUMBR)]
print(f"2015 offices: {len(old):,}; 2025: {len(sod):,}; net {len(sod) - len(old):+,}")
print(f"offices of 2015 not in 2025: {len(gone):,}; offices of 2025 not in 2015: {len(new):,}")
2015 offices: 93,272; 2025: 76,097; net -17,175
offices of 2015 not in 2025: 26,652; offices of 2025 not in 2015: 9,477
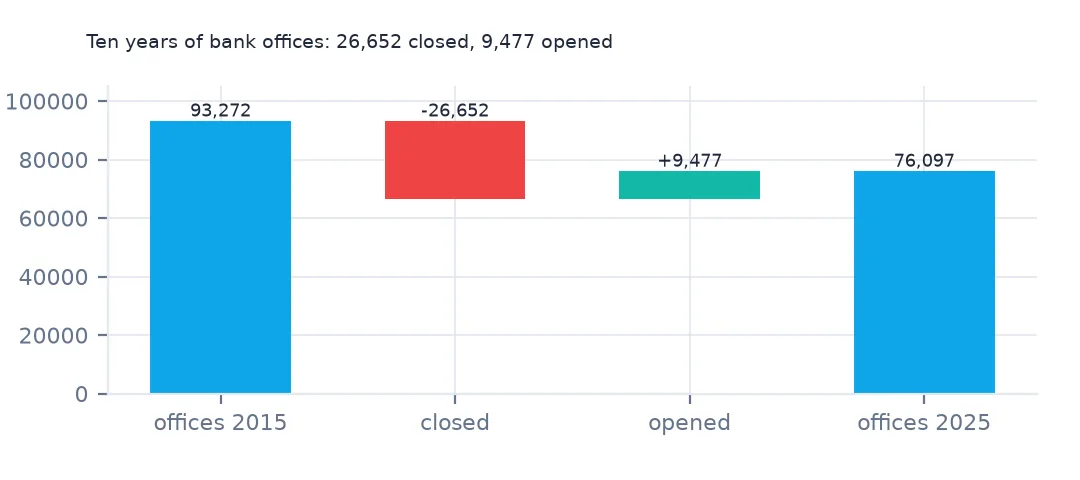
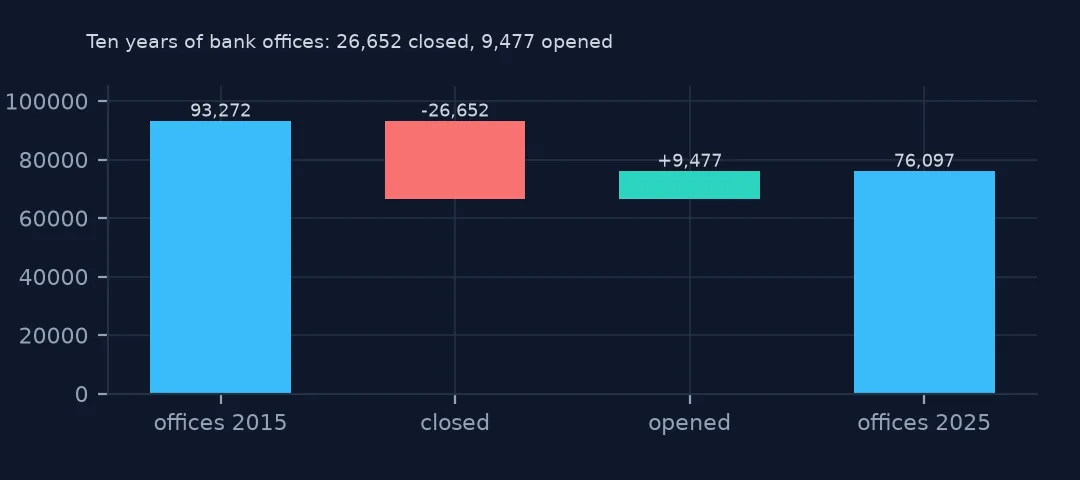
The 2015 survey has 93,272 offices and the 2025 survey 76,097, a net loss of 17,175. Underneath, 26,652 offices of 2015 are gone and 9,477 offices of 2025 are new, so the churn was more than twice the net change: banks closed more than one office in four and opened replacements elsewhere.
Who closed, what and where
1. Who closed them
k = gone.groupby("NAMEFULL").size().sort_values(ascending=False)
print(k.head(6).to_string())
o = gone[gone.CERT.isin(sod.CERT)]
print(f"closed by banks still filing in 2025: {len(o):,} ({len(o) / len(gone):.1%}); by banks gone since 2015: {len(gone) - len(o):,}")
NAMEFULL
Wells Fargo Bank, National Association 2113
JPMorgan Chase Bank, National Association 1836
Bank of America, National Association 1541
U.S. Bank National Association 1399
PNC Bank, National Association 1135
Branch Banking and Trust Company 916
closed by banks still filing in 2025: 19,175 (71.9%); by banks gone since 2015: 7,477
The largest banks closed the most: Wells Fargo 2,113 offices, JPMorgan Chase 1,836, Bank of America 1,541, U.S. Bank 1,399 and PNC 1,135. Branch Banking and Trust's 916 are mostly offices that closed after its merger with SunTrust into Truist. 71.9% of the closed offices belonged to banks still filing in 2025; the other 7,477 belonged to banks that have since merged or failed. Offices that passed to a new owner in a merger keep their id and are not counted as closed.
2. Which kind of office
print(pd.concat({"2015": old.BRSERTYP.value_counts(), "gone": gone.BRSERTYP.value_counts(), "2025": sod.BRSERTYP.value_counts()}, axis=1).fillna(0).astype(int).loc[[11, 12, 13, 21, 23]].to_string()) 2015 gone 2025
BRSERTYP
11 84305 21724 71242
12 5261 3031 2388
13 179 56 182
21 307 158 287
23 2448 1278 1449
Most closures were ordinary branches: 21,724 of the 84,305 brick-and-mortar branches of 2015 are gone. Drive-throughs and retail offices fell faster in proportion, 1,278 of 2,448 and 3,031 of 5,261, as banks gave up stand-alone drive-up windows and supermarket branches. Home-banking offices are the only type that grew slightly.
3. Net change by county
c = pd.concat({"y2015": old.groupby("STCNTYBR").size(), "y2025": sod.groupby("STCNTYBR").size()}, axis=1).fillna(0)
c["change"] = (c.y2025 - c.y2015) / c.y2015
print(f"counties that lost branches: {(c.y2025 < c.y2015).sum():,}; gained: {(c.y2025 > c.y2015).sum():,}; lost every branch: {((c.y2015 > 0) & (c.y2025 == 0)).sum()}")
print(c[c.y2015 >= 50].change.describe(percentiles=[0.1, 0.5, 0.9]).round(3).to_string())
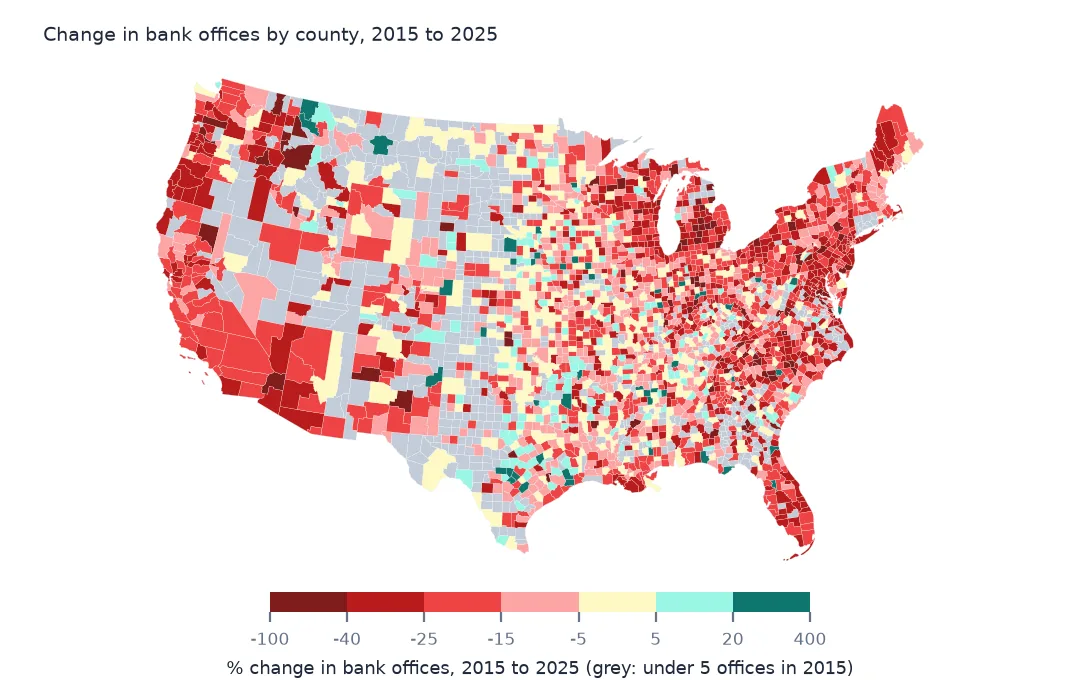
counties that lost branches: 2,065; gained: 284; lost every branch: 23
count 380.000
mean -0.206
std 0.148
min -1.000
10% -0.329
50% -0.207
90% -0.054
max 0.144
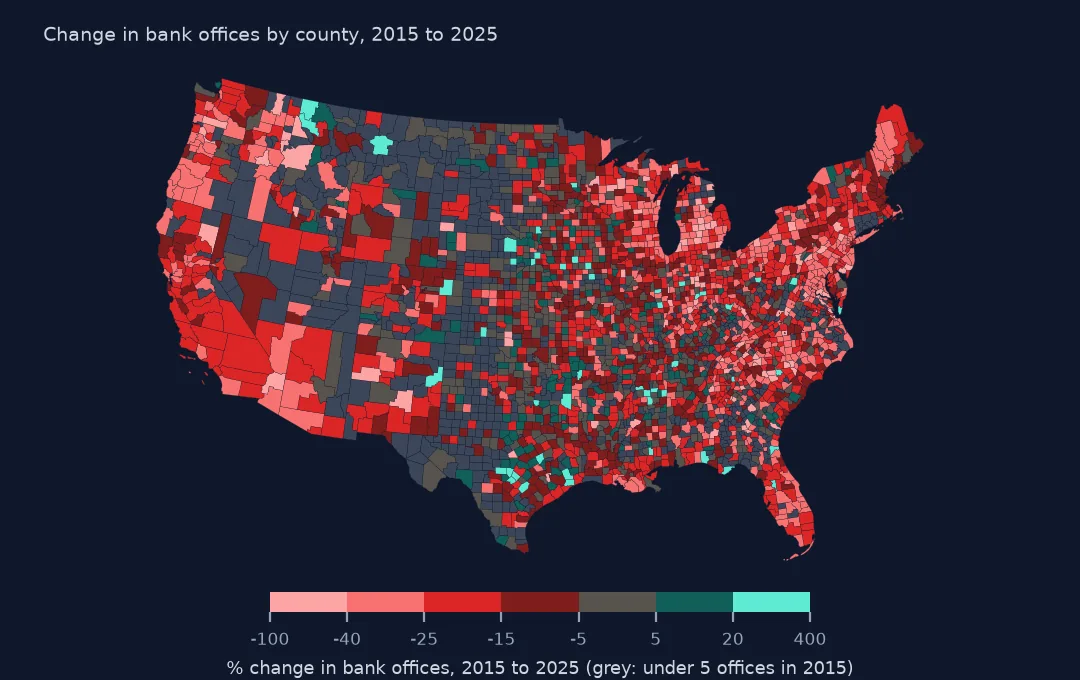
2,065 counties lost branches over the decade and only 284 gained; 23 counties lost every branch they had. Among counties with at least 50 branches in 2015, the median lost 20.7%, and nine in ten lost at least 5.4%. Closures were near universal, not concentrated in a few places.
Metropolitan and other counties
The data used on this page
The FDIC's Summary of Deposits for 2015 and 2025, every office of every FDIC-insured institution with its deposits as of 30 June, from the BankFind Suite API, downloaded on 28 October 2026 and saved on this site, because banks amend past reports and the API serves the revised figures. Public domain. Deposits are reported in thousands of dollars.
from pathlib import Path
import zipfile

import geopandas as gpd
import numpy as np
import pandas as pd
import requests

Path("data").mkdir(exist_ok=True)
# FDIC Summary of Deposits for 2015 and 2025 (every branch, deposits as of 30 June) from the BankFind Suite API, with
# the Census Bureau's 2024 county population estimates, 2020 tract centres of population, counties and states.
# Saved 28 October 2026: the API serves revised years as banks amend their reports.
# Live: https://api.fdic.gov/banks/sod?filters=YEAR:2025&limit=10000&offset=0
ARCHIVE = "fdic-sod-2026-10-28.zip"
if not Path(f"data/{ARCHIVE}").exists():
    Path(f"data/{ARCHIVE}").write_bytes(requests.get(f"https://data.spatialworkflow.io/{ARCHIVE}", timeout=600).content)
Z = zipfile.ZipFile(f"data/{ARCHIVE}")
for f in ["cb_2024_us_county_20m.zip", "cb_2024_us_state_20m.zip"]:
    Path(f"data/{f}").write_bytes(Z.read(f))
def read_sod(year):
    d = pd.read_csv(Z.open(f"fdic-sod-{year}.csv"), dtype={"ZIPBR": str})
    d["STCNTYBR"] = d.STCNTYBR.astype(str).str.zfill(5)          # county FIPS, stored as a number
    d["deposits"] = d.DEPSUMBR * 1000                              # reported in thousands of dollars
    return d
sod = read_sod(2025)
print(f"FDIC Summary of Deposits 2025: {len(sod):,} offices, ${sod.deposits.sum() / 1e12:,.2f} trillion in deposits")
FDIC Summary of Deposits 2025: 76,097 offices, $18.10 trillion in deposits
Example 1: urban and rural counties
metro = sod.drop_duplicates("STCNTYBR").set_index("STCNTYBR").METROBR.reindex(c.index).fillna(old.drop_duplicates("STCNTYBR").set_index("STCNTYBR").METROBR)
t = c.groupby(metro.map({1: "metropolitan", 0: "not metropolitan"}))[["y2015", "y2025"]].sum()
t["change"] = (t.y2025 / t.y2015 - 1).round(3)
print(t.astype({"y2015": int, "y2025": int}).to_string())
y2015 y2025 change
METROBR
metropolitan 73665 59524 -0.192
not metropolitan 19607 16573 -0.155
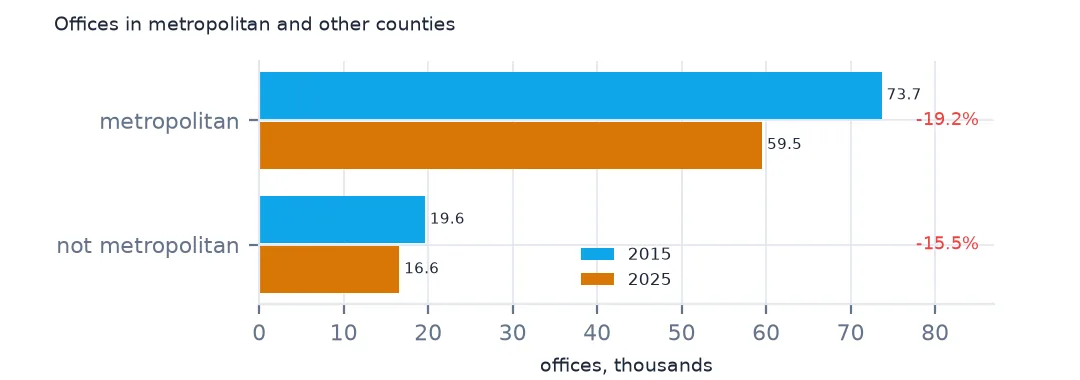
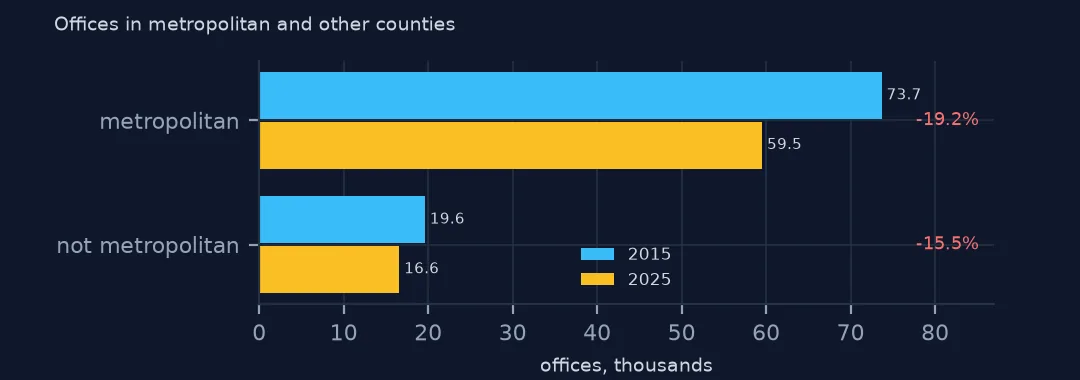
Metropolitan counties lost 19.2% of their offices, from 73,665 to 59,524, and non-metropolitan counties 15.5%, from 19,607 to 16,573. In proportion the cities lost more. But a closure in a small town may leave no branch within reach, while in a city the next one is a few blocks away, which is why the deserts page measures distance instead.
Internal links
- Bank deserts — the neighbourhoods closures left far from a branch
- Branches per resident — the map today
- The largest banks — how their networks changed
- Branch service types — which offices were lost