
How to Map Bank Branches per Resident by County
On this page
Problem statement
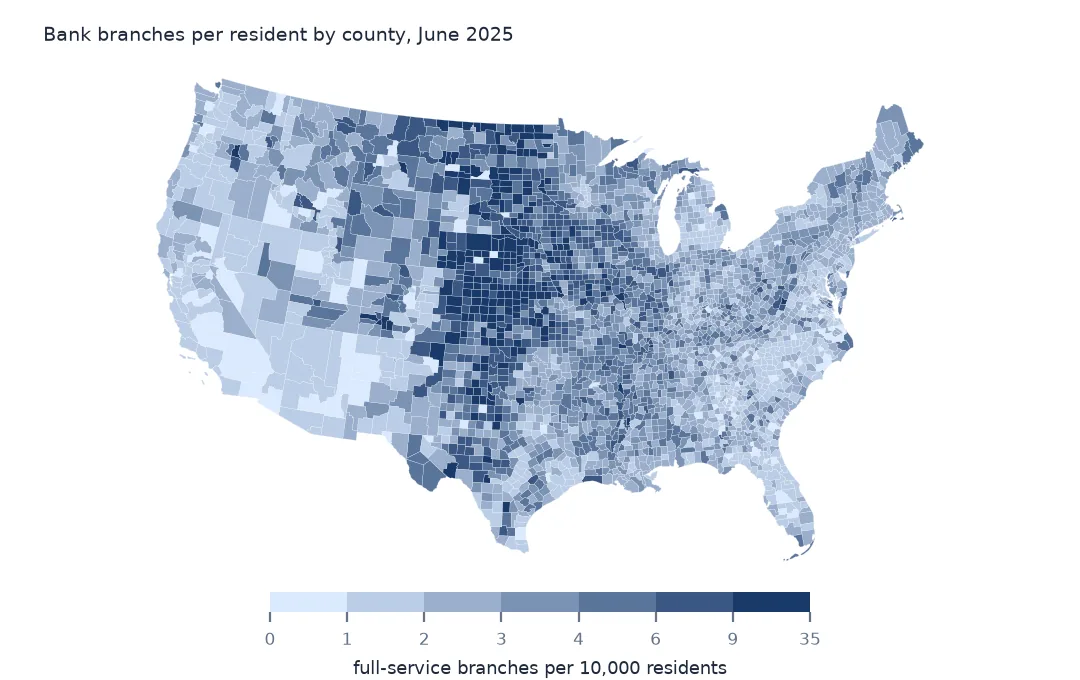
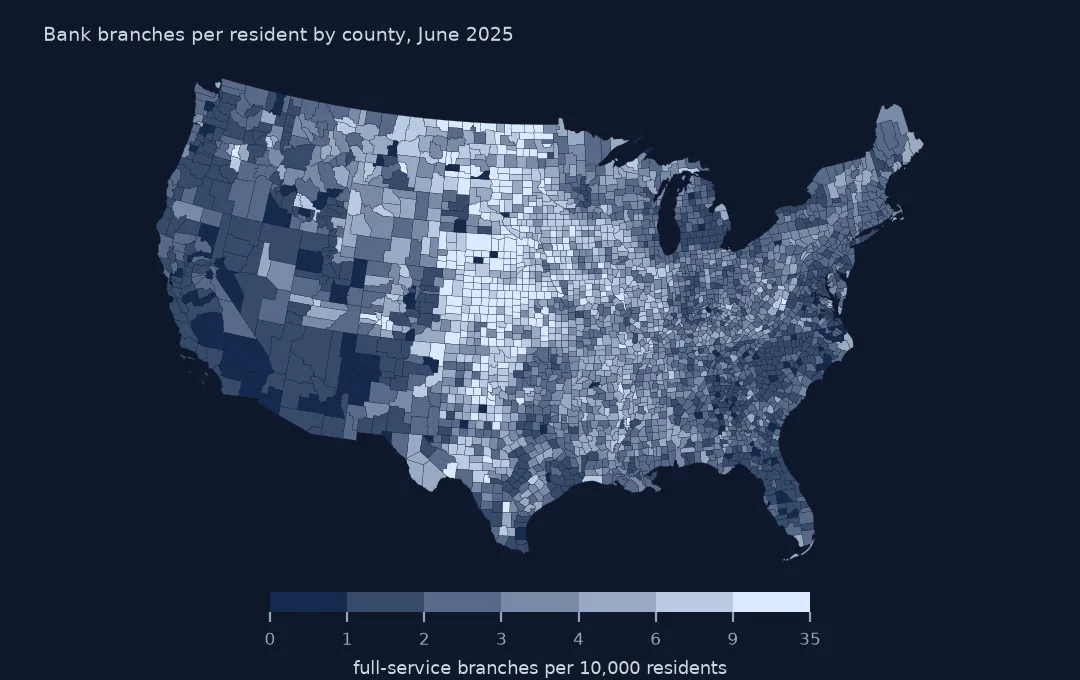
Branches per resident is the simplest measure of how well a place is served by banks, and a county map of it overturns the usual expectation: the rural Plains have far more branches per person than the big cities. Building it needs three decisions: which offices count as branches, which population estimate to divide by, and what to do with the branch county codes that have no population, which are the territories and Connecticut's new planning regions. This page counts full-service branches per 10,000 residents for every county, lists the extremes, and compares states and county sizes.
Quick answer
Count full-service branches per county, join the Census Bureau's 2024 estimates and divide:
pop = pd.read_csv(Z.open("co-est2024-alldata.csv"), encoding="latin-1", dtype={"STATE": str, "COUNTY": str})
pop = pop[pop.SUMLEV == 50].assign(GEOID=lambda d: d.STATE + d.COUNTY).set_index("GEOID").POPESTIMATE2024
full = sod[sod.BRSERTYP.isin([11, 12])]
per = full.groupby("STCNTYBR").size().rename("branches").to_frame().join(pop.rename("pop"), how="outer").fillna({"branches": 0})
per["per_10k"] = per.branches / per["pop"] * 1e4
print(f"counties: {per['pop'].notna().sum():,}; with no full-service branch: {(per.branches == 0).sum()}")
print(per.per_10k.describe(percentiles=[0.1, 0.5, 0.9]).round(2).to_string())
counties: 3,144; with no full-service branch: 41
count 3144.00
mean 3.92
std 3.20
min 0.00
10% 1.44
50% 2.95
90% 7.52
max 34.32
Across 3,144 counties the median has 2.95 full-service branches per 10,000 residents; a tenth have fewer than 1.44 and a tenth more than 7.52. 41 counties have no full-service branch at all. The highest rate, 34.32, belongs to a county of under a thousand people with three branches, which is why the extremes are better read among larger counties.
The extremes, the gaps and the states
1. The counties at each end
names = pd.read_csv(Z.open("co-est2024-alldata.csv"), encoding="latin-1", dtype={"STATE": str, "COUNTY": str}).query("SUMLEV == 50").assign(GEOID=lambda d: d.STATE + d.COUNTY).set_index("GEOID")[["CTYNAME", "STNAME"]]
big = per[per["pop"] >= 10_000].join(names)
print(big.nlargest(4, "per_10k")[["CTYNAME", "STNAME", "branches", "pop", "per_10k"]].round(2).to_string())
print(big.nsmallest(4, "per_10k")[["CTYNAME", "STNAME", "branches", "pop", "per_10k"]].round(2).to_string())
CTYNAME STNAME branches pop per_10k
STCNTYBR
19109 Kossuth County Iowa 18.0 14408.0 12.49
31041 Custer County Nebraska 12.0 10487.0 11.44
20131 Nemaha County Kansas 11.0 10062.0 10.93
31089 Holt County Nebraska 11.0 10120.0 10.87
CTYNAME STNAME branches pop per_10k
STCNTYBR
01037 Coosa County Alabama 0.0 10291.0 0.00
46102 Oglala Lakota County South Dakota 0.0 13360.0 0.00
49045 Tooele County Utah 3.0 84488.0 0.36
06115 Yuba County California 4.0 87469.0 0.46
Among counties of 10,000 people or more, the most branches per resident are in the farm counties of Iowa, Nebraska and Kansas: Kossuth County, Iowa, has 18 branches for 14,408 people, 12.49 per 10,000. At the other end, Coosa County, Alabama, and Oglala Lakota County, South Dakota, home of the Pine Ridge Reservation, have none, and Tooele County, Utah, and Yuba County, California, on the edges of the Salt Lake City and Sacramento areas, have under 0.5.
2. Codes that do not join
nojoin = set(full.STCNTYBR) - set(pop.index)
print(f"branch county codes with no population: {len(nojoin)}: {sorted(nojoin)[:6]}")
print(full[full.STCNTYBR.isin(nojoin)].STALPBR.value_counts().to_dict())
branch county codes with no population: 90: ['09009', '64002', '64005', '64040', '64060', '66010']
{'PR': 257, 'VI': 20, 'GU': 15, 'FM': 8, 'MP': 5, 'PW': 3, 'MH': 1, 'CT': 1}
90 branch county codes have no population row. Most are the territories and freely associated states, Puerto Rico above all, which the county estimates do not cover; one Connecticut branch still carries code 09009, New Haven County, which the 2024 estimates replace with planning regions. Join Puerto Rico from the municipio estimates, and map Connecticut's old codes to regions, or leave both out and say so.
3. By state
fips_to_st = full.assign(fp=full.STCNTYBR.str[:2]).drop_duplicates("fp").set_index("fp").STALPBR
stpop = pop.groupby(pop.index.str[:2]).sum().rename(index=fips_to_st)
st = (full.groupby("STALPBR").size() / stpop * 1e4).dropna()
print(st.sort_values().round(2).iloc[[0, 1, 2, -3, -2, -1]].to_string())
STALPBR
NV 1.20
AZ 1.26
CA 1.37
SD 4.55
NE 4.75
ND 4.93
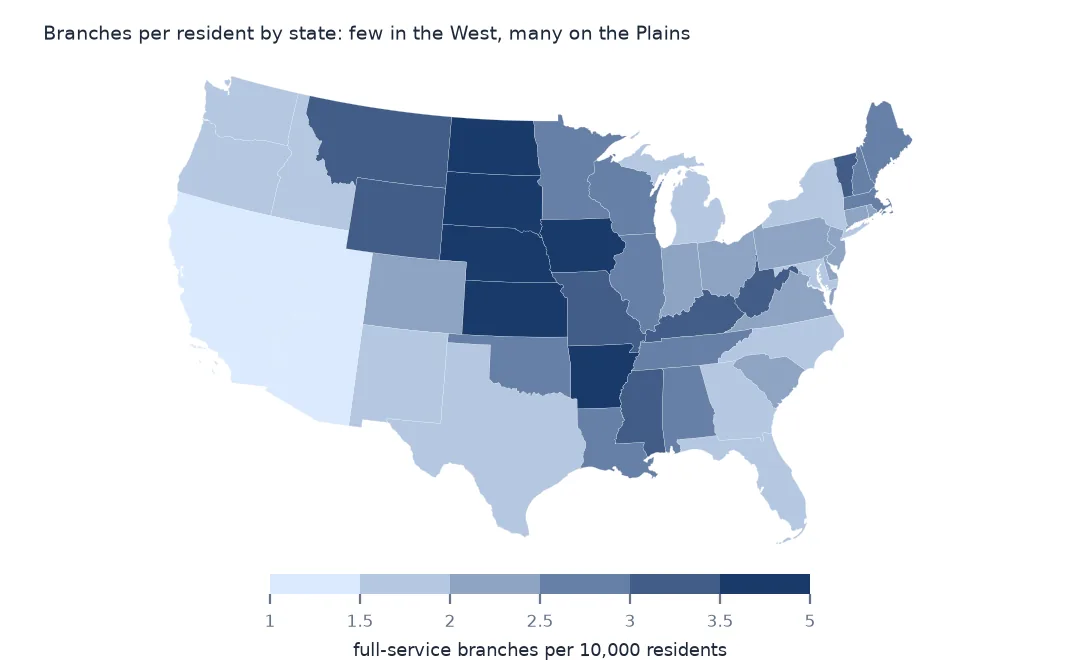
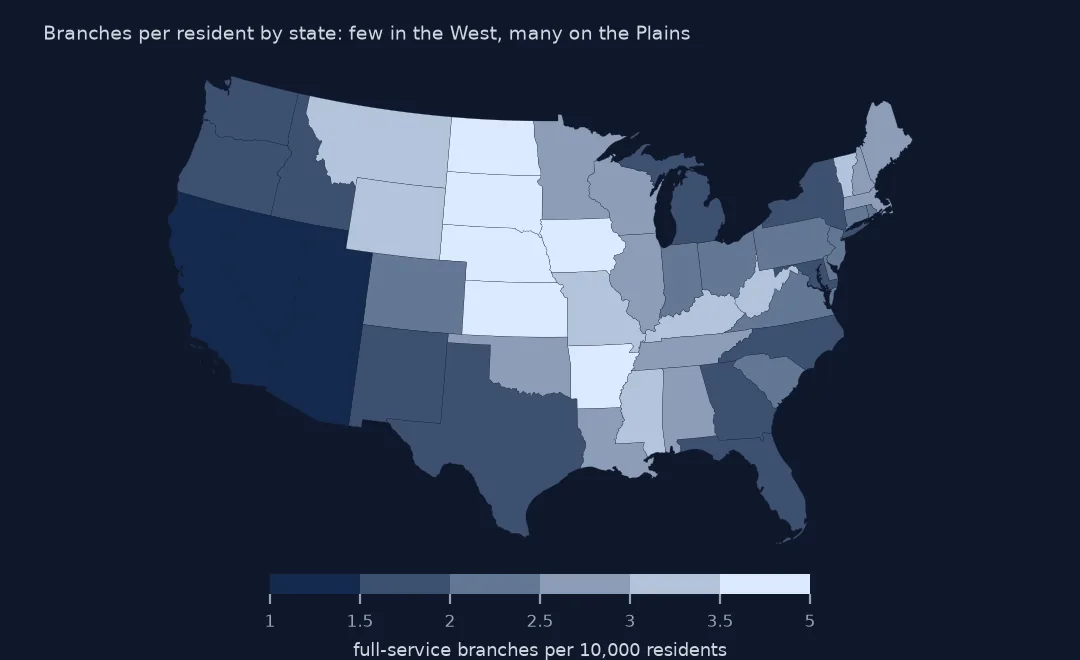
By state, Nevada has the fewest full-service branches per resident, 1.20 per 10,000, then Arizona and California, the fast-growing West. South Dakota, Nebraska and North Dakota have the most, about four times as many. The Plains states kept many small community banks, each with a few branches in small towns.
Branches per resident against population
The data used on this page
The FDIC's Summary of Deposits for 2015 and 2025, every office of every FDIC-insured institution with its deposits as of 30 June, from the BankFind Suite API, downloaded on 28 October 2026 and saved on this site, because banks amend past reports and the API serves the revised figures. Public domain. Deposits are reported in thousands of dollars. County populations are the Census Bureau's Vintage 2024 estimates, tract centres of population its 2020 census file, and boundaries its 2024 cartographic files, all public domain.
from pathlib import Path
import zipfile

import geopandas as gpd
import numpy as np
import pandas as pd
import requests

Path("data").mkdir(exist_ok=True)
# FDIC Summary of Deposits for 2015 and 2025 (every branch, deposits as of 30 June) from the BankFind Suite API, with
# the Census Bureau's 2024 county population estimates, 2020 tract centres of population, counties and states.
# Saved 28 October 2026: the API serves revised years as banks amend their reports.
# Live: https://api.fdic.gov/banks/sod?filters=YEAR:2025&limit=10000&offset=0
ARCHIVE = "fdic-sod-2026-10-28.zip"
if not Path(f"data/{ARCHIVE}").exists():
    Path(f"data/{ARCHIVE}").write_bytes(requests.get(f"https://data.spatialworkflow.io/{ARCHIVE}", timeout=600).content)
Z = zipfile.ZipFile(f"data/{ARCHIVE}")
for f in ["cb_2024_us_county_20m.zip", "cb_2024_us_state_20m.zip"]:
    Path(f"data/{f}").write_bytes(Z.read(f))
def read_sod(year):
    d = pd.read_csv(Z.open(f"fdic-sod-{year}.csv"), dtype={"ZIPBR": str})
    d["STCNTYBR"] = d.STCNTYBR.astype(str).str.zfill(5)          # county FIPS, stored as a number
    d["deposits"] = d.DEPSUMBR * 1000                              # reported in thousands of dollars
    return d
sod = read_sod(2025)
print(f"FDIC Summary of Deposits 2025: {len(sod):,} offices, ${sod.deposits.sum() / 1e12:,.2f} trillion in deposits")
FDIC Summary of Deposits 2025: 76,097 offices, $18.10 trillion in deposits
Example 1: branches per resident against population
from scipy.stats import spearmanr
b = per.dropna(subset=["pop"])
r = spearmanr(b["pop"], b.per_10k)
print(f"rank correlation of population with branches per 10,000: {r.statistic:.2f}")
print(b.groupby(pd.cut(b["pop"], [0, 10_000, 50_000, 250_000, 1e7])).per_10k.median().round(2).to_string())
rank correlation of population with branches per 10,000: -0.56
pop
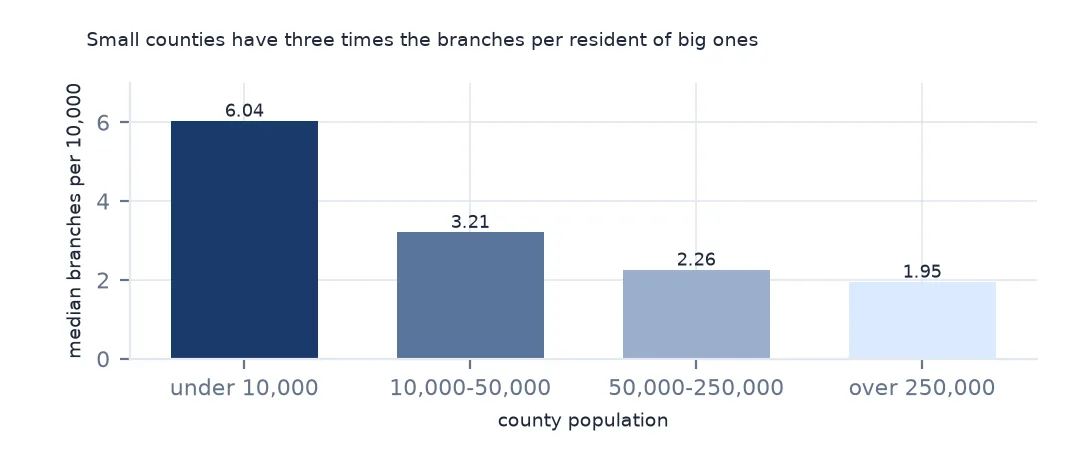
(0.0, 10000.0] 6.04
(10000.0, 50000.0] 3.21
(50000.0, 250000.0] 2.26
(250000.0, 10000000.0] 1.95
The rank correlation between county population and branches per resident is -0.56: the smaller the county, the more branches per person. Counties under 10,000 people have a median of 6.04, those over 250,000 a median of 1.95. Per-resident counts reward many small branches in small towns; they say nothing about how far people travel, which the bank deserts page measures.
Internal links
- Bank deserts — distance to a branch, which per-resident counts miss
- Branch closures since 2015 — how the map has changed
- Branch service types — why only full-service offices are counted
- Reading the survey — the county codes