
How to Map Median Broadband Download Speed by County
On this page
Problem statement
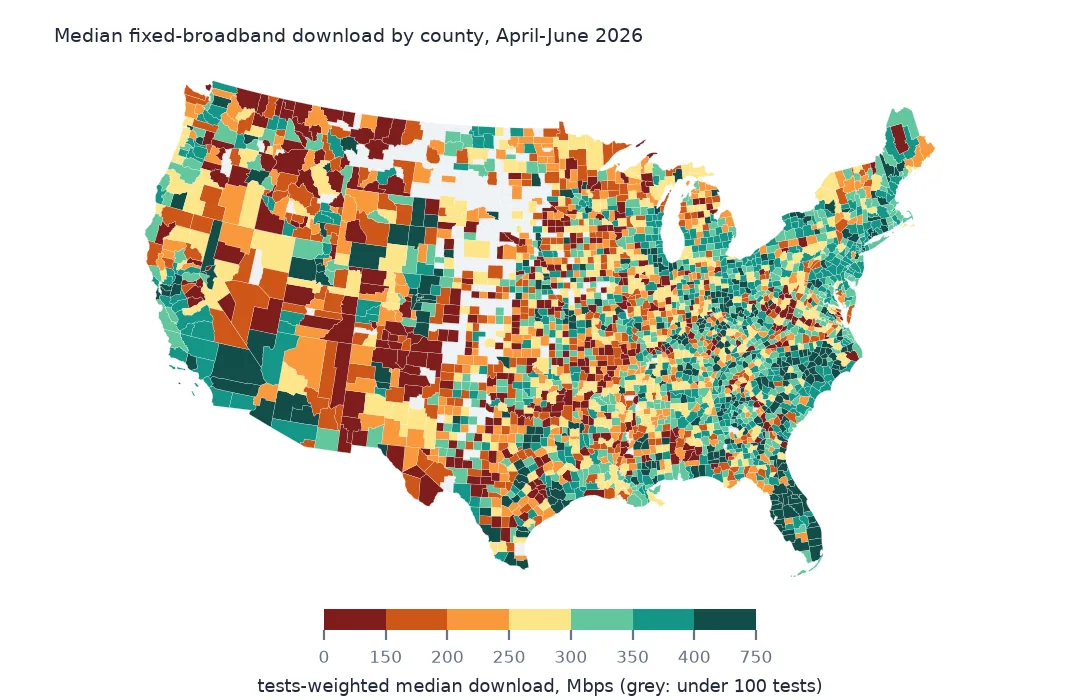
Which US counties have the fastest home internet and which the slowest? Ookla's open Speedtest tiles can answer it for every county in the lower 48, once the tiles are joined to counties and averaged correctly. That means weighting by tests, flagging counties with too few, and choosing whether to map a median speed or the share of tests above a benchmark. This page maps the tests-weighted median fixed-broadband download for April–June 2026 and ranks the fastest and slowest counties.
Quick answer
Join tile centres to county polygons, compute each county's tests-weighted median of avg_d_kbps (divided by 1,000 for Mbps), and drop or mark counties with fewer than 100 tests. Use quantile classes for the map.
by = fixed.groupby("GEOID").apply(lambda g: pd.Series({"tests": g.tests.sum(), "mbps": wmedian(g.avg_d_kbps, g.tests) / 1000}), include_groups=False)
m = counties.merge(by, left_on="GEOID", right_index=True, how="left")
print(f"counties with tests: {m.mbps.notna().sum():,} of {len(m):,}; median of county medians {m.mbps.median():.0f} Mbps; range {m.mbps.min():.0f} to {m.mbps.max():.0f}")
counties with tests: 3,108 of 3,109; median of county medians 285 Mbps; range 7 to 724
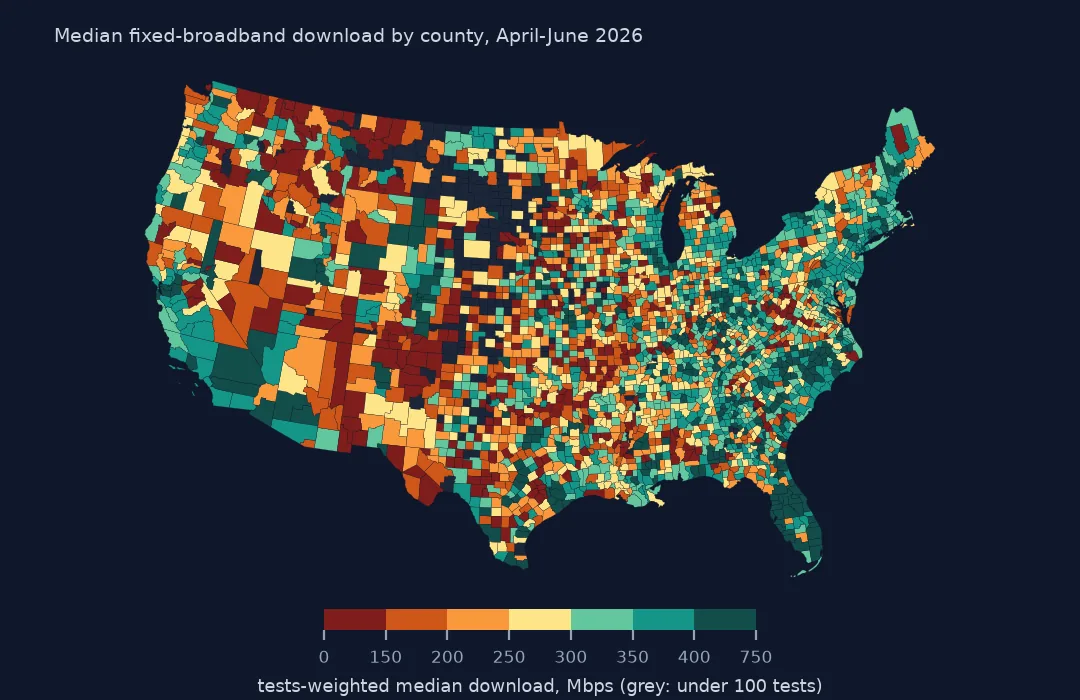
3,108 of 3,109 counties have tests. The median county's median is 285 Mbps, lower than the national figure because small rural counties count once each, and county medians range from 7 to 724 Mbps.
Weighting, thin counties and rankings
1. Weight by tests
one = fixed[fixed.GEOID == by.tests.idxmax()]
print(f"busiest county {m.set_index('GEOID').loc[by.tests.idxmax(), 'NAME']}: plain median of tiles {one.avg_d_kbps.median() / 1000:.0f} Mbps, tests-weighted {wmedian(one.avg_d_kbps, one.tests) / 1000:.0f} Mbps")
busiest county Los Angeles: plain median of tiles 379 Mbps, tests-weighted 395 Mbps
In Los Angeles County, the busiest, the plain median of tile averages is 379 Mbps and the tests-weighted median 395. Weighting usually raises the figure, because busy urban tiles are faster than the many one-test tiles.
2. Mark thin counties
print(f"counties with fewer than 100 tests: {(m.tests < 100).sum()}; fewer than 30: {(m.tests < 30).sum()}")counties with fewer than 100 tests: 201; fewer than 30: 54
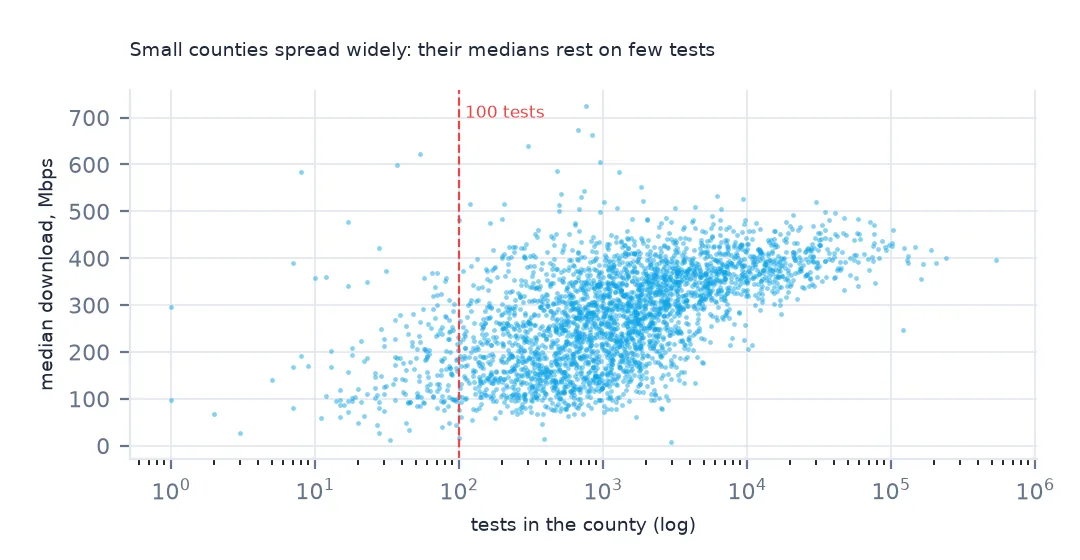
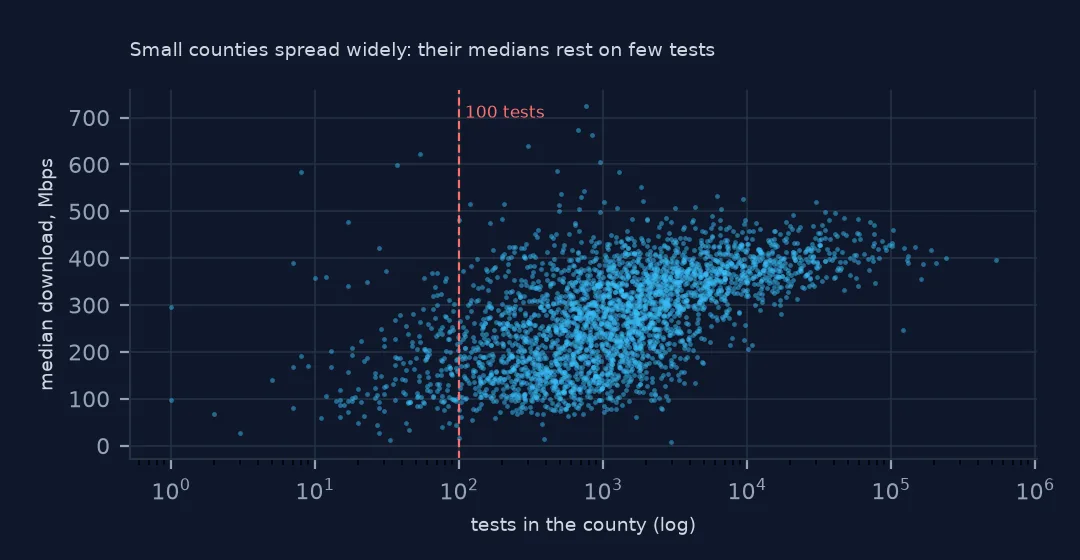
201 counties have fewer than 100 tests and 54 fewer than 30. Those are left grey on the map here rather than coloured from a handful of tests.
3. Fastest and slowest
ok = m[m.tests >= 100].sort_values("mbps")
print("slowest:", ok.head(4)[["NAME", "STUSPS", "tests", "mbps"]].round(0).to_dict("records"))
print("fastest:", ok.tail(4)[["NAME", "STUSPS", "tests", "mbps"]].round(0).to_dict("records"))
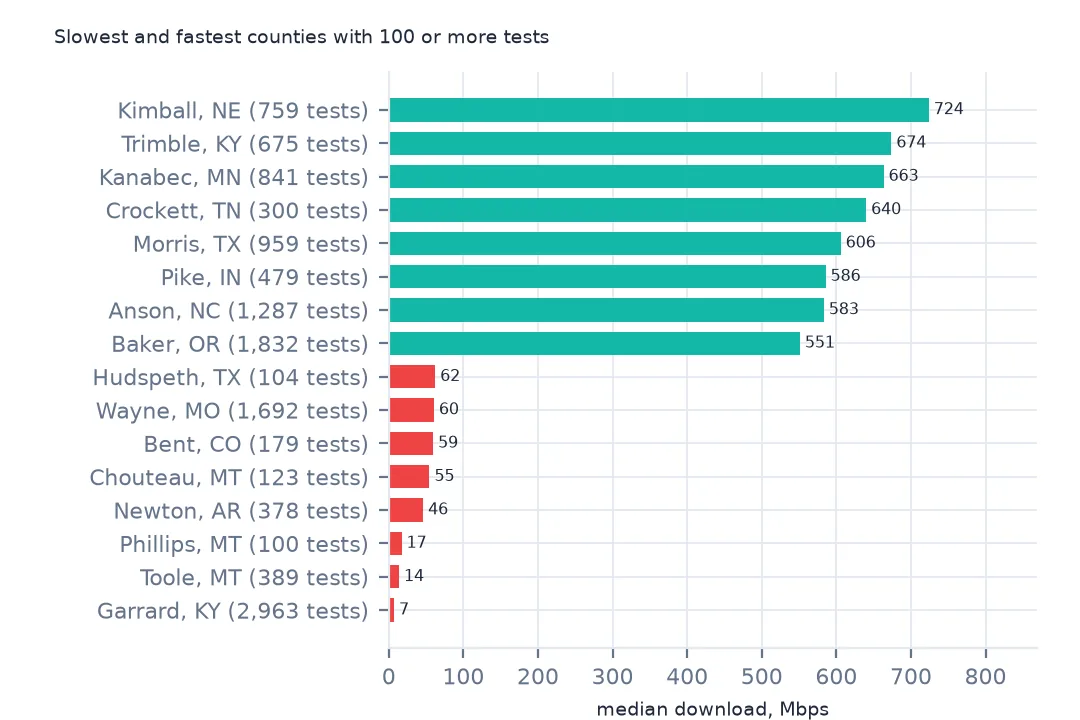
slowest: [{'NAME': 'Garrard', 'STUSPS': 'KY', 'tests': 2963.0, 'mbps': 7.0}, {'NAME': 'Toole', 'STUSPS': 'MT', 'tests': 389.0, 'mbps': 14.0}, {'NAME': 'Phillips', 'STUSPS': 'MT', 'tests': 100.0, 'mbps': 17.0}, {'NAME': 'Newton', 'STUSPS': 'AR', 'tests': 378.0, 'mbps': 46.0}]
fastest: [{'NAME': 'Crockett', 'STUSPS': 'TN', 'tests': 300.0, 'mbps': 640.0}, {'NAME': 'Kanabec', 'STUSPS': 'MN', 'tests': 841.0, 'mbps': 663.0}, {'NAME': 'Trimble', 'STUSPS': 'KY', 'tests': 675.0, 'mbps': 674.0}, {'NAME': 'Kimball', 'STUSPS': 'NE', 'tests': 759.0, 'mbps': 724.0}]
The slowest county with 100 or more tests is Garrard County, Kentucky, at 7 Mbps on 2,963 tests, followed by Toole and Phillips in Montana and Newton County, Arkansas. The fastest include Kimball County, Nebraska (724 Mbps), Trimble County, Kentucky and Kanabec County, Minnesota, small rural counties rather than big cities.
The 100 Mbps share and states
The data used on this page
Ookla's Speedtest open data performance tiles for fixed broadband (April–June 2026), read from Amazon S3, and Census Bureau 2023 county boundaries.
from pathlib import Path

import duckdb
import geopandas as gpd
import numpy as np
import pandas as pd
import requests

Path("data").mkdir(exist_ok=True)
# Ookla Speedtest open data (AWS Open Data, keyless): one Parquet file per quarter and network type, zoom-16 web
# Mercator tiles with average speeds, latency, tests and devices. Published quarterly under fixed names.
BASE = "https://ookla-open-data.s3.amazonaws.com/parquet/performance"


def tiles(kind, year, q):
    """One quarter's tiles inside a box around the contiguous US, cached locally as Parquet."""
    path = f"data/ookla-{kind}-{year}q{q}-conus.parquet"
    if not Path(path).exists():
        url = f"{BASE}/type={kind}/year={year}/quarter={q}/{year}-{(q - 1) * 3 + 1:02d}-01_performance_{kind}_tiles.parquet"
        con = duckdb.connect()
        con.sql("INSTALL httpfs; LOAD httpfs;")
        con.sql(f"""COPY (SELECT quadkey, tile_x, tile_y, avg_d_kbps, avg_u_kbps, avg_lat_ms, avg_lat_down_ms, avg_lat_up_ms, tests, devices
                         FROM read_parquet('{url}') WHERE tile_x BETWEEN -125 AND -66 AND tile_y BETWEEN 24 AND 50
                         ORDER BY quadkey) TO '{path}' (FORMAT parquet)""")
    return pd.read_parquet(path)


for name in ["cb_2023_us_county_20m.zip"]:
    if not Path(f"data/{name}").exists():
        Path(f"data/{name}").write_bytes(requests.get(f"https://www2.census.gov/geo/tiger/GENZ2023/shp/{name}", timeout=300).content)
counties = gpd.read_file("data/cb_2023_us_county_20m.zip")
counties = counties[~counties.STUSPS.isin(["AK", "HI", "PR"])].to_crs(4326)


def in_counties(df):
    """Attach the county each tile's centre falls in; tiles outside the lower 48 (Canada, Mexico, sea) drop out."""
    pts = gpd.GeoDataFrame(df, geometry=gpd.points_from_xy(df.tile_x, df.tile_y), crs=4326)
    j = gpd.sjoin(pts, counties[["GEOID", "STUSPS", "NAME", "geometry"]], predicate="within")
    return pd.DataFrame(j.drop(columns=["geometry", "index_right"]))


def wmedian(values, weights):
    """Median of tile averages, each tile counted once per test."""
    o = np.argsort(values.to_numpy())
    v, w = values.to_numpy()[o], weights.to_numpy()[o]
    c = np.cumsum(w)
    return v[np.searchsorted(c, c[-1] / 2)]


fixed = in_counties(tiles("fixed", 2026, 2))
print(f"Ookla fixed broadband, April-June 2026: {len(fixed):,} tiles in the lower 48, {fixed.tests.sum():,} tests")
Ookla fixed broadband, April-June 2026: 1,548,841 tiles in the lower 48, 15,134,971 tests
Example 1: share of tests meeting 100 Mbps
fixed["fast"] = fixed.avg_d_kbps >= 100_000
sh = fixed.groupby("GEOID").apply(lambda g: (g.fast * g.tests).sum() / g.tests.sum(), include_groups=False)
print(f"counties where at least half of tests are in tiles averaging 100 Mbps or more: {(sh >= 0.5).mean():.1%}")
counties where at least half of tests are in tiles averaging 100 Mbps or more: 95.8%
In 95.8% of counties, at least half of tests are in tiles averaging 100 Mbps or more, the FCC's current download benchmark. The benchmark shows where fast service exists, not that every household has it.
Example 2: by state
s = m[m.tests >= 100].groupby("STUSPS").mbps.median().sort_values()
print("state median of county medians, lowest:", s.head(4).round(0).to_dict(), "highest:", s.tail(4).round(0).to_dict())
state median of county medians, lowest: {'MT': 180.0, 'ID': 183.0, 'NM': 203.0, 'AZ': 215.0} highest: {'NJ': 366.0, 'DE': 374.0, 'FL': 396.0, 'CT': 405.0}
By state, the median county is slowest in Montana (180 Mbps), Idaho, New Mexico and Arizona, large western states with many sparse counties, and fastest in Connecticut (405 Mbps), Florida, Delaware and New Jersey.
What a county median speed shows
A county's median is the speed of the median test run there, so it reflects the plans people buy and the technology available: fibre and cable in towns, DSL, fixed wireless and satellite in the countryside. Counties at the bottom are typically served by old copper or satellite, and counties at the top by recent fibre builds, which in rural America are often co-operatives or projects funded by federal grants. The ranking changes quarter to quarter as networks are built, and quickly in small counties where one new fibre network moves the median.
Map details
- Use a minimum test count; 100 a quarter is used here, and 54 counties have fewer than 30.
- Classes: speeds are skewed, so quantile classes work better than equal intervals.
- Upload matters for video calls and is far lower on cable and DSL; map it too.
- The tile centre decides the county, so a few tiles on borders land on the other side.
Internal links
- Average internet speed comes out wrong — weighting by tests
- Empty Speedtest tiles — what absence means
- How to measure the urban-rural broadband gap — density classes
FAQ
Which US county has the slowest internet?
Among counties with at least 100 fixed-broadband tests in April–June 2026, Garrard County, Kentucky, with a tests-weighted median of 7 Mbps.
What is the median internet speed of a US county?
The median of county medians is 285 Mbps for fixed broadband in April–June 2026, against 381.2 Mbps nationally weighted by tests.