
Average Internet Speed Comes Out Wrong: Weight Tile Averages by Tests
On this page
Problem statement
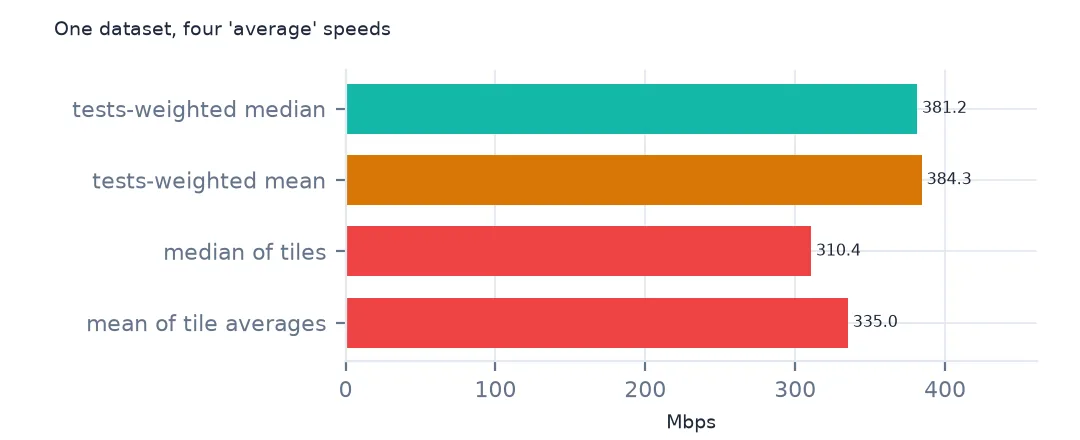
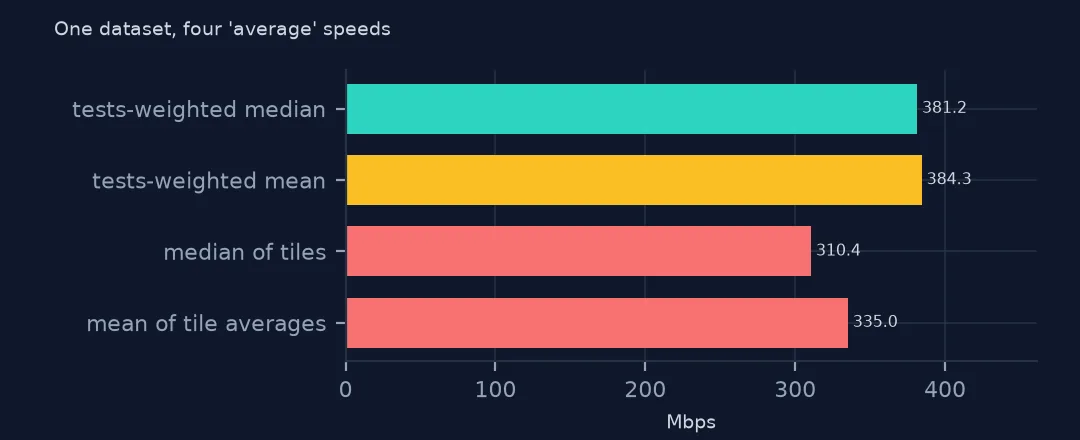
Each Ookla Speedtest tile already holds an average, the mean of the tests run in it. Averaging those averages gives every tile an equal vote, whether it holds one test or sixty thousand, and the result is neither the average test nor the average household. For April–June 2026 the mean of tile averages in the lower 48 is 335.0 Mbps, against a tests-weighted median of 381.2. This page shows the four common ways to summarise the tiles, how far they differ nationally and by county, and which to use.
Quick answer
Weight by tests when summarising tile averages: np.average(v, weights=tests) for a mean, or a weighted median (this page's wmedian). Use the weighted median for typical speed, since tile averages are skewed by gigabit lines.
print(f"mean of tile averages: {fixed.avg_d_kbps.mean() / 1000:.1f} Mbps; median of tiles: {fixed.avg_d_kbps.median() / 1000:.1f}")
print(f"tests-weighted mean: {np.average(fixed.avg_d_kbps, weights=fixed.tests) / 1000:.1f}; tests-weighted median: {wmedian(fixed.avg_d_kbps, fixed.tests) / 1000:.1f}")
mean of tile averages: 335.0 Mbps; median of tiles: 310.4
tests-weighted mean: 384.3; tests-weighted median: 381.2
The four summaries disagree: the mean of tile averages is 335.0 Mbps and their median 310.4, while weighting by tests gives a mean of 384.3 and a median of 381.2.
Unequal tiles, the weighted median and counties
1. Tiles are not equal
print(f"tiles: {len(fixed):,}; tests: {fixed.tests.sum():,}; share of tiles with 1 test {(fixed.tests == 1).mean():.1%}, holding {fixed.tests[fixed.tests == 1].sum() / fixed.tests.sum():.1%} of tests")tiles: 1,548,841; tests: 15,134,971; share of tiles with 1 test 28.4%, holding 2.9% of tests
28.4% of the 1,548,841 tiles hold a single test, but together only 2.9% of the 15,134,971 tests. Unweighted, they carry more than a quarter of the weight.
2. The weighted median
import inspect
print(inspect.getsource(wmedian).splitlines()[0])
print(f"check against repeating each tile's value tests times (one state): {wmedian(fixed[fixed.STUSPS == 'VT'].avg_d_kbps, fixed[fixed.STUSPS == 'VT'].tests)} vs "
      f"{np.median(np.repeat(fixed[fixed.STUSPS == 'VT'].avg_d_kbps, fixed[fixed.STUSPS == 'VT'].tests))}")
def wmedian(values, weights):
check against repeating each tile's value tests times (one state): 258429 vs 258429.0
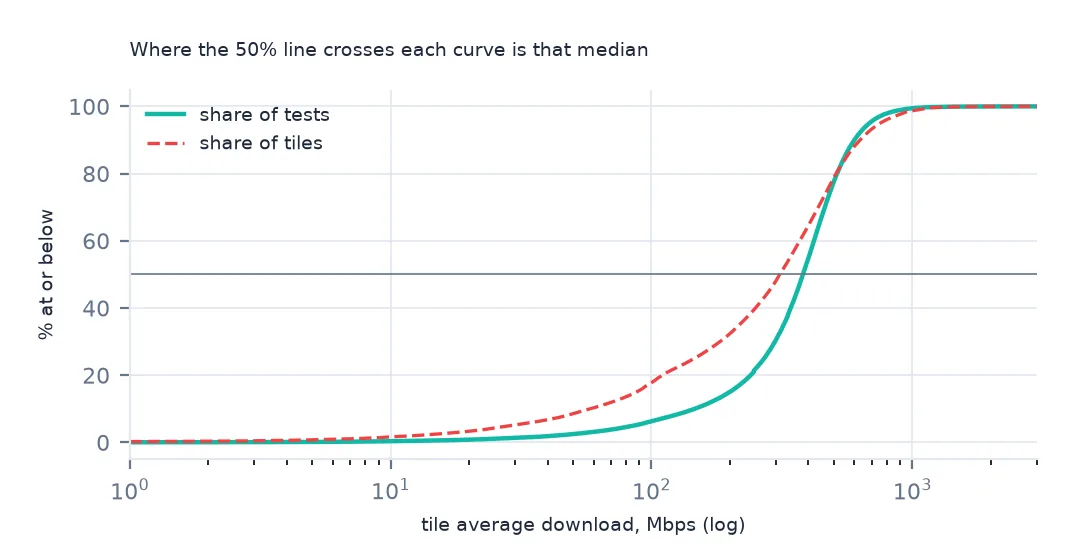
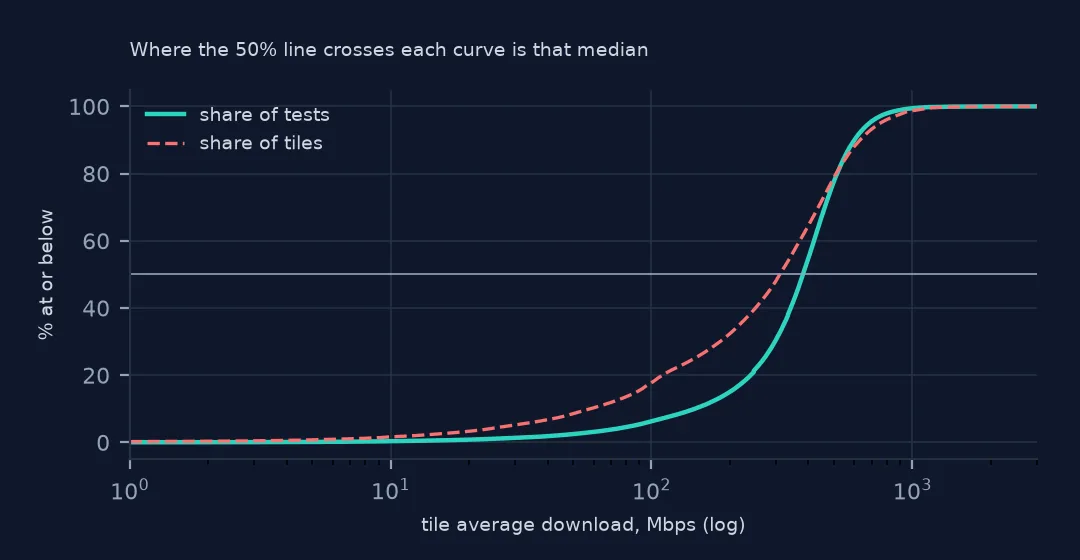
The weighted median sorts tiles by speed and finds where the cumulative test count passes half. For Vermont it gives 258,429 kbps, exactly what np.median returns after repeating each tile's value once per test, without building the repeated array.
3. What changes by county
g = fixed.groupby("GEOID").apply(lambda d: pd.Series({"plain": d.avg_d_kbps.median() / 1000, "weighted": wmedian(d.avg_d_kbps, d.tests) / 1000, "tests": d.tests.sum()}), include_groups=False)
g = g[g.tests >= 100]
print(f"counties: {len(g):,}; differ by 10 Mbps or more: {((g.plain - g.weighted).abs() >= 10).mean():.1%}; plain higher in {(g.plain > g.weighted).mean():.1%}")
counties: 2,907; differ by 10 Mbps or more: 85.4%; plain higher in 15.3%
In 85.4% of the 2,907 counties with enough tests, the plain and weighted medians differ by 10 Mbps or more, and the plain median is higher in 15.3%. The choice changes county maps, not just national figures.
Devices and state rankings
The data used on this page
Ookla's Speedtest open data performance tiles for fixed broadband (April–June 2026), read from Amazon S3, and Census Bureau 2023 county boundaries.
from pathlib import Path

import duckdb
import geopandas as gpd
import numpy as np
import pandas as pd
import requests

Path("data").mkdir(exist_ok=True)
# Ookla Speedtest open data (AWS Open Data, keyless): one Parquet file per quarter and network type, zoom-16 web
# Mercator tiles with average speeds, latency, tests and devices. Published quarterly under fixed names.
BASE = "https://ookla-open-data.s3.amazonaws.com/parquet/performance"


def tiles(kind, year, q):
    """One quarter's tiles inside a box around the contiguous US, cached locally as Parquet."""
    path = f"data/ookla-{kind}-{year}q{q}-conus.parquet"
    if not Path(path).exists():
        url = f"{BASE}/type={kind}/year={year}/quarter={q}/{year}-{(q - 1) * 3 + 1:02d}-01_performance_{kind}_tiles.parquet"
        con = duckdb.connect()
        con.sql("INSTALL httpfs; LOAD httpfs;")
        con.sql(f"""COPY (SELECT quadkey, tile_x, tile_y, avg_d_kbps, avg_u_kbps, avg_lat_ms, avg_lat_down_ms, avg_lat_up_ms, tests, devices
                         FROM read_parquet('{url}') WHERE tile_x BETWEEN -125 AND -66 AND tile_y BETWEEN 24 AND 50
                         ORDER BY quadkey) TO '{path}' (FORMAT parquet)""")
    return pd.read_parquet(path)


for name in ["cb_2023_us_county_20m.zip"]:
    if not Path(f"data/{name}").exists():
        Path(f"data/{name}").write_bytes(requests.get(f"https://www2.census.gov/geo/tiger/GENZ2023/shp/{name}", timeout=300).content)
counties = gpd.read_file("data/cb_2023_us_county_20m.zip")
counties = counties[~counties.STUSPS.isin(["AK", "HI", "PR"])].to_crs(4326)


def in_counties(df):
    """Attach the county each tile's centre falls in; tiles outside the lower 48 (Canada, Mexico, sea) drop out."""
    pts = gpd.GeoDataFrame(df, geometry=gpd.points_from_xy(df.tile_x, df.tile_y), crs=4326)
    j = gpd.sjoin(pts, counties[["GEOID", "STUSPS", "NAME", "geometry"]], predicate="within")
    return pd.DataFrame(j.drop(columns=["geometry", "index_right"]))


def wmedian(values, weights):
    """Median of tile averages, each tile counted once per test."""
    o = np.argsort(values.to_numpy())
    v, w = values.to_numpy()[o], weights.to_numpy()[o]
    c = np.cumsum(w)
    return v[np.searchsorted(c, c[-1] / 2)]


fixed = in_counties(tiles("fixed", 2026, 2))
print(f"Ookla fixed broadband, April-June 2026: {len(fixed):,} tiles in the lower 48, {fixed.tests.sum():,} tests")
Ookla fixed broadband, April-June 2026: 1,548,841 tiles in the lower 48, 15,134,971 tests
Example 1: still not a person average
d = fixed.assign(pd_=fixed.tests / fixed.devices)
print(f"devices-weighted median: {wmedian(fixed.avg_d_kbps, fixed.devices) / 1000:.1f} Mbps against tests-weighted {wmedian(fixed.avg_d_kbps, fixed.tests) / 1000:.1f}")
devices-weighted median: 371.5 Mbps against tests-weighted 381.2
Weighting by devices instead of tests gives 371.5 Mbps, a little lower: heavy testers tend to be on fast connections.
Example 2: ranking states
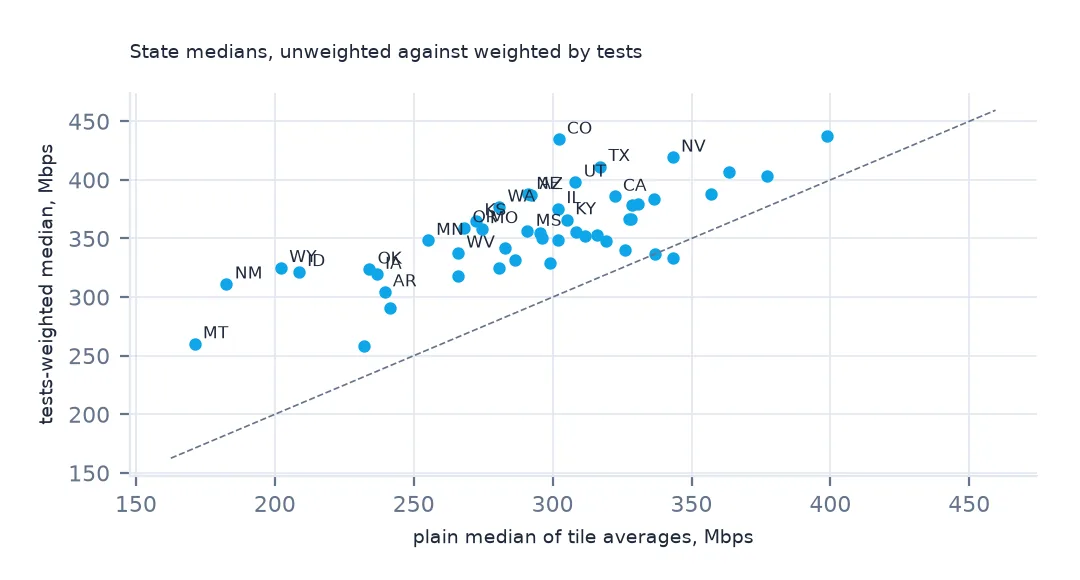
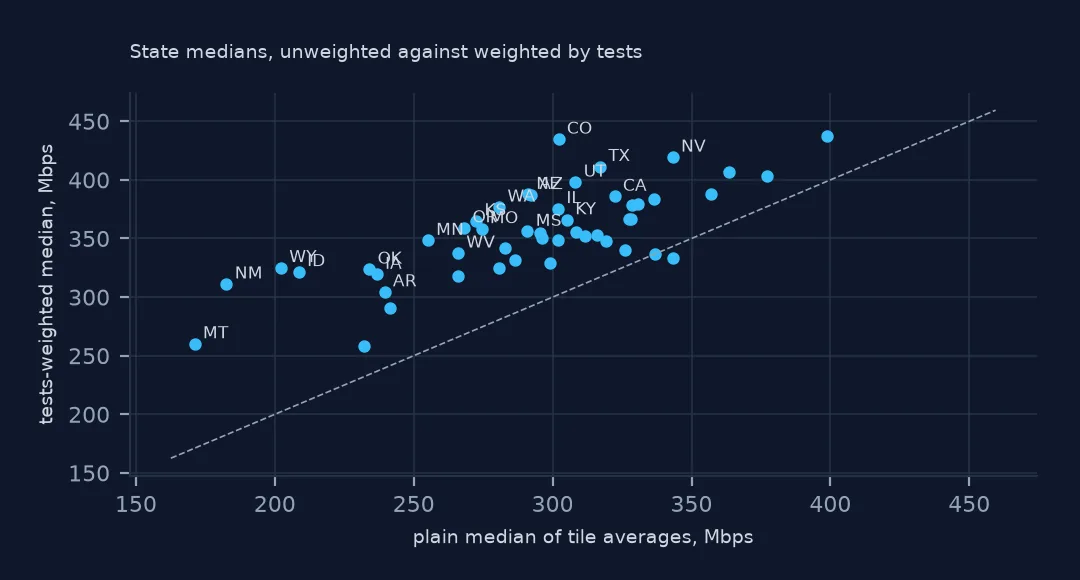
r = pd.DataFrame({"plain": fixed.groupby("STUSPS").avg_d_kbps.median() / 1000, "weighted": fixed.groupby("STUSPS").apply(lambda d: wmedian(d.avg_d_kbps, d.tests), include_groups=False) / 1000})
print(f"rank correlation of state rankings: {r.plain.corr(r.weighted, method='spearman'):.2f}; states moving 5+ places: {((r.plain.rank() - r.weighted.rank()).abs() >= 5).sum()}")
rank correlation of state rankings: 0.69; states moving 5+ places: 29
State rankings change too: the rank correlation between plain and weighted state medians is only 0.69, and 29 states move five or more places.
Why averages of averages mislead
A tile's average speed summarises its tests, and tiles with few tests (rural tiles and tiles with one curious user) are numerous. An unweighted summary over tiles treats a one-test tile like a busy apartment block, so it describes places, not tests, and tilts toward sparse areas. Weighting by tests reconstructs what the summary over individual tests would have been. Weighting by devices gives each device one vote, which is closer to households but still not population. Which is right depends on the question. For typical experienced speed, weight by tests.
Choosing the weight
- Tests for experienced speed; devices to reduce the effect of heavy testers; population (from Census data) to estimate household experience by area.
- Medians, not means, because tile averages are skewed by a few multi-gigabit lines.
- Report the weight in every chart caption.
- Weighted medians need a small function; pandas has none built in.
Internal links
- How to read Ookla Speedtest tiles — the files and fields
- How to map broadband speed by county — the county map
- Speedtest data explained — who runs tests
FAQ
How do I average Ookla Speedtest tiles correctly?
Weight each tile by its number of tests. For April–June 2026 the tests-weighted median is 381.2 Mbps against 310.4 for the plain median of tiles.
Should I use the mean or the median of internet speeds?
The median: the tests-weighted mean (384.3 Mbps) is pulled up by multi-gigabit tiles, while the weighted median (381.2) describes the typical test.