
How to Compare Mobile and Fixed Broadband Speeds by Place
On this page
Problem statement
Is mobile internet catching up with home broadband? Ookla publishes separate open tiles for fixed broadband and for mobile networks, so the two can be compared in the same places and the same quarter. The answer depends on how you compare: nationally, by county, or tile by tile, and on upload and latency as well as download. This page compares fixed and mobile speeds across the lower 48 for April–June 2026 and finds the counties where mobile is ahead.
Quick answer
Read both network types for the same quarter, join each to counties, compute tests-weighted medians per county, and compare only counties with enough tests on both. Compare upload and latency too, not just download.
def county_median(df):
    return df.groupby("GEOID").apply(lambda g: pd.Series({"tests": g.tests.sum(), "mbps": wmedian(g.avg_d_kbps, g.tests) / 1000}), include_groups=False)
both = county_median(fixed).join(county_median(mobile), lsuffix="_fixed", rsuffix="_mobile", how="inner")
both = both[(both.tests_fixed >= 100) & (both.tests_mobile >= 100)]
print(f"national: fixed {wmedian(fixed.avg_d_kbps, fixed.tests) / 1000:.0f} Mbps, mobile {wmedian(mobile.avg_d_kbps, mobile.tests) / 1000:.0f} Mbps; counties compared: {len(both):,}")
national: fixed 381 Mbps, mobile 256 Mbps; counties compared: 1,678
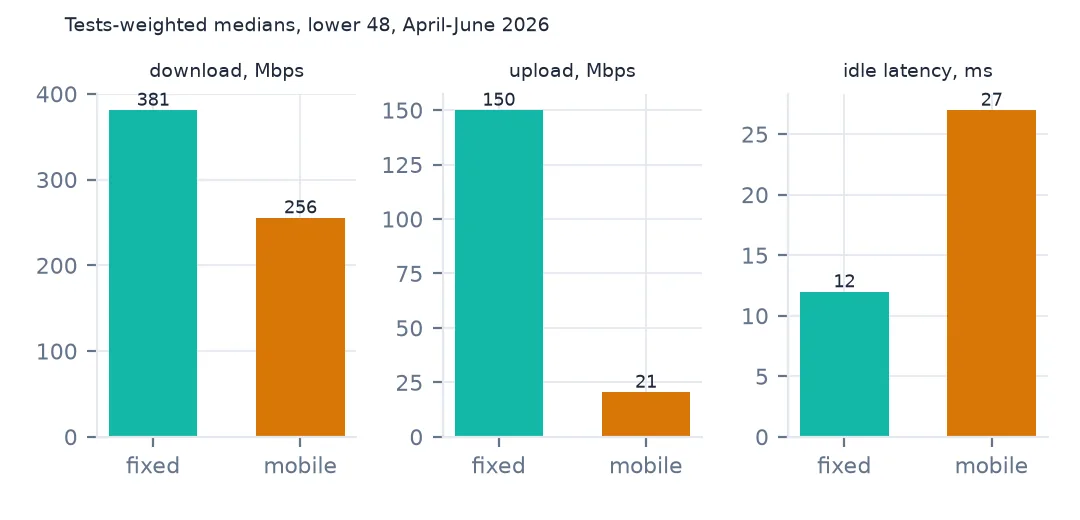
Nationally, the tests-weighted median is 381 Mbps on fixed broadband and 256 Mbps on mobile. 1,678 counties have enough tests on both networks to compare.
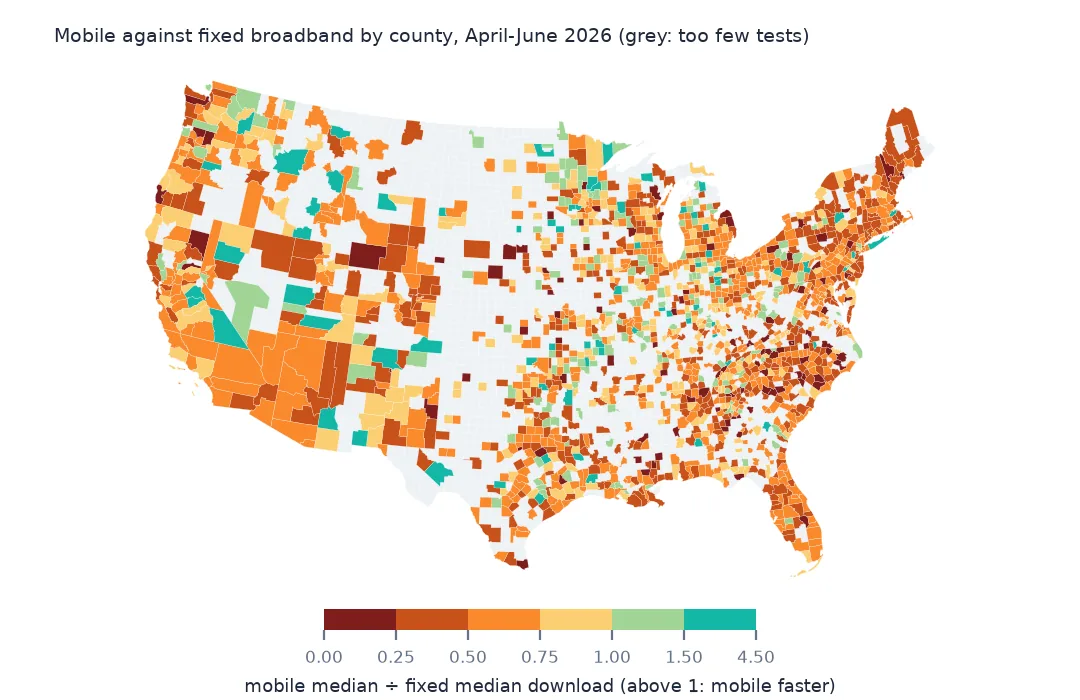
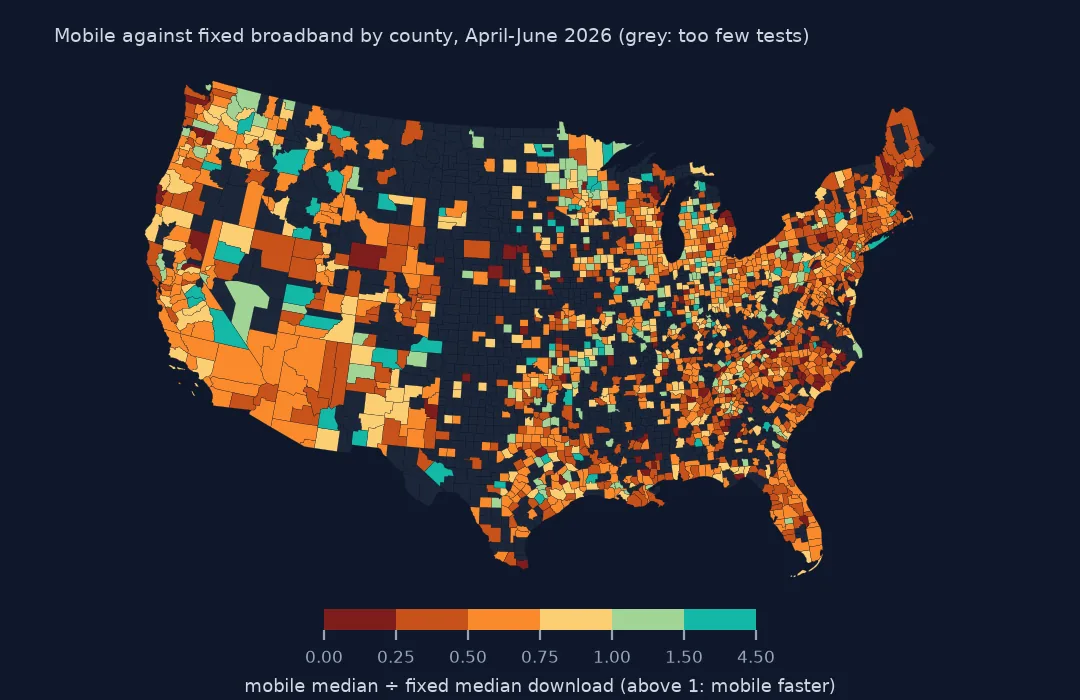
Where mobile wins, tests and the other measures
1. Where mobile beats fixed
both["ratio"] = both.mbps_mobile / both.mbps_fixed
print(f"counties where mobile is faster: {(both.ratio > 1).mean():.1%}; median ratio mobile/fixed {both.ratio.median():.2f}")
counties where mobile is faster: 14.4%; median ratio mobile/fixed 0.61
Mobile is faster in 14.4% of those counties, and the median county's mobile speed is 0.61 times its fixed speed.
2. Tests by network
print(f"tests: fixed {fixed.tests.sum():,} in {len(fixed):,} tiles; mobile {mobile.tests.sum():,} in {len(mobile):,} tiles")
print(f"tiles with both: {fixed.quadkey.isin(mobile.quadkey).mean():.1%} of fixed tiles")
tests: fixed 15,134,971 in 1,548,841 tiles; mobile 1,481,842 in 420,323 tiles
tiles with both: 18.9% of fixed tiles
There are ten times as many fixed tests (15,134,971) as mobile (1,481,842), spread over almost four times as many tiles. Only 18.9% of fixed tiles also have mobile tests.
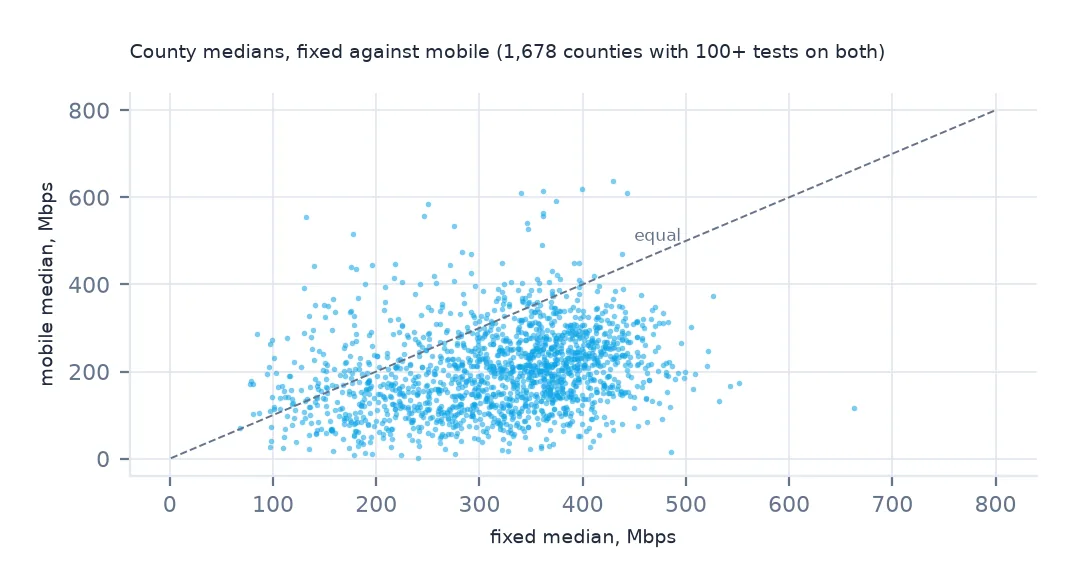
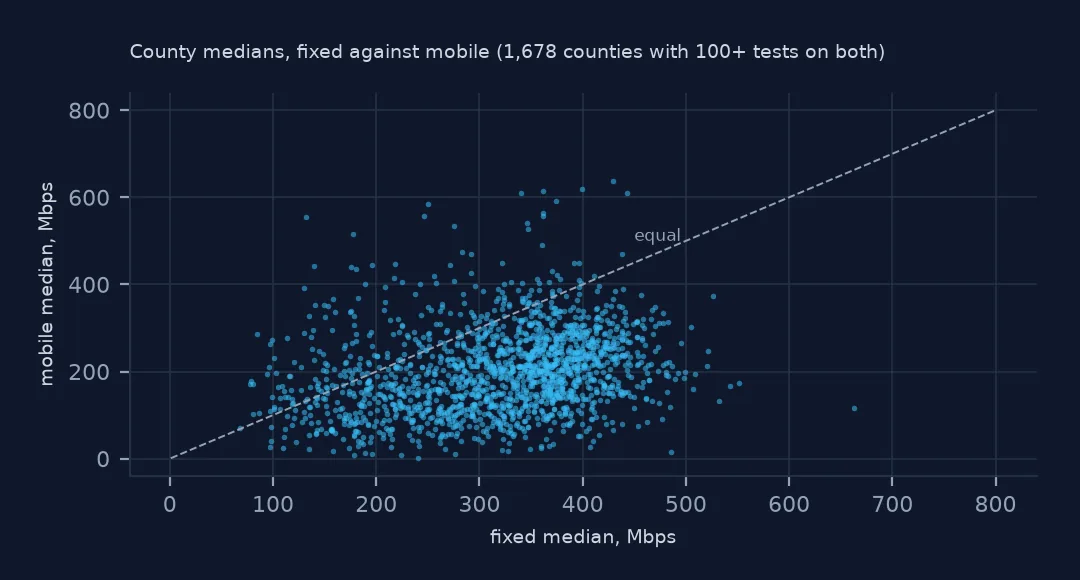
3. Upload and latency
for name, d in [("fixed", fixed), ("mobile", mobile)]:
    print(f"{name}: upload {wmedian(d.avg_u_kbps, d.tests) / 1000:.0f} Mbps, latency {wmedian(d.avg_lat_ms, d.tests):.0f} ms")
fixed: upload 150 Mbps, latency 12 ms
mobile: upload 21 Mbps, latency 27 ms
Upload and latency separate the networks further: 150 Mbps upload on fixed against 21 on mobile, and 12 ms idle latency against 27.
Gaps and shared tiles
The data used on this page
Ookla's Speedtest open data performance tiles for fixed broadband and mobile networks (April–June 2026), read from Amazon S3, and Census Bureau 2023 county boundaries.
from pathlib import Path

import duckdb
import geopandas as gpd
import numpy as np
import pandas as pd
import requests

Path("data").mkdir(exist_ok=True)
# Ookla Speedtest open data (AWS Open Data, keyless): one Parquet file per quarter and network type, zoom-16 web
# Mercator tiles with average speeds, latency, tests and devices. Published quarterly under fixed names.
BASE = "https://ookla-open-data.s3.amazonaws.com/parquet/performance"


def tiles(kind, year, q):
    """One quarter's tiles inside a box around the contiguous US, cached locally as Parquet."""
    path = f"data/ookla-{kind}-{year}q{q}-conus.parquet"
    if not Path(path).exists():
        url = f"{BASE}/type={kind}/year={year}/quarter={q}/{year}-{(q - 1) * 3 + 1:02d}-01_performance_{kind}_tiles.parquet"
        con = duckdb.connect()
        con.sql("INSTALL httpfs; LOAD httpfs;")
        con.sql(f"""COPY (SELECT quadkey, tile_x, tile_y, avg_d_kbps, avg_u_kbps, avg_lat_ms, avg_lat_down_ms, avg_lat_up_ms, tests, devices
                         FROM read_parquet('{url}') WHERE tile_x BETWEEN -125 AND -66 AND tile_y BETWEEN 24 AND 50
                         ORDER BY quadkey) TO '{path}' (FORMAT parquet)""")
    return pd.read_parquet(path)


for name in ["cb_2023_us_county_20m.zip"]:
    if not Path(f"data/{name}").exists():
        Path(f"data/{name}").write_bytes(requests.get(f"https://www2.census.gov/geo/tiger/GENZ2023/shp/{name}", timeout=300).content)
counties = gpd.read_file("data/cb_2023_us_county_20m.zip")
counties = counties[~counties.STUSPS.isin(["AK", "HI", "PR"])].to_crs(4326)


def in_counties(df):
    """Attach the county each tile's centre falls in; tiles outside the lower 48 (Canada, Mexico, sea) drop out."""
    pts = gpd.GeoDataFrame(df, geometry=gpd.points_from_xy(df.tile_x, df.tile_y), crs=4326)
    j = gpd.sjoin(pts, counties[["GEOID", "STUSPS", "NAME", "geometry"]], predicate="within")
    return pd.DataFrame(j.drop(columns=["geometry", "index_right"]))


def wmedian(values, weights):
    """Median of tile averages, each tile counted once per test."""
    o = np.argsort(values.to_numpy())
    v, w = values.to_numpy()[o], weights.to_numpy()[o]
    c = np.cumsum(w)
    return v[np.searchsorted(c, c[-1] / 2)]


fixed = in_counties(tiles("fixed", 2026, 2))
mobile = in_counties(tiles("mobile", 2026, 2))
print(f"Ookla fixed broadband, April-June 2026: {len(fixed):,} tiles in the lower 48, {fixed.tests.sum():,} tests")
Ookla fixed broadband, April-June 2026: 1,548,841 tiles in the lower 48, 15,134,971 tests
Example 1: the counties with the biggest gap
b = both.join(counties.set_index("GEOID")[["NAME", "STUSPS"]])
print("mobile far ahead:", b.sort_values("ratio").tail(3)[["NAME", "STUSPS", "mbps_fixed", "mbps_mobile"]].round(0).to_dict("records"))
print("fixed far ahead:", b.sort_values("ratio").head(3)[["NAME", "STUSPS", "mbps_fixed", "mbps_mobile"]].round(0).to_dict("records"))
mobile far ahead: [{'NAME': 'Tuolumne', 'STUSPS': 'CA', 'mbps_fixed': 139.0, 'mbps_mobile': 443.0}, {'NAME': 'Cumberland', 'STUSPS': 'IL', 'mbps_fixed': 84.0, 'mbps_mobile': 286.0}, {'NAME': 'Colorado', 'STUSPS': 'TX', 'mbps_fixed': 132.0, 'mbps_mobile': 556.0}]
fixed far ahead: [{'NAME': 'Ashe', 'STUSPS': 'NC', 'mbps_fixed': 241.0, 'mbps_mobile': 2.0}, {'NAME': 'Halifax', 'STUSPS': 'NC', 'mbps_fixed': 485.0, 'mbps_mobile': 14.0}, {'NAME': 'Pickens', 'STUSPS': 'GA', 'mbps_fixed': 276.0, 'mbps_mobile': 11.0}]
Mobile is furthest ahead in Tuolumne County, California (443 Mbps against 139), Cumberland County, Illinois and Colorado County, Texas, where the wired medians are low. Fixed is furthest ahead in Ashe and Halifax counties, North Carolina and Pickens County, Georgia, where mobile medians of 2–14 Mbps point to poor cell coverage.
Example 2: same tiles
t = fixed[["quadkey", "avg_d_kbps"]].merge(mobile[["quadkey", "avg_d_kbps"]], on="quadkey", suffixes=("_f", "_m"))
print(f"tiles measured on both: {len(t):,}; mobile faster in {(t.avg_d_kbps_m > t.avg_d_kbps_f).mean():.1%}")
tiles measured on both: 293,336; mobile faster in 37.1%
In the 293,336 tiles measured on both networks, mobile is faster in 37.1%, more than the county comparison suggests, because single-tile averages are noisy in both directions.
Why mobile is usually slower, and sometimes not
Fixed broadband delivers a dedicated line (fibre, cable, DSL) to a building, while mobile shares a cell's capacity among everyone nearby, so fixed is usually faster and much faster at upload. 5G mid-band networks can exceed rural cable or DSL, though, and in counties where the only wired options are old copper, a phone on a good 5G cell outruns the home connection. Speedtest data shows both effects: mobile ahead in a minority of counties with weak wired networks, and far behind where cell coverage is poor.
Comparison caveats
- Mobile tests come from phones on the move; a tile's average mixes indoor and outdoor, 4G and 5G.
- Mobile tiles are fewer (420,323 against 1,548,841), so compare counties with enough tests on both.
- Fixed tests include Wi-Fi, which can cap a fast line.
- Fixed wireless and satellite count as fixed in this data.
Internal links
- How to read Ookla Speedtest tiles — the files and fields
- How to map broadband speed by county — the county map
- Internet latency explained — milliseconds
FAQ
Is 5G faster than home broadband?
Usually not: in April–June 2026 the tests-weighted median was 381 Mbps for fixed and 256 Mbps for mobile in the lower 48. Mobile was faster in 14.4% of counties with enough tests on both.
How does mobile upload compare with fixed?
Much lower: a median of 21 Mbps on mobile against 150 Mbps on fixed broadband.