
Internet Speeds a Thousand Times Too High: Ookla Reports Kilobits
On this page
Problem statement
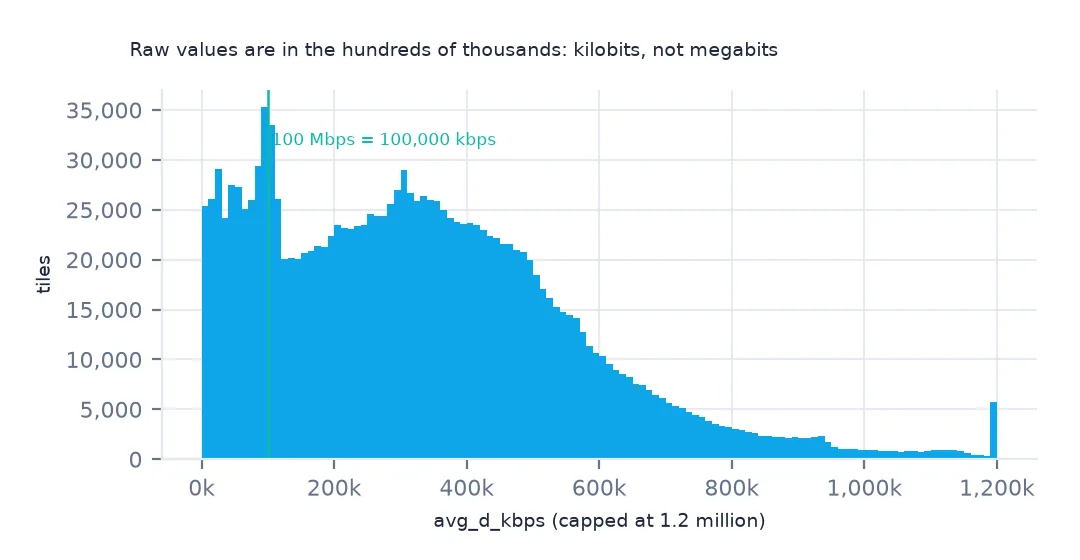
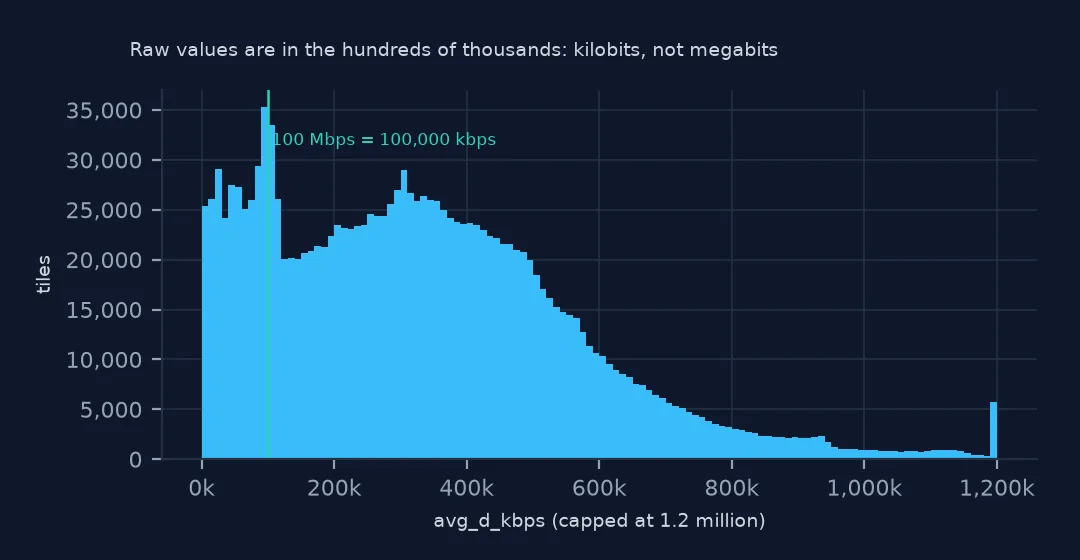
Ookla's Speedtest tiles report speeds in kilobits per second, in columns named avg_d_kbps and avg_u_kbps. Plot them as if they were megabits, the unit every internet plan is sold in, and the average US connection looks like 335,029 Mbps, 335 Gbps. Divide by 1,024, or confuse bits with bytes, and the numbers are wrong in subtler ways. This page shows the units in the April–June 2026 fixed-broadband data and the conversions that give Mbps and megabytes per second.
Quick answer
Divide by 1,000 (not 1,024) for megabits per second: avg_d_kbps / 1000. Divide megabits by 8 for megabytes per second. Read the unit from the column name before plotting, and convert once, at the start.
print(f"mean of avg_d_kbps: {fixed.avg_d_kbps.mean():,.0f} (kilobits per second)")
print(f"in Mbps: {fixed.avg_d_kbps.mean() / 1000:,.1f}; in MB/s (megabytes): {fixed.avg_d_kbps.mean() / 8000:,.1f}")
mean of avg_d_kbps: 335,029 (kilobits per second)
in Mbps: 335.0; in MB/s (megabytes): 41.9
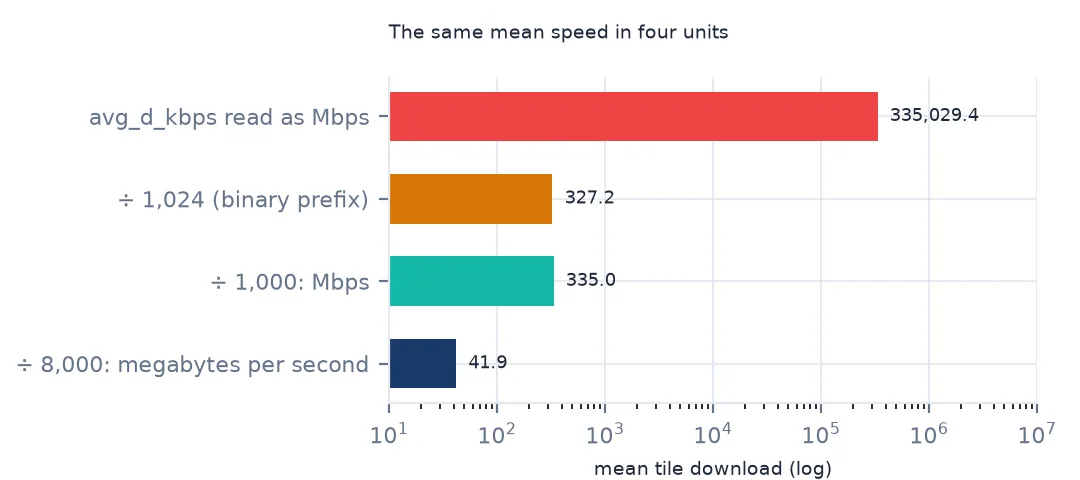
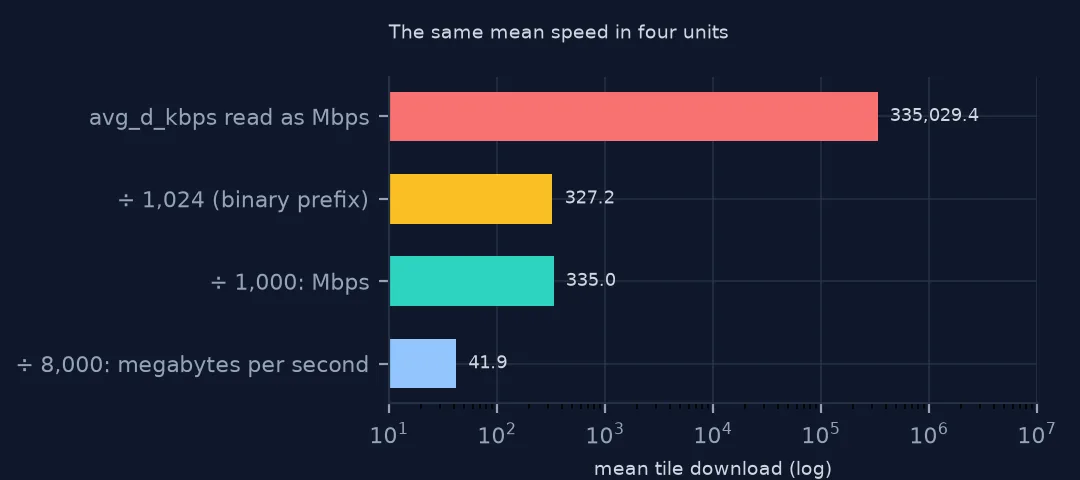
The mean tile average is 335,029 kbps. As megabits per second it is 335.0 Mbps; as megabytes per second, 41.9 MB/s. Labelled Mbps without converting, a chart would claim connections a thousand times faster than exist.
Units, prefixes and bytes
1. Read the column names
print([c for c in fixed.columns if "kbps" in c or "ms" in c])
print(fixed[["avg_d_kbps", "avg_u_kbps"]].median().to_dict())
['avg_d_kbps', 'avg_u_kbps', 'avg_lat_ms', 'avg_lat_down_ms', 'avg_lat_up_ms']
{'avg_d_kbps': 310440.0, 'avg_u_kbps': 74286.0}
The unit is in every column name: kbps for speeds and ms for latency. The median tile values (310,440 and 74,286) only make sense as kilobits.
2. Kilo is 1,000 here
print(f"tiles at exactly multiples of 1,024 kbps: {(fixed.avg_d_kbps % 1024 == 0).mean():.3%}; of 1,000: {(fixed.avg_d_kbps % 1000 == 0).mean():.3%}")tiles at exactly multiples of 1,024 kbps: 0.097%; of 1,000: 0.098%
Values are not rounded to binary or decimal multiples (0.097% and 0.098% of tiles), so the data gives no hint by itself. Use 1,000, as network speeds use decimal prefixes.
3. Bits and bytes
mb = wmedian(fixed.avg_d_kbps, fixed.tests) / 1000
print(f"median {mb:.0f} Mbps = {mb / 8:.1f} megabytes per second; a 4 GB download takes {4000 / (mb / 8) / 60:.1f} minutes at that speed")
median 381 Mbps = 47.7 megabytes per second; a 4 GB download takes 1.4 minutes at that speed
The median 381 Mbps connection moves 47.7 megabytes per second, so a 4 GB file takes about 1.4 minutes, not the 10 seconds a megabytes reading would suggest.
A units check and benchmarks
The data used on this page
Ookla's Speedtest open data performance tiles for fixed broadband (April–June 2026), read from Amazon S3, and Census Bureau 2023 county boundaries.
from pathlib import Path

import duckdb
import geopandas as gpd
import numpy as np
import pandas as pd
import requests

Path("data").mkdir(exist_ok=True)
# Ookla Speedtest open data (AWS Open Data, keyless): one Parquet file per quarter and network type, zoom-16 web
# Mercator tiles with average speeds, latency, tests and devices. Published quarterly under fixed names.
BASE = "https://ookla-open-data.s3.amazonaws.com/parquet/performance"


def tiles(kind, year, q):
    """One quarter's tiles inside a box around the contiguous US, cached locally as Parquet."""
    path = f"data/ookla-{kind}-{year}q{q}-conus.parquet"
    if not Path(path).exists():
        url = f"{BASE}/type={kind}/year={year}/quarter={q}/{year}-{(q - 1) * 3 + 1:02d}-01_performance_{kind}_tiles.parquet"
        con = duckdb.connect()
        con.sql("INSTALL httpfs; LOAD httpfs;")
        con.sql(f"""COPY (SELECT quadkey, tile_x, tile_y, avg_d_kbps, avg_u_kbps, avg_lat_ms, avg_lat_down_ms, avg_lat_up_ms, tests, devices
                         FROM read_parquet('{url}') WHERE tile_x BETWEEN -125 AND -66 AND tile_y BETWEEN 24 AND 50
                         ORDER BY quadkey) TO '{path}' (FORMAT parquet)""")
    return pd.read_parquet(path)


for name in ["cb_2023_us_county_20m.zip"]:
    if not Path(f"data/{name}").exists():
        Path(f"data/{name}").write_bytes(requests.get(f"https://www2.census.gov/geo/tiger/GENZ2023/shp/{name}", timeout=300).content)
counties = gpd.read_file("data/cb_2023_us_county_20m.zip")
counties = counties[~counties.STUSPS.isin(["AK", "HI", "PR"])].to_crs(4326)


def in_counties(df):
    """Attach the county each tile's centre falls in; tiles outside the lower 48 (Canada, Mexico, sea) drop out."""
    pts = gpd.GeoDataFrame(df, geometry=gpd.points_from_xy(df.tile_x, df.tile_y), crs=4326)
    j = gpd.sjoin(pts, counties[["GEOID", "STUSPS", "NAME", "geometry"]], predicate="within")
    return pd.DataFrame(j.drop(columns=["geometry", "index_right"]))


def wmedian(values, weights):
    """Median of tile averages, each tile counted once per test."""
    o = np.argsort(values.to_numpy())
    v, w = values.to_numpy()[o], weights.to_numpy()[o]
    c = np.cumsum(w)
    return v[np.searchsorted(c, c[-1] / 2)]


fixed = in_counties(tiles("fixed", 2026, 2))
print(f"Ookla fixed broadband, April-June 2026: {len(fixed):,} tiles in the lower 48, {fixed.tests.sum():,} tests")
Ookla fixed broadband, April-June 2026: 1,548,841 tiles in the lower 48, 15,134,971 tests
Example 1: a units check before plotting
def check_units(s):
    m = s.median()
    return "kbps" if m > 5_000 else "Mbps" if m > 5 else "Gbps?"


print({c: check_units(fixed[c]) for c in ["avg_d_kbps", "avg_u_kbps"]}, {"in Mbps": check_units(fixed.avg_d_kbps / 1000)})
{'avg_d_kbps': 'kbps', 'avg_u_kbps': 'kbps'} {'in Mbps': 'Mbps'}
A one-line check on the median catches the mistake before plotting: values in the hundreds of thousands are kilobits, values in the hundreds are megabits.
Example 2: the benchmark comparison
fast = fixed.avg_d_kbps >= 100 * 1000
print(f"tiles averaging at least 100 Mbps: {fast.mean():.1%}; the same test written as avg_d_kbps >= 100: {(fixed.avg_d_kbps >= 100).mean():.1%}")
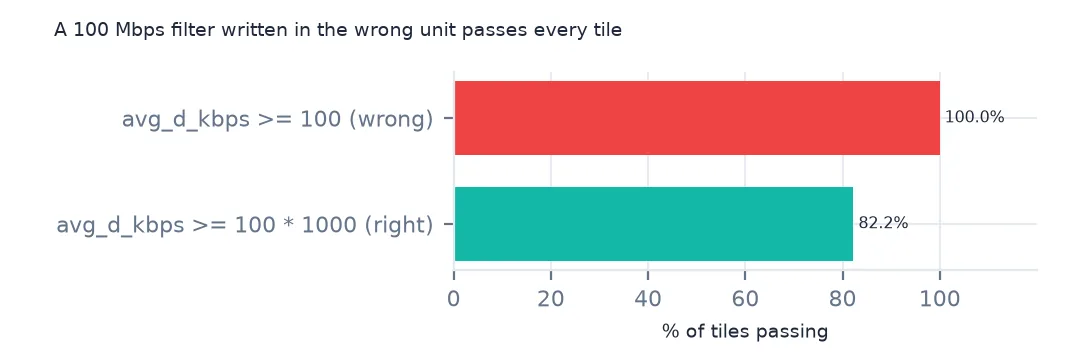
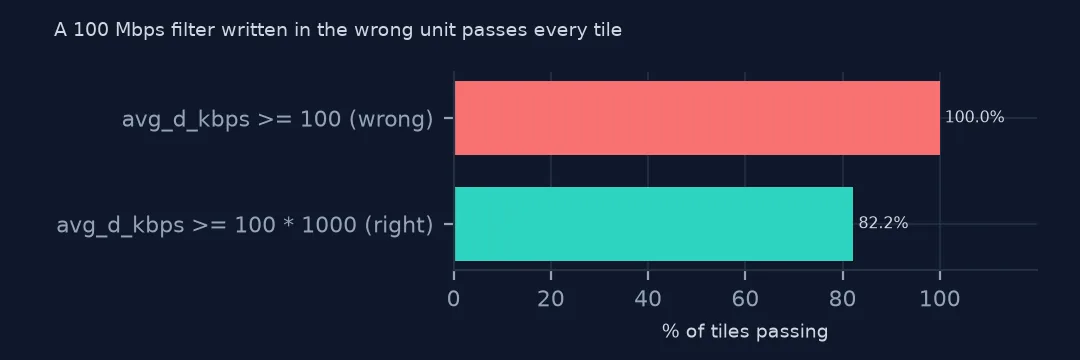
tiles averaging at least 100 Mbps: 82.2%; the same test written as avg_d_kbps >= 100: 100.0%
Filters need the same conversion. 82.2% of tiles average at least 100 Mbps, but writing the test as avg_d_kbps >= 100 passes 100.0% of them.
Why kilobits
Ookla stores speeds as integers in kilobits per second so that slow connections (a few hundred kbps) keep precision without decimals. Network speeds use decimal prefixes (1 Mbps = 1,000 kbps), unlike file sizes in some operating systems, which use binary ones. Download managers often show megabytes per second, so the same connection reads as 381 in a speed test and about 48 in a browser's download window.
Related unit traps
- Latency columns end in
_ms, already milliseconds. - Mbps against MB/s: lowercase b is bits, uppercase B is bytes.
- Gigabit plans appear as values a little under a million kbps after protocol overhead.
- Filters written in Mbps (
>= 100) must be converted too.
Internal links
- How to read Ookla Speedtest tiles — the files and fields
- Average internet speed comes out wrong — weighting by tests
- How to map broadband speed by county — the county map
FAQ
What unit is avg_d_kbps in Ookla data?
Kilobits per second. Divide by 1,000 for megabits per second: the mean tile average of 335,029 kbps is 335.0 Mbps.
How do I convert Mbps to MB/s?
Divide by 8. The US median of 381 Mbps is 47.7 megabytes per second.