
Empty Speedtest Tiles Are Not Places Without Internet
On this page
Problem statement
Map Ookla's Speedtest tiles for the lower 48 and most of the country is blank: only 4.6% of the land has a fixed-broadband tile in April–June 2026. It is tempting to read the blank areas as places without internet. They are places where nobody ran a fixed-broadband test that quarter: empty land, forests, farms, and homes whose owners never opened the app. Tiles also come and go between quarters. This page measures how much of the map is empty, how unstable sparse tiles are, and how to avoid reading absence as lack of service.
Quick answer
Treat a missing tile as no data, never as no service. For coverage questions use the FCC's National Broadband Map, which records availability by location. To reduce gaps in speed maps, pool several quarters or aggregate to larger areas.
area_km2 = counties.set_index("GEOID").to_crs(5070).area / 1e6
tile_km2 = (40075 / 2 ** 16) ** 2 * np.cos(np.radians(fixed.tile_y)) ** 2
cov = (tile_km2.groupby(fixed.GEOID).sum() / area_km2).reindex(area_km2.index).fillna(0)
print(f"share of the lower 48's land with a fixed-broadband tile: {tile_km2.sum() / area_km2.sum():.1%}; counties with no tile: {(cov == 0).sum()}")
share of the lower 48's land with a fixed-broadband tile: 4.6%; counties with no tile: 1
Tiles with at least one fixed-broadband test cover 4.6% of the land area of the lower 48, and only one county has no tile at all. Everywhere else, the map's blank areas are land where no one tested.
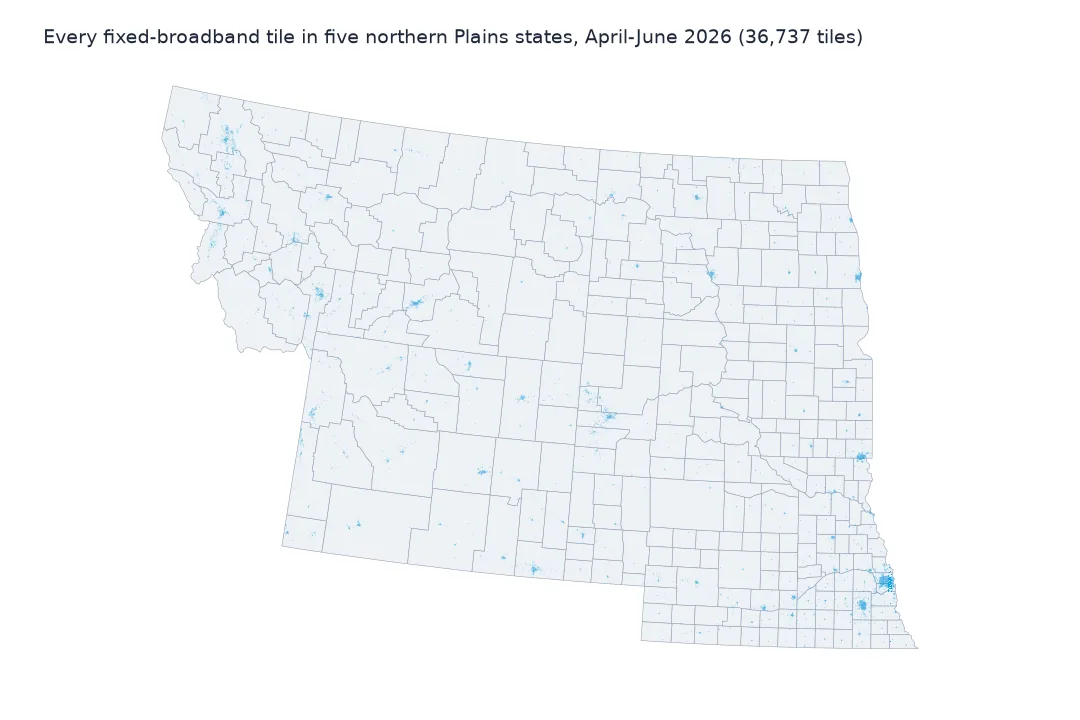
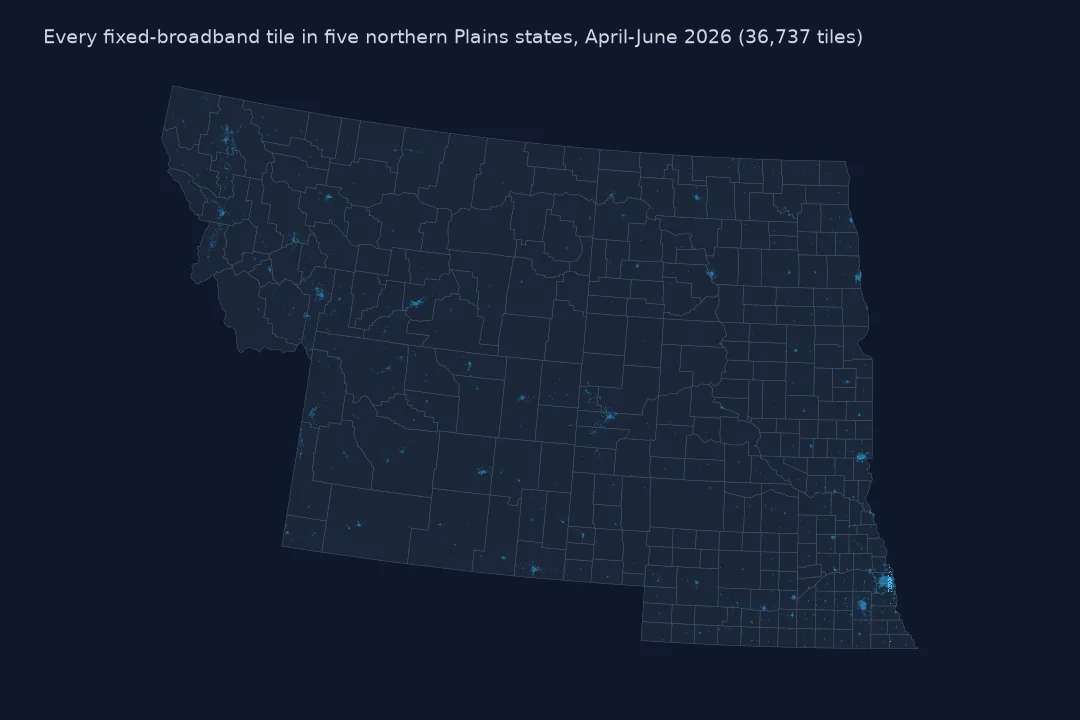
Churn, sparse tiles and county coverage
1. Tiles come and go
a, b = set(fixed25.quadkey), set(fixed.quadkey)
print(f"tiles in Q2 2025: {len(a):,}; in Q2 2026: {len(b):,}; in both: {len(a & b):,}; only in one: {len(a ^ b):,}")
tiles in Q2 2025: 1,546,257; in Q2 2026: 1,548,841; in both: 1,023,742; only in one: 1,047,614
Between Q2 2025 and Q2 2026 the number of tiles hardly changed (1,546,257 and 1,548,841), but only 1,023,742 appear in both and 1,047,614 in just one. The map's coverage reshuffles every year.
2. Who lives in empty places
one_test = fixed.tests == 1
print(f"tiles with exactly one test: {one_test.mean():.1%}; tiles that disappear next year among 2025 tiles with one test: "
      f"{(~fixed25[fixed25.tests == 1].quadkey.isin(b)).mean():.1%}, with 10+ tests: {(~fixed25[fixed25.tests >= 10].quadkey.isin(b)).mean():.1%}")
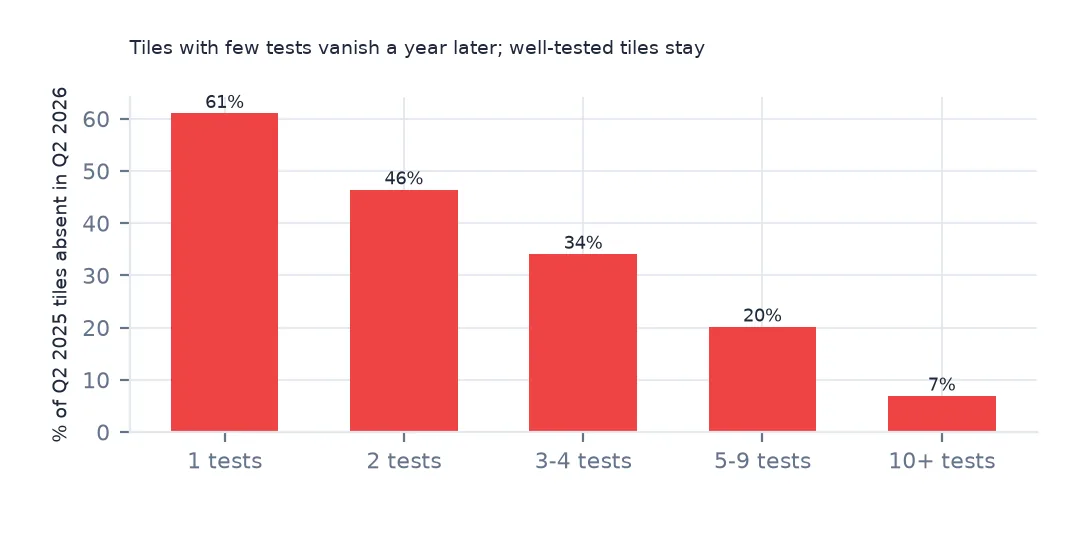
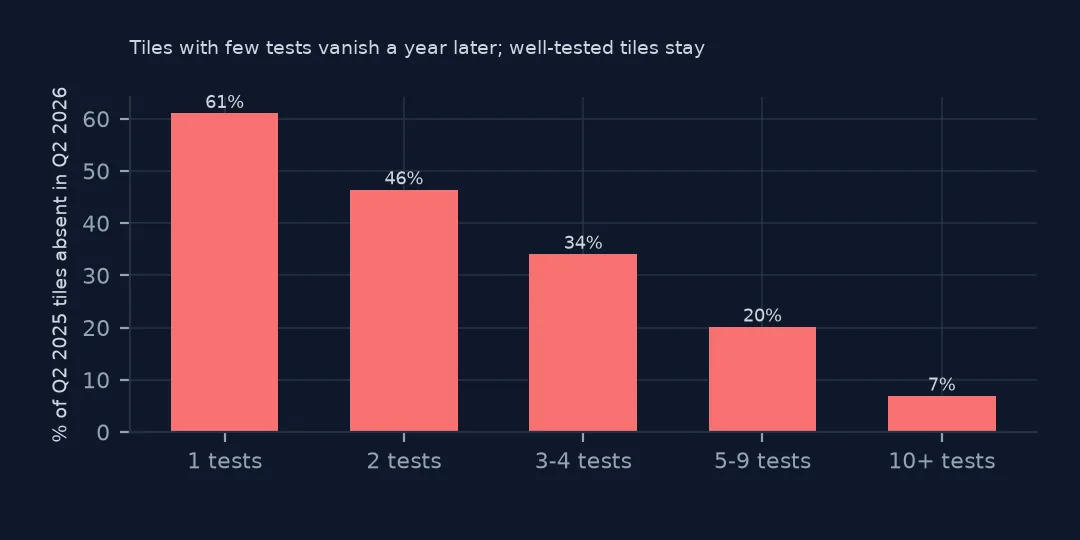
tiles with exactly one test: 28.4%; tiles that disappear next year among 2025 tiles with one test: 61.1%, with 10+ tests: 6.9%
The churn is in sparse tiles: 61.1% of 2025 tiles with one test vanish a year later, against 6.9% of tiles with 10 or more tests. An empty tile next to a filled one is usually chance.
3. Coverage by county
print(cov.describe(percentiles=[0.1, 0.5, 0.9])[["10%", "50%", "90%"]].round(3).to_dict()){'10%': 0.004, '50%': 0.035, '90%': 0.205}
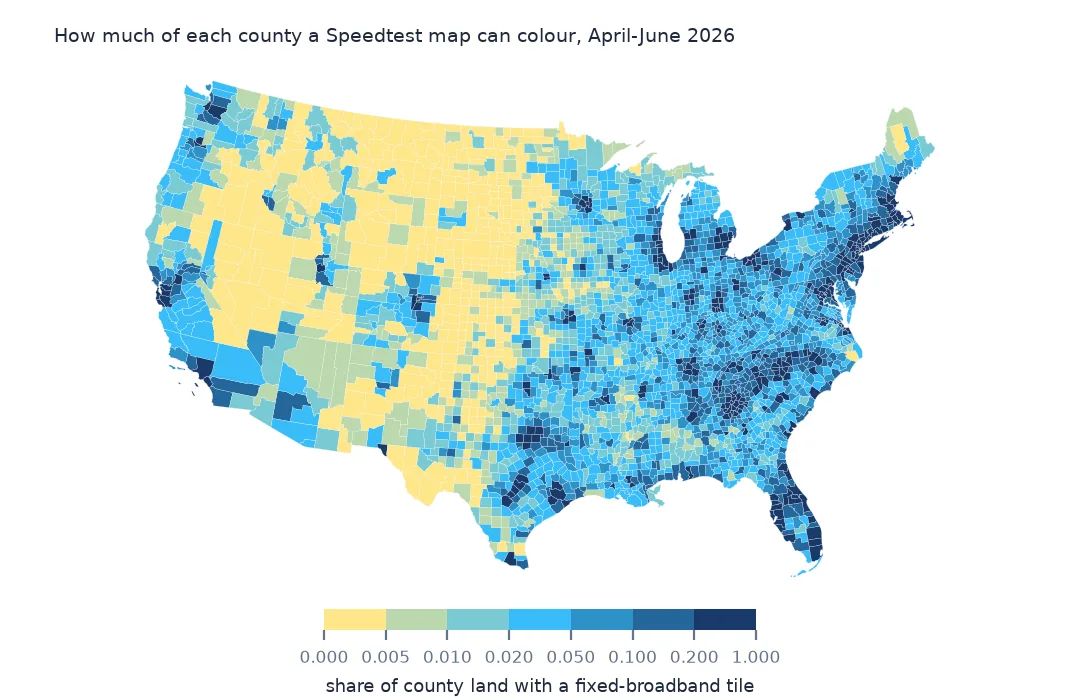
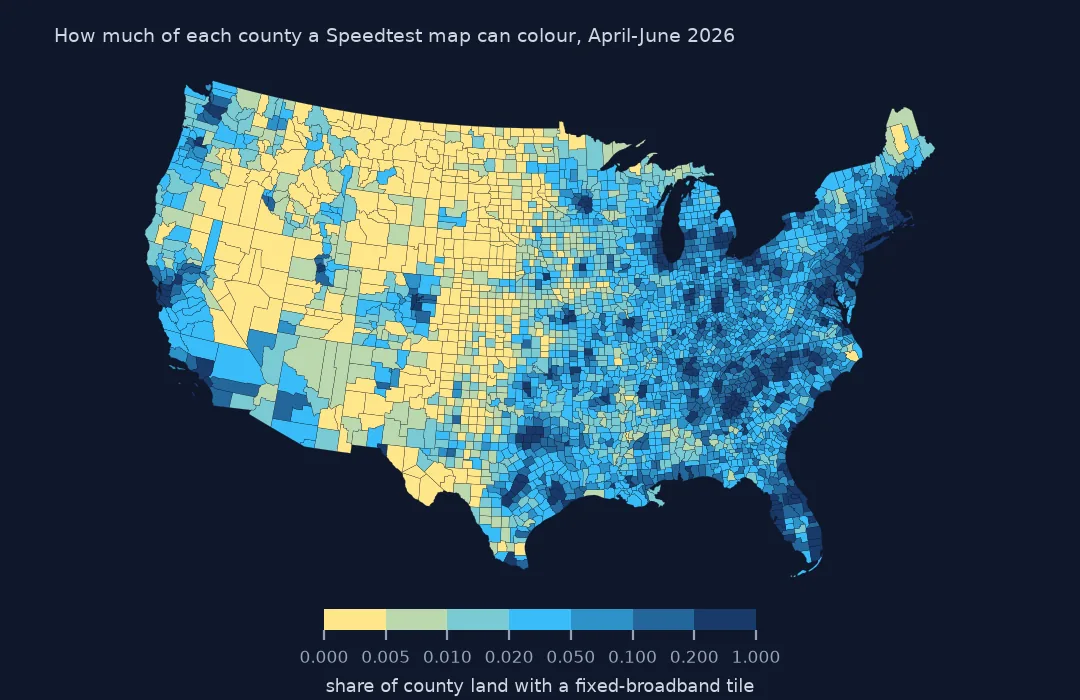
By county, the median county has tiles over 3.5% of its land, and the least covered tenth under 0.4%. Large rural counties look almost empty while their towns are fully tested.
Pooling quarters
The data used on this page
Ookla's Speedtest open data performance tiles for fixed broadband in April–June 2025 and April–June 2026, read from Amazon S3, and Census Bureau 2023 county boundaries.
from pathlib import Path

import duckdb
import geopandas as gpd
import numpy as np
import pandas as pd
import requests

Path("data").mkdir(exist_ok=True)
# Ookla Speedtest open data (AWS Open Data, keyless): one Parquet file per quarter and network type, zoom-16 web
# Mercator tiles with average speeds, latency, tests and devices. Published quarterly under fixed names.
BASE = "https://ookla-open-data.s3.amazonaws.com/parquet/performance"


def tiles(kind, year, q):
    """One quarter's tiles inside a box around the contiguous US, cached locally as Parquet."""
    path = f"data/ookla-{kind}-{year}q{q}-conus.parquet"
    if not Path(path).exists():
        url = f"{BASE}/type={kind}/year={year}/quarter={q}/{year}-{(q - 1) * 3 + 1:02d}-01_performance_{kind}_tiles.parquet"
        con = duckdb.connect()
        con.sql("INSTALL httpfs; LOAD httpfs;")
        con.sql(f"""COPY (SELECT quadkey, tile_x, tile_y, avg_d_kbps, avg_u_kbps, avg_lat_ms, avg_lat_down_ms, avg_lat_up_ms, tests, devices
                         FROM read_parquet('{url}') WHERE tile_x BETWEEN -125 AND -66 AND tile_y BETWEEN 24 AND 50
                         ORDER BY quadkey) TO '{path}' (FORMAT parquet)""")
    return pd.read_parquet(path)


for name in ["cb_2023_us_county_20m.zip"]:
    if not Path(f"data/{name}").exists():
        Path(f"data/{name}").write_bytes(requests.get(f"https://www2.census.gov/geo/tiger/GENZ2023/shp/{name}", timeout=300).content)
counties = gpd.read_file("data/cb_2023_us_county_20m.zip")
counties = counties[~counties.STUSPS.isin(["AK", "HI", "PR"])].to_crs(4326)


def in_counties(df):
    """Attach the county each tile's centre falls in; tiles outside the lower 48 (Canada, Mexico, sea) drop out."""
    pts = gpd.GeoDataFrame(df, geometry=gpd.points_from_xy(df.tile_x, df.tile_y), crs=4326)
    j = gpd.sjoin(pts, counties[["GEOID", "STUSPS", "NAME", "geometry"]], predicate="within")
    return pd.DataFrame(j.drop(columns=["geometry", "index_right"]))


def wmedian(values, weights):
    """Median of tile averages, each tile counted once per test."""
    o = np.argsort(values.to_numpy())
    v, w = values.to_numpy()[o], weights.to_numpy()[o]
    c = np.cumsum(w)
    return v[np.searchsorted(c, c[-1] / 2)]


fixed = in_counties(tiles("fixed", 2026, 2))
fixed25 = in_counties(tiles("fixed", 2025, 2))
print(f"Ookla fixed broadband, April-June 2026: {len(fixed):,} tiles in the lower 48, {fixed.tests.sum():,} tests")
Ookla fixed broadband, April-June 2026: 1,548,841 tiles in the lower 48, 15,134,971 tests
Example 1: pool quarters to fill gaps
pooled = pd.concat([fixed25, fixed]).groupby("quadkey").agg(tests=("tests", "sum"))
print(f"tiles with a test in either quarter: {len(pooled):,} ({len(pooled) / len(b) - 1:+.1%} on 2026 alone)")
tiles with a test in either quarter: 2,071,356 (+33.7% on 2026 alone)
Pooling the two quarters gives 2,071,356 tiles with a test, 33.7% more than 2026 alone. Pooling a year of quarters fills more, at the cost of mixing time periods.
Example 2: what not to conclude
lo = cov.sort_values().head(3)
print("lowest tile coverage:", {counties.set_index("GEOID").loc[k, "NAME"] + ", " + counties.set_index("GEOID").loc[k, "STUSPS"]: round(v, 4) for k, v in lo.items()})
lowest tile coverage: {'Miner, SD': 0.0, 'Ziebach, SD': 0.0, 'Treasure, MT': 0.0001}
The least covered counties, Miner and Ziebach in South Dakota and Treasure County, Montana, are sparsely settled farm and ranch land. Their blank maps say how few people tested, not whether they can get online.
Why tiles are empty
A tile exists only if at least one test was run in it during the quarter. Most land has no buildings, and of the buildings, most households never run a speed test in a given three months. Rural tiles with one test appear and disappear from quarter to quarter at random. Speedtest data therefore maps tests, which follow people and their reasons for testing, and says nothing about what is available where nobody tested.
Gap-handling
- Pool quarters for sparse areas, and say so in the caption.
- Aggregate to counties or hexagons large enough to hold tests.
- Never fill empty tiles with zeros or a low value.
- Use the FCC map for availability and Speedtest for performance.
Internal links
- How to read Ookla Speedtest tiles — the files and fields
- Speedtest data explained — who runs tests
- How to map broadband speed by county — the county map
FAQ
Do empty Speedtest tiles mean no internet?
No. They mean no test was run there that quarter. In April–June 2026, tiles covered 4.6% of the lower 48's land, while broadband reaches far more.
Why do Ookla tiles change between quarters?
Tiles with one or two tests appear and disappear at random: 61.1% of 2025 tiles with one test had no test a year later, against 6.9% of tiles with 10 or more.