
How to Calculate Road Collision Rates per Vehicle-Kilometre
On this page
Problem statement
Counting collisions on a road says how many happened there, not how dangerous the road is. A motorway carrying a hundred thousand vehicles a day will have more collisions than a quiet A road and still be far safer per journey. The standard measure is a rate per vehicle-kilometre: collisions divided by the amount of driving that produced them. Britain publishes both halves — every injury collision with its location and road number in STATS19, and traffic flows and link lengths in the road traffic counts — but not joined.
This page joins them for 2024. It matches each collision on a motorway or A road to the nearest count-point link on the same road, divides by that link's vehicle-kilometres, and compares rates by road category, link and region — with the exposure threshold that keeps the rates meaningful.
Quick answer
Build vehicle-kilometres for every major-road link in 2024, match each collision to the nearest link on the same numbered road with a KD-tree, keep matches within 2 km, and divide:
links = aadf[(aadf.year == 2024) & (aadf.road_type == "Major") & aadf.link_length_km.notna()].copy()
links["vkm_100m"] = links.all_motor_vehicles * links.link_length_km * 366 / 1e8              # 2024 had 366 days
col = c[c.road.notna()]
matched = []
for road, g in col.groupby("road"):
    L = links[links.road_name == road]
    if L.empty:
        continue
    tree = cKDTree(L[["easting", "northing"]].values)
    dist, i = tree.query(g[["location_easting_osgr", "location_northing_osgr"]].values)
    matched.append(pd.DataFrame({"collision_index": g.collision_index.values, "count_point_id": L.count_point_id.values[i],
                                 "metres": dist, "severity": g.collision_severity.values}))
m = pd.concat(matched)
m = m[m.metres <= 2000]
per = links.set_index("count_point_id").join(m.groupby("count_point_id").size().rename("collisions")).fillna({"collisions": 0})
rate = per.groupby("road_category")[["collisions", "vkm_100m"]].sum()
rate["per 100m vkm"] = rate.collisions / rate.vkm_100m
print(f"{len(m):,} of {len(col):,} collisions on numbered roads matched to a count-point link within 2 km")
print(rate.round(1).to_string())
41,774 of 47,400 collisions on numbered roads matched to a count-point link within 2 km
collisions vkm_100m per 100m vkm
road_category
PA 35646.0 1643.2 21.7
PM 55.0 10.0 5.5
TA 3546.0 751.1 4.7
TM 2527.0 1119.7 2.3
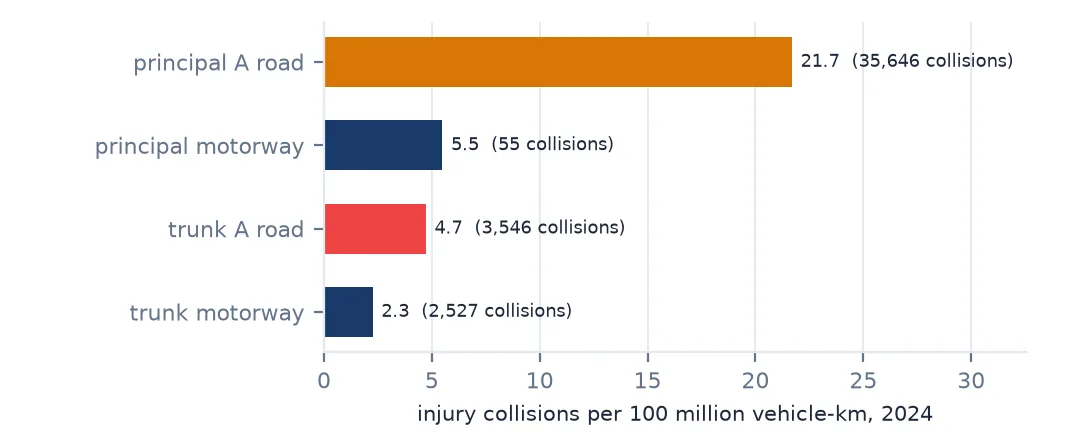
41,774 of the 47,400 collisions on motorways and A roads match a count-point link on their road within 2 km. Per hundred million vehicle-kilometres, trunk motorways had 2.3 injury collisions in 2024, trunk A roads 4.7 and principal A roads 21.7 — nine times the motorway rate. Principal A roads run through towns, with junctions, crossings and cyclists; motorways separate traffic from all of that.
Matching collisions to traffic
1. Collisions carry the road they happened on
print(c.first_road_class.map({1: "Motorway", 2: "A(M)", 3: "A", 4: "B", 5: "C", 6: "Unclassified"}).value_counts().to_string())
print(c[c.road.notna()].road.value_counts().head(6).to_dict())
first_road_class
A 44142
Unclassified 36466
B 12677
C 4384
Motorway 3029
A(M) 229
{'A38': 602, 'A1': 491, 'A6': 485, 'A4': 474, 'A23': 470, 'M25': 420}
Of 100,927 injury collisions in 2024, 44,142 were on A roads and 3,029 on motorways; the rest were on B, C and unclassified roads, which have no link lengths in the count file and so no rate. STATS19 gives the road as a class and a number, which reassemble into the count file's names — A38, M25, A1(M).
2. Match each collision to the nearest link on the same road
print(f"distance to the matched count point: median {m.metres.median():.0f} m, 90th percentile {m.metres.quantile(0.9):.0f} m")
print(f"collisions beyond 2 km of any count point on their road: {(pd.concat(matched).metres > 2000).sum():,}")
distance to the matched count point: median 382 m, 90th percentile 1267 m
collisions beyond 2 km of any count point on their road: 5,593
A matched collision is a median 382 m from its count point, and 90% are within 1,267 m. 5,593 collisions are more than 2 km from any count point on their road — on roads whose links in the file are long or missing — and are left out rather than assigned to a distant link.
3. Rates need enough exposure
per["rate"] = per.collisions / per.vkm_100m
per["band"] = pd.cut(per.vkm_100m, [0, 0.1, 1, 10, 1e6])
print(per.groupby("band", observed=True).rate.agg(median="median", p90=lambda s: s.quantile(0.9), links="size").round(1).to_string())
median p90 links
band
(0.0, 0.1] 23.7 199.8 10258
(0.1, 1.0] 7.5 34.7 7075
(1.0, 10.0] 1.3 4.0 603
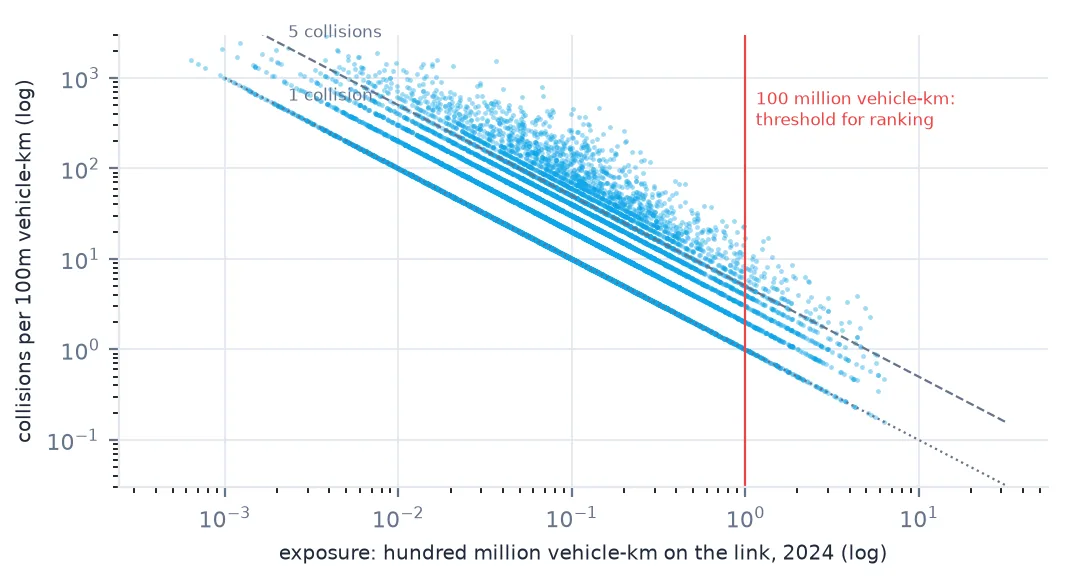
Rates are unstable where there is little exposure. Links with under ten million vehicle-km a year have a median rate of 23.7 per hundred million and a 90th percentile of 199.8: one or two collisions on a short, quiet link produce enormous rates. Above a hundred million vehicle-km the median falls to 1.3. Rank links only above an exposure threshold.
4. Severity per vehicle-kilometre
sev = m.merge(per[["road_category"]].reset_index(), on="count_point_id")
sev = sev.groupby(["road_category", "severity"]).size().unstack().rename(columns={1: "fatal", 2: "serious", 3: "slight"})
sev = sev.div(rate.vkm_100m, axis=0)
print(sev.round(2).to_string())
severity fatal serious slight
road_category
PA 0.32 4.77 16.61
PM NaN 0.90 4.59
TA 0.17 1.13 3.42
TM 0.06 0.44 1.76
The gap holds for every severity. Fatal collisions per hundred million vehicle-km were 0.32 on principal A roads and 0.06 on trunk motorways; serious ones 4.77 against 0.44. Principal motorways had no fatal collision matched in 2024.
Links and regions
The data used on this page
The Department for Transport's road traffic statistics: annual average daily flows (AADF) for every count point in Great Britain, 2000–2025, in the release of 2 June 2026, saved on this site because DfT revises earlier years with each release. Contains public sector information licensed under the Open Government Licence v3.0. Collisions are the Department for Transport's STATS19 road safety data for 2024, every reported personal-injury collision in Great Britain with its coordinates and road number.
from pathlib import Path

import numpy as np
import pandas as pd
import requests
from scipy.spatial import cKDTree

Path("data").mkdir(exist_ok=True)
# DfT republishes the counts every June and revises earlier years; this is the release of 2 June 2026
# (live: https://storage.googleapis.com/dft-statistics/road-traffic/downloads/data-gov-uk/dft_traffic_counts_aadf.zip).
AADF = "dft-traffic-counts-aadf-2026-06-02.zip"
if not Path(f"data/{AADF}").exists():
    Path(f"data/{AADF}").write_bytes(requests.get(f"https://data.spatialworkflow.io/{AADF}", timeout=600).content)
aadf = pd.read_csv(f"data/{AADF}", low_memory=False)
f = Path("data/dft-road-casualty-statistics-collision-2024.csv")
if not f.exists():
    f.write_bytes(requests.get(f"https://data.dft.gov.uk/road-accidents-safety-data/{f.name}", timeout=600).content)
c = pd.read_csv(f, low_memory=False).dropna(subset=["location_easting_osgr"])
prefix = {1: "M", 2: "A", 3: "A"}
c["road"] = [f"{prefix[k]}{n}" + ("(M)" if k == 2 else "") if k in prefix and n > 0 else None
             for k, n in zip(c.first_road_class, c.first_road_number)]
print(f"{len(aadf):,} AADF rows; {len(c):,} collisions in 2024, {c.road.notna().sum():,} on a motorway or A road")
600,551 AADF rows; 100,927 collisions in 2024, 47,400 on a motorway or A road
Example 1: the links with the highest rates
busy = per[per.vkm_100m >= 1].sort_values("rate", ascending=False)
print(busy.head(6)[["road_name", "local_authority_name", "all_motor_vehicles", "link_length_km", "collisions", "rate"]].round(2).to_string())
road_name local_authority_name all_motor_vehicles link_length_km collisions rate
count_point_id
96212 M3 Surrey 111853 3.3 23.0 17.02
96012 A13 Newham 108652 3.2 20.0 15.72
89051 A282 Kent 122169 2.8 16.0 12.78
96211 A3 Surrey 84523 3.6 12.0 10.78
46022 M6 Walsall 163242 2.4 15.0 10.46
16096 A2 Kent 37388 8.0 11.0 10.05
Among links with at least a hundred million vehicle-km, the highest 2024 rates were on the M3 in Surrey (17.02, 23 collisions on 3.3 km), the A13 in Newham, the A282 approach to the Dartford Crossing in Kent and the A3 in Surrey. One year of collisions on one link is still a small number; three or five years give a steadier ranking.
Example 2: rates by region
reg = per.groupby("region_name")[["collisions", "vkm_100m"]].sum()
reg["per 100m vkm"] = reg.collisions / reg.vkm_100m
print(reg.sort_values("per 100m vkm").round(1).to_string())
collisions vkm_100m per 100m vkm
region_name
Scotland 1621.0 316.6 5.1
Wales 1065.0 193.9 5.5
North East 996.0 129.4 7.7
East of England 3310.0 405.7 8.2
South West 3082.0 344.4 8.9
East Midlands 2877.0 307.6 9.4
North West 3927.0 407.8 9.6
West Midlands 3375.0 337.6 10.0
South East 5989.0 598.4 10.0
Yorkshire and The Humber 3223.0 299.0 10.8
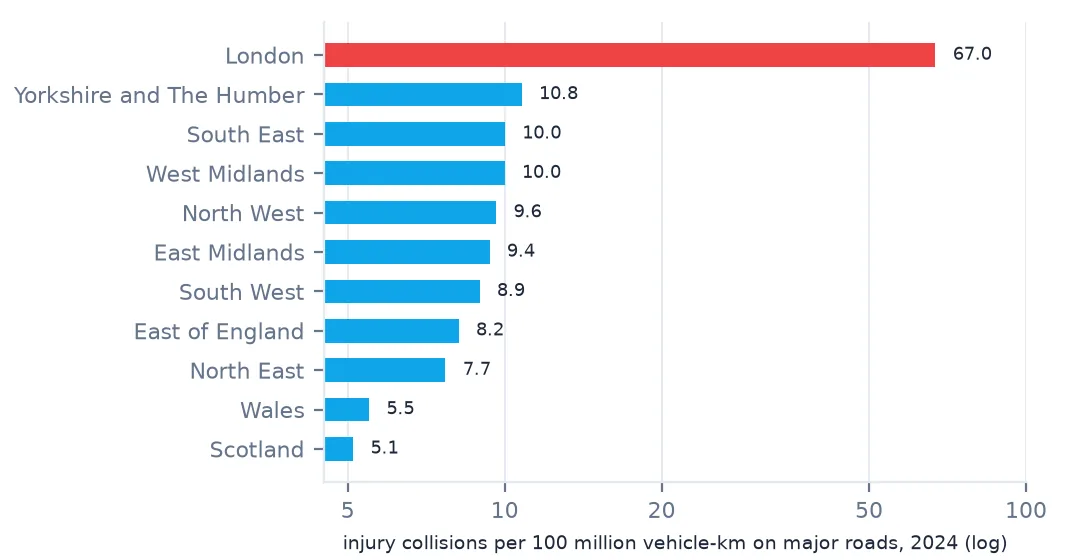
London 12309.0 183.7 67.0
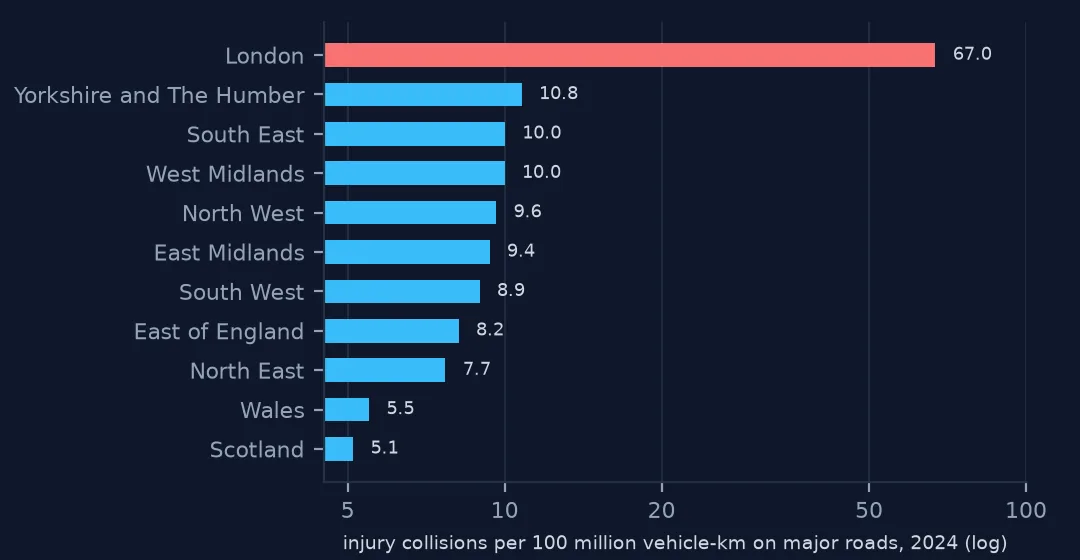
By region, the rate on major roads runs from 5.1 per hundred million vehicle-km in Scotland to 10.8 in Yorkshire and the Humber — and 67.0 in London, where nearly all major roads are urban A roads with heavy pedestrian and cycle traffic. A regional comparison of rates is mostly a comparison of road mix.
A rate needs the right denominator
A collision rate per vehicle-kilometre treats driving as the exposure that produces risk, so that a road is judged by how many collisions it has per unit of traffic. That is the right denominator for comparing roads for drivers. It is not the right one for pedestrians or cyclists, whose exposure is not measured by motor traffic, and on urban A roads many casualties are pedestrians and cyclists — part of the reason London's rate is so high.
The spatial join is the fragile part. STATS19 locates collisions by coordinates and road number; the count file locates traffic by count points standing for links. Matching on the road number first and distance second avoids assigning a collision on a side road to the main road beside it, and a distance cut-off avoids assigning it to a link kilometres away. Both choices are visible in the code and in the counts they leave out, which is what makes the resulting rates checkable.
Pitfalls with collision rates
- Rates on low-exposure links are noise. Set a threshold before ranking.
- Match on the road first, then distance; nearest-link alone puts junction collisions on the wrong road.
- Minor roads have no link lengths and no rate from this method.
- One year is a small sample for a single link; pool years.
- Vehicle-km is the drivers' exposure, not pedestrians' or cyclists'.
- Use the year's real number of days; 2024 was a leap year.
Internal links
- How to turn traffic counts into vehicle-kilometres by region — the denominator
- How to read UK road traffic counts — links and road names
- Crash injury severity explained — what the severity codes mean
FAQ
Are motorways safer than A roads in the UK?
Per vehicle-kilometre, much safer: in 2024, 2.3 injury collisions per hundred million vehicle-km on trunk motorways against 21.7 on principal A roads.
How do I calculate a road collision rate in Python?
Compute vehicle-kilometres per link from AADF and link length, match each STATS19 collision to the nearest link on the same road, and divide collisions by vehicle-kilometres, keeping only links with enough traffic for the rate to be stable.