
How to Turn Traffic Counts into Vehicle-Kilometres by Region
On this page
Problem statement
A traffic count is a flow at a point: vehicles per day. Most questions about traffic need an amount of travel instead — how far all those vehicles drove — because emissions, fuel, collisions and road wear scale with distance, not with flow. The conversion is simple where the count represents a stretch of road: flow times length times days gives vehicle-kilometres. Britain's count file supplies the length for every major-road link, so major-road travel can be totalled by region, road type, vehicle class and year.
This page does that for 2000–2025 and checks the parts that make the arithmetic misleading: links without lengths, a network that grows, and the difference between where roads are and where traffic is.
Quick answer
Multiply each major-road link's AADF by its length and by 365, and sum:
major = aadf[(aadf.road_type == "Major") & aadf.link_length_km.notna()].copy()
major["vkm_bn"] = major.all_motor_vehicles * major.link_length_km * 365 / 1e9
yr = major.groupby("year").vkm_bn.sum()
print(f"major-road motor vehicle-km, billions: 2000 {yr[2000]:.1f}, 2019 {yr[2019]:.1f}, 2020 {yr[2020]:.1f}, 2025 {yr[2025]:.1f}")
print(major[major.year == 2025].groupby("road_category").vkm_bn.sum().round(1).to_string())
major-road motor vehicle-km, billions: 2000 299.2, 2019 355.2, 2020 269.7, 2025 359.7
road_category
PA 167.1
PM 1.0
TA 76.8
TM 114.7
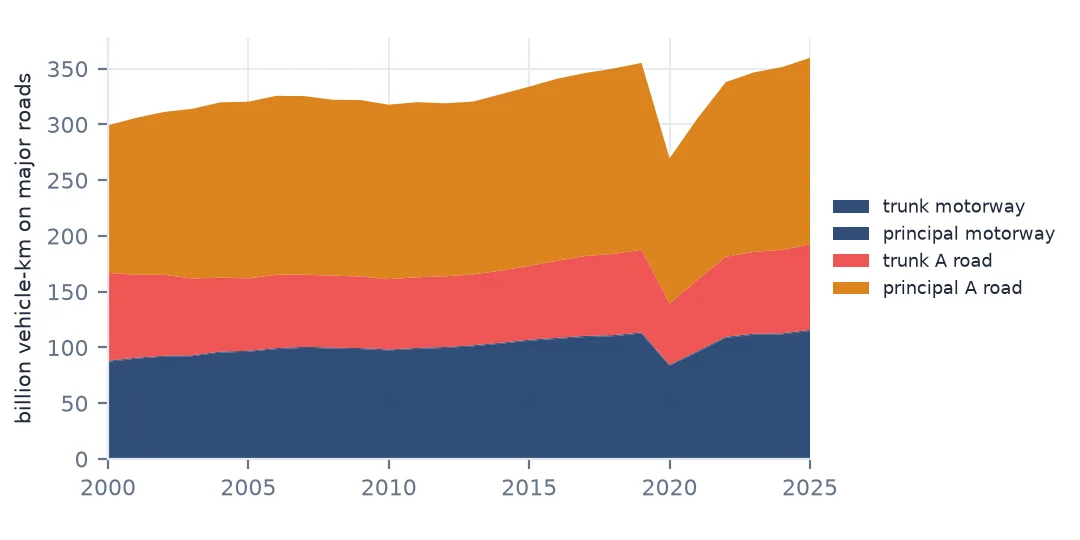
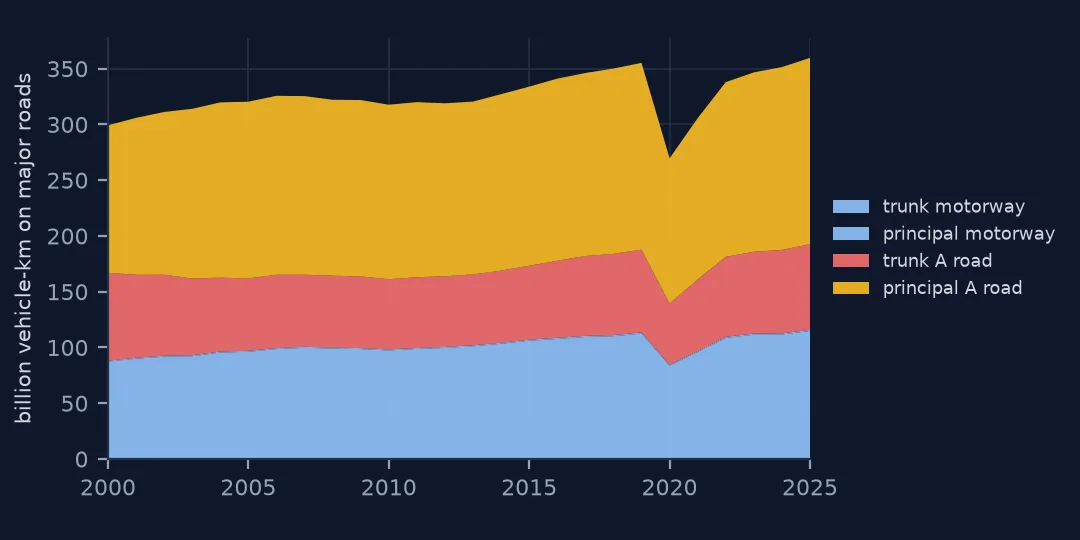
Motor traffic on Britain's major roads came to 299.2 billion vehicle-kilometres in 2000, 355.2 billion in 2019, 269.7 billion in 2020 and 359.7 billion in 2025 — back above its pre-pandemic level. Principal A roads carry 167.1 billion of 2025's total, trunk motorways 114.7 billion.
Links, lengths and regions
1. Links, not points
y = major[major.year == 2025]
print(f"{len(y):,} major-road links in 2025, total length {y.link_length_km.sum():,.0f} km")
print(y.groupby("road_category").agg(links=("count_point_id", "size"), km=("link_length_km", "sum"),
                                     median_link_km=("link_length_km", "median")).round(1).to_string())
17,941 major-road links in 2025, total length 51,534 km
links km median_link_km
road_category
PA 14453 38988.8 1.4
PM 35 41.7 0.8
TA 2214 8794.5 2.2
TM 1239 3709.2 1.8
17,941 links cover 51,534 km of major road in 2025: 38,988.8 km of principal A roads in short links (a median 1.4 km, between junctions in towns) and 3,709 km of trunk motorway in longer ones. Minor roads have no link lengths in the file and are left out; their travel is estimated nationally from the sample, not link by link.
2. Length against traffic
share = y.groupby("road_category").agg(km=("link_length_km", "sum"), vkm=("vkm_bn", "sum"))
print((100 * share / share.sum()).round(1).to_string())
km vkm
road_category
PA 75.7 46.5
PM 0.1 0.3
TA 17.1 21.4
TM 7.2 31.9
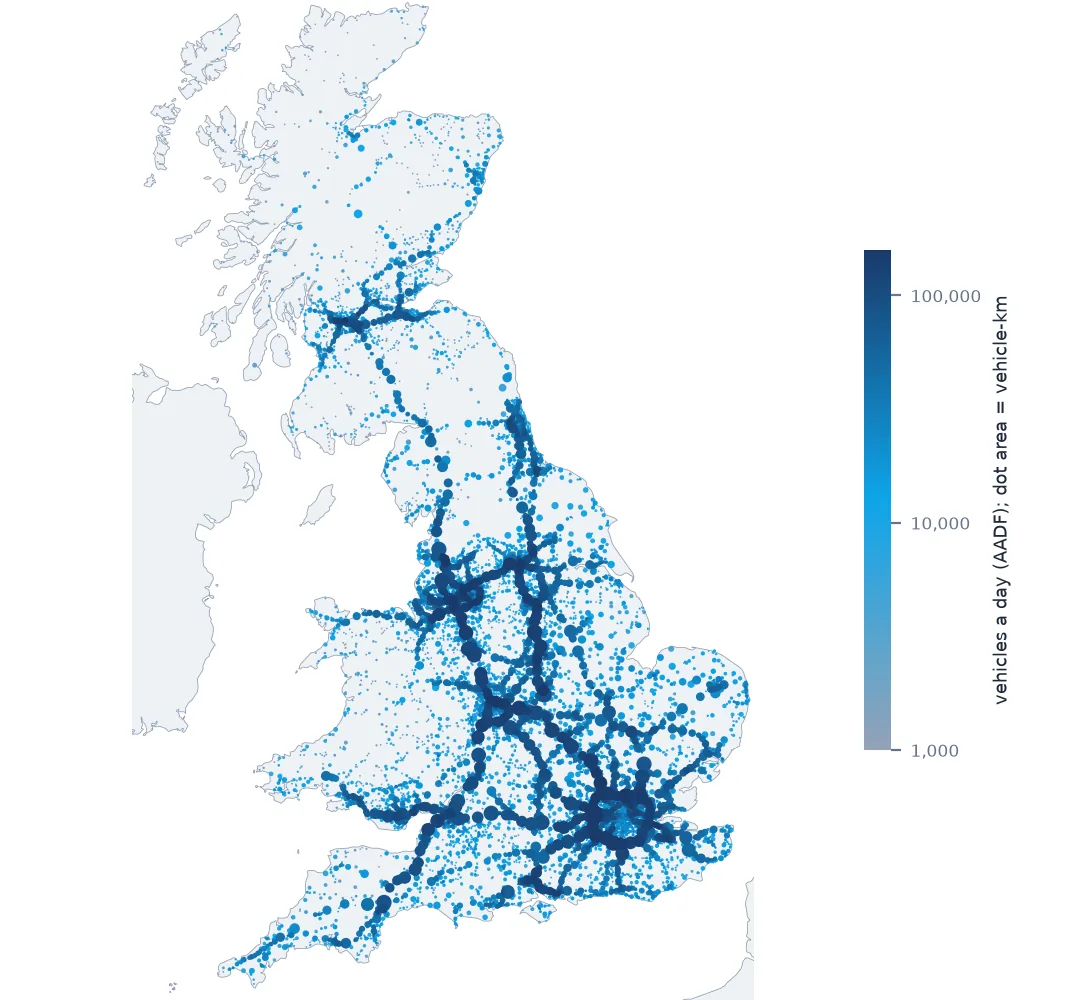
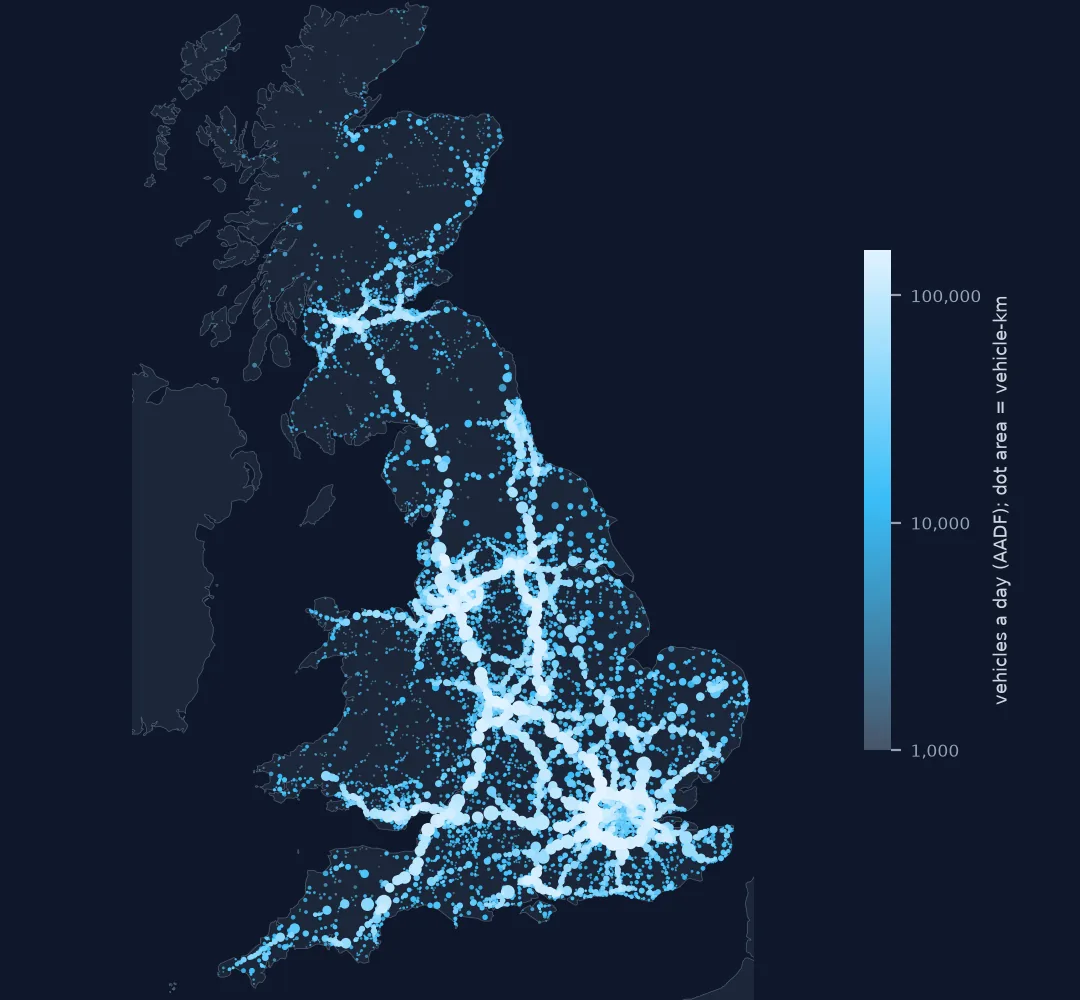
Trunk motorways are 7.2% of major-road length and carry 31.9% of major-road travel; principal A roads are 75.7% of the length and carry 46.5%. A map of roads and a map of traffic are different maps.
3. By region
reg = y.groupby("region_name").agg(km=("link_length_km", "sum"), vkm_bn=("vkm_bn", "sum"))
reg["vehicles per km of road per day"] = reg.vkm_bn * 1e9 / 365 / reg.km
print(reg.sort_values("vehicles per km of road per day", ascending=False).round(1).to_string())
km vkm_bn vehicles per km of road per day
region_name
London 1822.7 18.5 27749.8
South East 6006.0 60.7 27680.9
East of England 4329.2 41.5 26275.8
North West 4773.1 41.8 24012.3
West Midlands 4078.4 34.4 23081.1
Yorkshire and The Humber 3868.0 30.4 21550.2
East Midlands 4152.9 31.5 20748.4
North East 1881.7 13.5 19609.4
South West 5355.5 35.4 18134.7
Wales 4414.5 19.9 12377.0
Scotland 10852.2 32.1 8114.4
Per kilometre of major road, London and the South East are busiest, at 27,749.8 and 27,680.9 vehicles a day; Scotland's major roads average 8,114, under a third as many, with long rural trunk roads in the total. The South East has the most major-road travel of any region, 60.7 billion vehicle-km.
4. By vehicle type
cols = {"cars_and_taxis": "cars", "LGVs": "vans", "all_HGVs": "lorries", "buses_and_coaches": "buses"}
vk = {v: (major[c] * major.link_length_km * 365 / 1e9).groupby(major.year).sum() for c, v in cols.items()}
vk = pd.DataFrame(vk)
print(vk.loc[[2000, 2010, 2019, 2020, 2025]].round(1).to_string())
print("change 2000-2025:", (100 * (vk.loc[2025] / vk.loc[2000] - 1)).round(0).to_dict())
cars vans lorries buses
year
2000 237.6 31.9 24.5 2.7
2010 249.0 40.3 23.4 2.6
2019 272.1 53.2 25.5 2.1
2020 195.6 47.4 23.7 1.3
2025 270.3 61.1 24.2 1.7
change 2000-2025: {'cars': 14.0, 'vans': 92.0, 'lorries': -1.0, 'buses': -35.0}
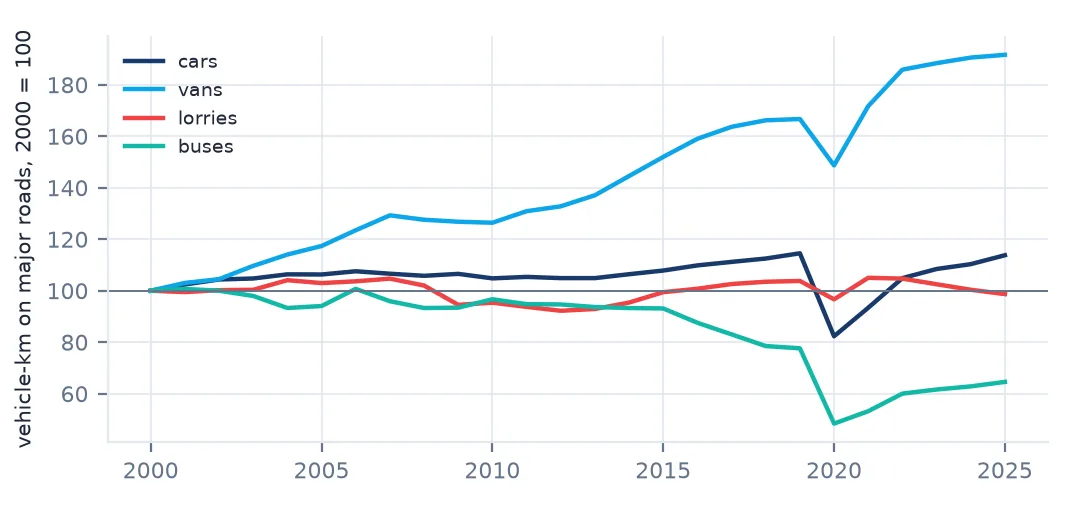
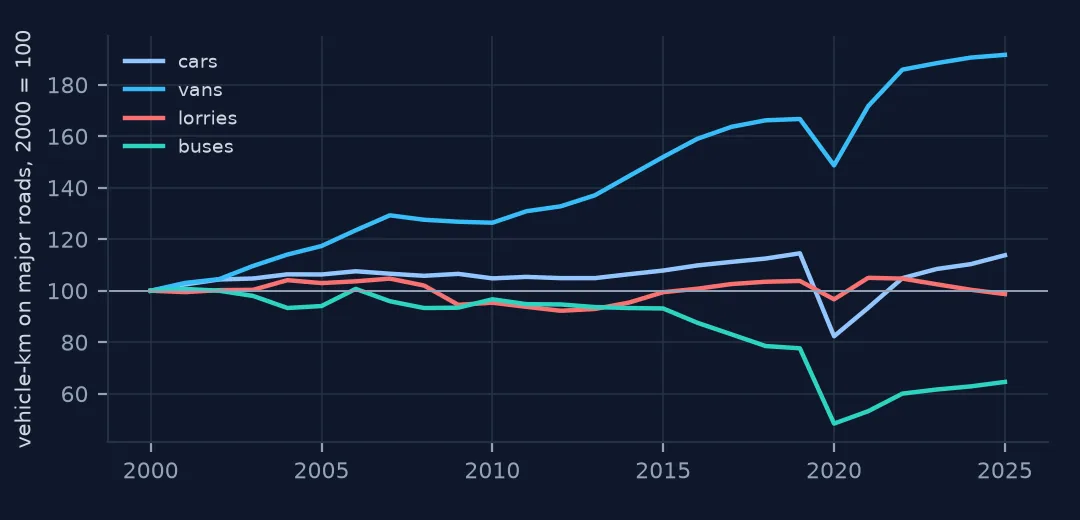
Over 25 years, van travel on major roads grew 92%, from 31.9 to 61.1 billion km, while car travel grew 14%, lorry travel stayed flat (−1%) and bus travel fell 35%. The rise of the van is the largest change in what drives on British major roads.
A network that changes
The data used on this page
The Department for Transport's road traffic statistics: annual average daily flows (AADF) for every count point in Great Britain, 2000–2025, in the release of 2 June 2026, saved on this site because DfT revises earlier years with each release. Contains public sector information licensed under the Open Government Licence v3.0.
from pathlib import Path

import numpy as np
import pandas as pd
import requests

Path("data").mkdir(exist_ok=True)
# DfT republishes the counts every June and revises earlier years; this is the release of 2 June 2026
# (live: https://storage.googleapis.com/dft-statistics/road-traffic/downloads/data-gov-uk/dft_traffic_counts_aadf.zip).
AADF = "dft-traffic-counts-aadf-2026-06-02.zip"
if not Path(f"data/{AADF}").exists():
    Path(f"data/{AADF}").write_bytes(requests.get(f"https://data.spatialworkflow.io/{AADF}", timeout=600).content)
aadf = pd.read_csv(f"data/{AADF}", low_memory=False)
print(f"{len(aadf):,} rows, {aadf.count_point_id.nunique():,} count points, {aadf.year.min()}-{aadf.year.max()}")
600,551 rows, 46,754 count points, 2000-2025
Example 1: the network itself changes
km = major.groupby("year").link_length_km.sum()
print(km.loc[[2000, 2010, 2019, 2020, 2025]].round(0).to_string())
print(f"links per year: {major.groupby('year').size().loc[[2000, 2025]].to_dict()}")
year
2000 50074.0
2010 50254.0
2019 51191.0
2020 51229.0
2025 51534.0
links per year: {2000: 17675, 2025: 17941}
The major-road network in the file grew from 50,074 km to 51,534 km between 2000 and 2025, and from 17,675 links to 17,941. Part of any long-run growth in vehicle-kilometres is new road, and part is reclassification; per-kilometre figures remove both.
Example 2: per kilometre, per region, over time
den = major.groupby(["year", "region_name"]).apply(lambda g: g.vkm_bn.sum() * 1e9 / 365 / g.link_length_km.sum(), include_groups=False).unstack()
print((den.loc[2025] / den.loc[2019] - 1).mul(100).round(1).sort_values().to_string())
region_name
London -7.0
South East -1.2
Scotland -0.1
Yorkshire and The Humber 0.1
Wales 0.9
West Midlands 1.0
East of England 1.2
East Midlands 1.2
South West 1.7
North West 3.2
North East 4.8
Per kilometre of road, traffic in 2025 was still 7.0% below 2019 in London and 1.2% below in the South East, while the North East was 4.8% above and the North West 3.2%. The recovery from 2020 has been uneven, and least complete where traffic was densest.
From flows to distances
An AADF on a major-road link is DfT's estimate of the average daily flow along that whole link, between the junctions named in the file. Multiplying by the link length assumes the flow is uniform along it, which is roughly true between junctions and is how DfT itself builds its major-road estimates. Multiplying by the days in the year turns a day into a year. The sum over links is then total travel on the network the file covers.
Two things limit the totals. Minor roads carry a large share of Britain's traffic but have no link lengths here, so these figures are major roads only. And the method inherits every property of the AADFs: most are estimates in any given year (estimated rows), so a single link's vehicle-kilometres in a single year are a projection, while regional and national totals are what the data is built to support.
Pitfalls with vehicle-kilometres
- Major roads only. Minor-road points have no length.
- The network grows. Compare per kilometre for change over time.
- Use the right number of days for leap years if the last per cent matters.
- Totals by region depend on boundaries; links on a boundary belong to one authority.
- Single-link figures are projections in most years.
Internal links
- How to read UK road traffic counts — links, points and lengths
- How to calculate road collision rates per vehicle-kilometre — vehicle-km as a denominator
- How to map lorry traffic and freight corridors — lorries link by link
- Annual average daily flow explained — what each AADF stands for
FAQ
How many vehicle-kilometres are driven on Britain's major roads?
359.7 billion in 2025 by the DfT count file's major-road links, against 355.2 billion in 2019 and 269.7 billion in 2020.
How has van traffic changed in the UK?
On major roads, van vehicle-kilometres grew 92% from 2000 to 2025, from 31.9 to 61.1 billion, against 14% for cars.