
Average Traffic Drops When the Survey Adds Minor Roads
On this page
Problem statement
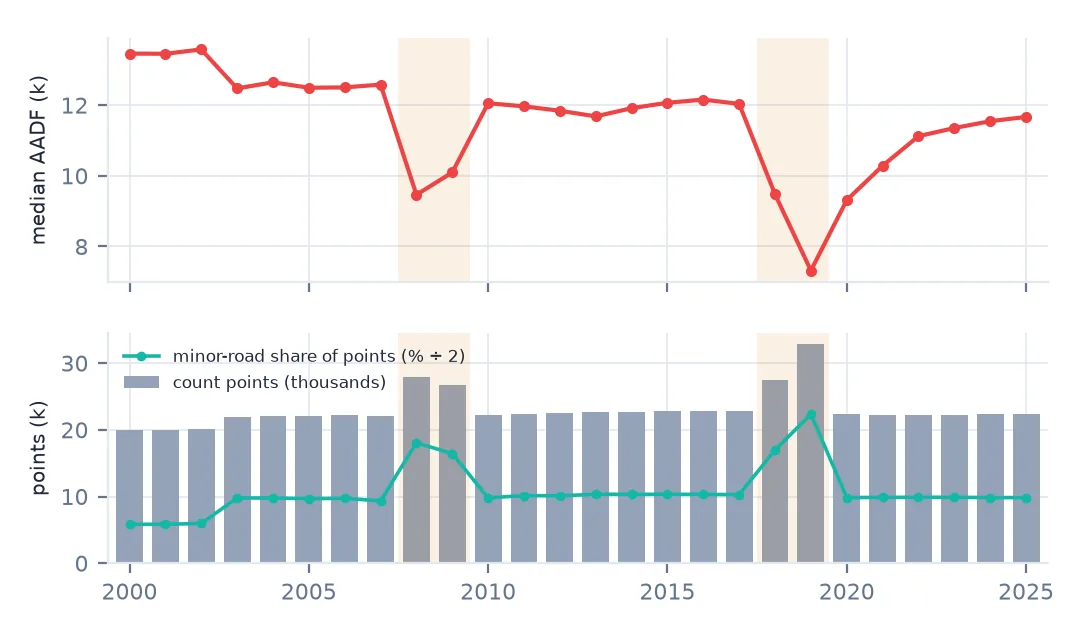
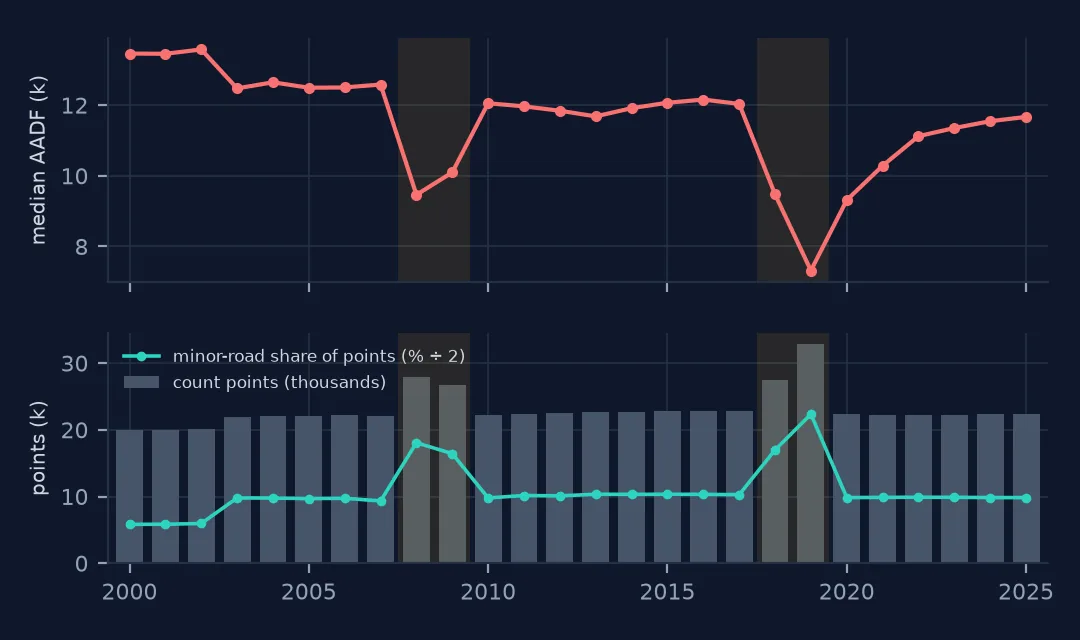
Plot the median annual average daily flow of Britain's traffic count points by year and you will see traffic fall by a fifth from 2017 to 2018 and by another quarter in 2019, then bounce back in 2020 — the first year of the pandemic. None of that happened on the roads. The Department for Transport added thousands of minor-road count points to its sample in 2018 and 2019 and dropped most of them again in 2020; minor roads carry a tenth of the traffic of major ones, so the median followed the sample, not the traffic.
This is the classic trap of comparing summaries of a changing sample. This page measures it in the DfT count file and shows two fixes: comparing the same points, and reweighting road categories to a fixed mix.
Quick answer
Before trending any summary, put the number of points and the mix of road types next to it:
med = aadf.groupby("year").all_motor_vehicles.median()
mix = aadf.groupby("year").road_type.apply(lambda s: (s == "Minor").mean())
print(pd.DataFrame({"points": aadf.groupby("year").size(), "median AADF": med, "minor-road share": mix.round(3)})
      .loc[[2007, 2008, 2009, 2010, 2015, 2016, 2017, 2018, 2019, 2020, 2021]].to_string())
points median AADF minor-road share
year
2007 22003 12583.0 0.187
2008 27992 9464.0 0.361
2009 26690 10097.0 0.329
2010 22257 12054.0 0.196
2015 22754 12068.0 0.207
2016 22786 12157.5 0.206
2017 22850 12035.5 0.206
2018 27543 9476.0 0.339
2019 32903 7319.0 0.447
2020 22373 9312.0 0.197
2021 22297 10286.0 0.197
The median dropped from 12,035.5 vehicles a day in 2017 to 9,476 in 2018 and 7,319 in 2019, exactly as the sample grew from 22,850 points to 32,903 and the share of minor-road points rose from 20.6% to 44.7%. In 2020 the sample shrank back to 22,373 points and the median rose to 9,312 — in a year when traffic actually fell sharply. The same thing had happened once before: in 2008 the minor-road share rose from 18.7% to 36.1% and the median fell from 12,583 to 9,464, recovering to 12,054 in 2010 when the extra points went.
Diagnosing a sample change
1. Within each road type, nothing fell
print(aadf[aadf.year.between(2016, 2021)].pivot_table(index="year", columns="road_type", values="all_motor_vehicles",
                                                      aggfunc="median").to_string())
road_type Major Minor
year
2016 15170.0 1368.0
2017 14928.5 1367.5
2018 14790.0 1325.0
2019 14818.0 1304.0
2020 11443.0 1069.0
2021 12753.0 1169.0
Split by road type, the 2018 and 2019 collapse disappears: major roads hold steady between 14,790 and 15,170 from 2016 to 2019 and minor roads between 1,304 and 1,368, and both then fall in 2020, as traffic did. The overall median moved because the weights between the two groups moved.
2. Which points came and went
pts = aadf.groupby("year").count_point_id.apply(set)
added_2019 = pts[2019] - pts[2018]
dropped_2020 = pts[2019] - pts[2020]
print(f"in 2019 but not 2018: {len(added_2019):,}; in 2019 but not 2020: {len(dropped_2020):,}; overlap {len(added_2019 & dropped_2020):,}")
new = aadf[(aadf.year == 2019) & aadf.count_point_id.isin(added_2019)]
print(new.road_category.value_counts().to_dict(), f"median AADF {new.all_motor_vehicles.median():,.0f}")
in 2019 but not 2018: 5,661; in 2019 but not 2020: 10,952; overlap 3,209
{'MCU': 4613, 'MB': 753, 'PA': 207, 'TA': 78, 'TM': 10} median AADF 1,391
5,661 points appear in 2019 that were not there in 2018, and 10,952 points of 2019 are gone in 2020. Almost all the new 2019 points are minor roads — 4,613 C or unclassified and 753 B roads — with a median of 1,391 vehicles a day.
3. Fix one: compare like with like
stay = set.intersection(*[pts[y] for y in range(2015, 2022)])
fixed = aadf[aadf.count_point_id.isin(stay) & aadf.year.between(2015, 2021)].groupby("year").all_motor_vehicles.median()
print(f"{len(stay):,} points present every year 2015-2021; their median AADF:")
print(fixed.to_string())
16,350 points present every year 2015-2021; their median AADF:
year
2015 15219.0
2016 15262.0
2017 14971.0
2018 14836.0
2019 14856.5
2020 11449.5
2021 12740.0
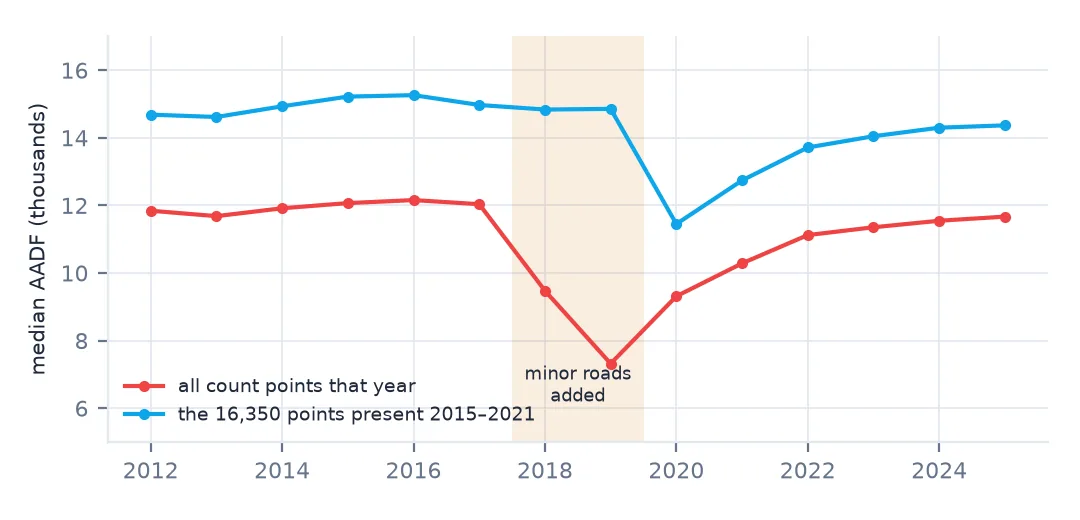
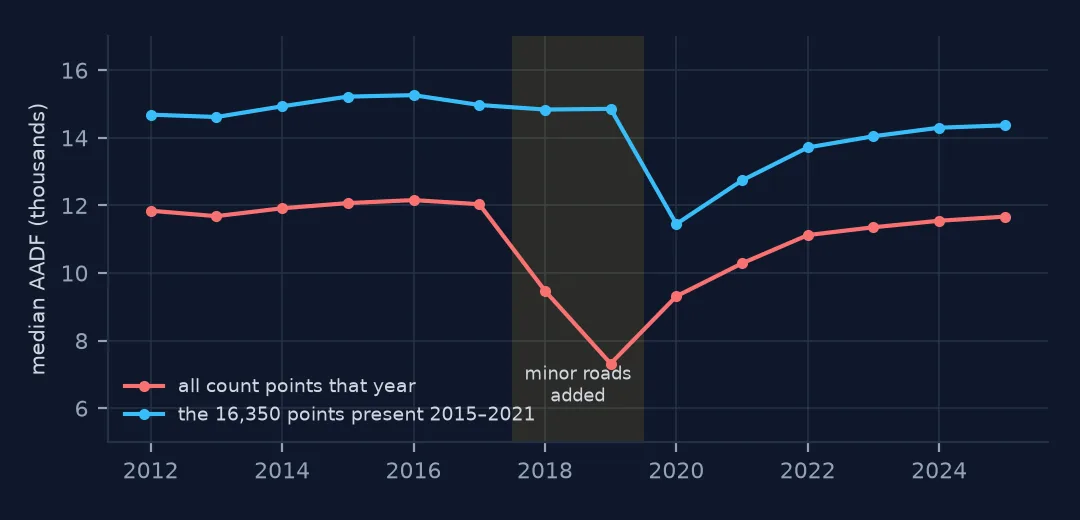
Restricting to the 16,350 points present in every year from 2015 to 2021 gives a median that drifts gently from 15,219 to 14,856.5 and then drops to 11,449.5 in 2020: the real pattern, with the pandemic where it belongs.
4. Fix two: stratify and reweight
w = aadf[aadf.year == 2018].road_category.value_counts(normalize=True)
strat = aadf[aadf.year.between(2015, 2021)].groupby(["year", "road_category"]).all_motor_vehicles.median().unstack()
print("median AADF by road category, weighted to the 2018 mix of categories:")
print((strat * w).sum(axis=1).round(0).to_string())
median AADF by road category, weighted to the 2018 mix of categories:
year
2015 12912.0
2016 13099.0
2017 12969.0
2018 12901.0
2019 12967.0
2020 9774.0
2021 11049.0
The second fix keeps every point but weights each road category's median by a fixed mix — here the 2018 shares. The weighted series runs flat between 12,901 and 13,099 until 2019 and drops to 9,774 in 2020. Either fix removes the false collapse; the fixed panel is simpler to explain, the weighted one keeps more data.
The mean and the regions
The data used on this page
The Department for Transport's road traffic statistics: annual average daily flows (AADF) for every count point in Great Britain, 2000–2025, in the release of 2 June 2026, saved on this site because DfT revises earlier years with each release. Contains public sector information licensed under the Open Government Licence v3.0.
from pathlib import Path

import numpy as np
import pandas as pd
import requests

Path("data").mkdir(exist_ok=True)
# DfT republishes the counts every June and revises earlier years; this is the release of 2 June 2026
# (live: https://storage.googleapis.com/dft-statistics/road-traffic/downloads/data-gov-uk/dft_traffic_counts_aadf.zip).
AADF = "dft-traffic-counts-aadf-2026-06-02.zip"
if not Path(f"data/{AADF}").exists():
    Path(f"data/{AADF}").write_bytes(requests.get(f"https://data.spatialworkflow.io/{AADF}", timeout=600).content)
aadf = pd.read_csv(f"data/{AADF}", low_memory=False)
print(f"{len(aadf):,} rows, {aadf.count_point_id.nunique():,} count points, {aadf.year.min()}-{aadf.year.max()}")
600,551 rows, 46,754 count points, 2000-2025
Example 1: the mean is no safer
print(pd.DataFrame({"mean, all points": aadf.groupby("year").all_motor_vehicles.mean(),
                    "mean, fixed points": aadf[aadf.count_point_id.isin(stay)].groupby("year").all_motor_vehicles.mean()})
      .loc[2016:2021].round(0).to_string())
mean, all points mean, fixed points
year
2016 17777.0 21784.0
2017 17858.0 21855.0
2018 15230.0 21751.0
2019 13307.0 21945.0
2020 13924.0 16852.0
2021 15617.0 18883.0
The mean is no protection: over all points it falls from 17,858 in 2017 to 13,307 in 2019, while over the fixed points it stays between 21,751 and 21,945 until the pandemic. Any summary of a changing sample — mean, median, total — measures the sample.
Example 2: the same trap by region
reg = aadf[aadf.year.isin([2018, 2019])].groupby(["region_name", "year"]).agg(points=("count_point_id", "size"), median=("all_motor_vehicles", "median")).unstack()
reg["median change"] = reg[("median", 2019)] / reg[("median", 2018)] - 1
print(reg.sort_values("median change").round(3).head(5).to_string())
points median median change
year 2018 2019 2018 2019
region_name
South West 2576 3359 7616.0 4553.0 -0.402
East of England 2650 3286 8754.5 5686.5 -0.350
East Midlands 2052 2528 9014.0 6730.5 -0.253
Yorkshire and The Humber 2256 2748 9478.5 7425.5 -0.217
South East 3794 4456 10361.5 8150.5 -0.213
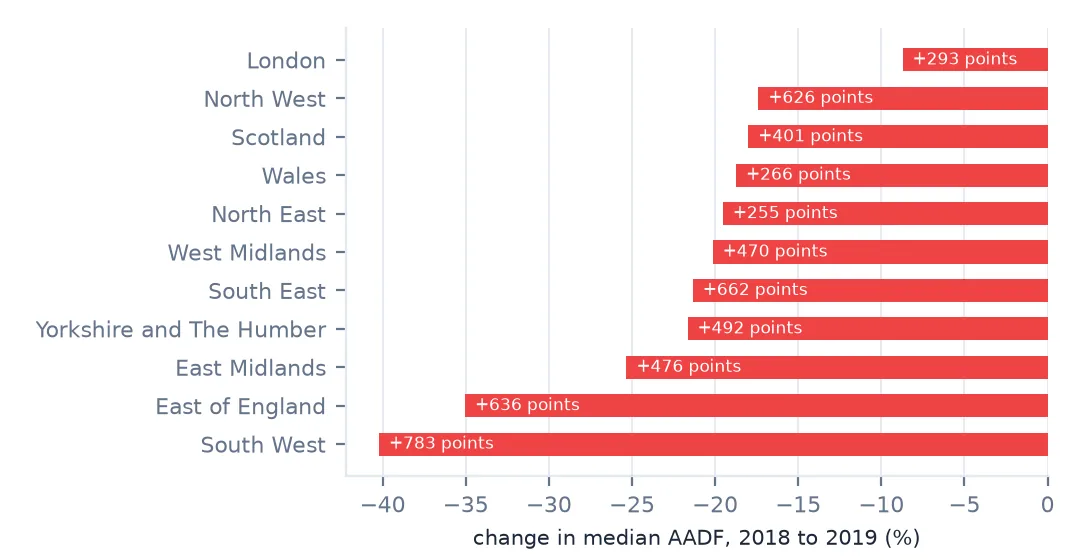
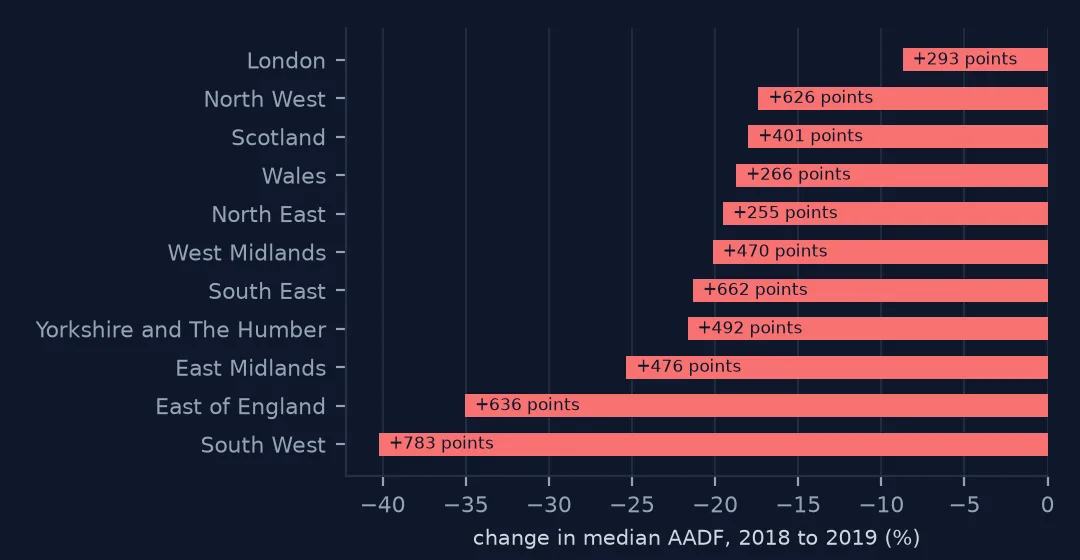
Regional comparisons inherit the trap. The South West's median fell 40.2% between 2018 and 2019 and the East of England's 35.0% — the regions where the most minor-road points were added — while nothing comparable happened to their traffic.
A summary of a sample describes the sample
A median of count points is a statistic of the points, and the points were chosen for a purpose: to estimate national traffic with as little survey effort as possible. When that design changed — more minor-road points for a better estimate of minor-road traffic — every summary that mixes road types changed with it. The same happens with any rotating survey: house-price indexes when the mix of sales shifts, air-quality averages when monitors are added, species counts when new sites join a recording scheme.
The fix is always one of two things: hold the sample fixed, or hold the weights fixed. Holding the sample fixed answers "what happened at these places"; holding the weights fixed answers "what happened to a typical place of each kind". Neither is the national total, which needs road lengths and the full network — vehicle-kilometres do that for major roads.
Checks before trending a summary
- Print the count of points next to every summary. A jump in the count is a warning.
- Print the mix. Here, the share of minor-road points.
- Split by stratum. If the parts are steady and the whole moves, the mix moved.
- Means fail the same way as medians.
- 2008–2009 and 2018–2019 are the affected years in the DfT file; 2020 and 2021 return to 22,373 and 22,297 points.
Internal links
- How to measure traffic trends from count points that were actually counted — the trend done properly
- How to read UK road traffic counts — road categories and count points
- Traffic counts that all grow by the same percentage — the other trap in the same file
FAQ
Why does UK traffic appear to fall in 2018 and 2019 in the count data?
Because DfT added thousands of minor-road count points in those years. The median AADF of all points fell from 12,035.5 in 2017 to 7,319 in 2019, while major and minor roads separately stayed flat.
How do I compare traffic counts between years correctly?
Compare the same count points across the years, or weight each road category by a fixed share.